Mulberry, IN (Indiana) Houses and Residents
| Mulberry: | $133,791 |
| Indiana: | $208,700 |
Mean price in 2022:
Detached houses: $188,727
Here: $188,727 State: $257,916 Townhouses or other attached units: $116,928
Here: $116,928 State: $224,114 In 2-unit structures: $150,705
Here: $150,705 State: $175,375
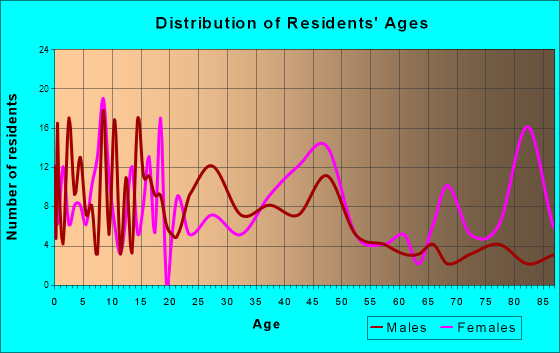
Total population: 1,247 (Urban population: 0, Rural population: 1,404 (3 farm, 1,401 nonfarm))
Houses: 492 (474 occupied: 383 owner occupied, 96 renter occupied)
| % of renters here: | 20% |
| State: | 29% |
Housing density: 837 houses/condos per square mile
Median price asked for vacant for-sale houses and condos in 2022 in this county: $107,960.
Median contract rent in 2022: $826 (lower quartile is $619, upper quartile is $937)
Median rent asked for vacant for-rent units in 2022: $214
Median gross rent in Mulberry, IN in 2022: $967
Housing units in Mulberry with a mortgage: 210 (19 second mortgage, 6 home equity loan, 11 both second mortgage and home equity loan)
Houses without a mortgage: 49
Median household income for houses/condos with a mortgage: $56,256
Median household income for apartments without a mortgage: $38,483
Median monthly housing costs: $731
Compare current foreclosures near Mulberry, IN:
| Photo | Address | Area | Beds / Baths | Price | Details |
|---|---|---|---|---|---|

|
#1
Center St
Mulberry, IN 46058
|
1,949 sq. feet
|
3 baths 4 beds |
$258,900
|
show details |

|
#2
S Hobson St
Mulberry, IN 46058
|
1,576 sq. feet
|
1 baths 4 beds |
show details | |

|
#3
W Mulberry Jefferson Rd
Mulberry, IN 46058
|
1,302 sq. feet
|
2 baths 3 beds |
show details | |

|
#4
N County Road 400 W
Frankfort, IN 46041
|
1,512 sq. feet
|
1 baths 3 beds |
$147,000
|
show details |

|
#5
E Little St
Flora, IN 46929
|
1,680 sq. feet
|
1 baths 3 beds |
$215,000
|
show details |

|
#6
W Mcclurg St
Frankfort, IN 46041
|
2,714 sq. feet
|
1 baths 2 beds |
show details | |

|
#7
Stair Rd
Lafayette, IN 47905
|
1,178 sq. feet
|
2 baths 3 beds |
show details | |

|
#8
John St
Frankfort, IN 46041
|
864 sq. feet
|
1 baths 2 beds |
show details | |

|
#9
S 30th St
Lafayette, IN 47904
|
624 sq. feet
|
1 baths 2 beds |
show details | |

|
#10
Franklin
Delphi, IN 46923
|
1,916 sq. feet
|
1 baths 3 beds |
show details |
| Photo | Address | Area | Beds / Baths | Price | Details |
|---|---|---|---|---|---|

|
#11
E Main St
Rossville, IN 46065
|
1,880 sq. feet
|
2 baths 3 beds |
show details | |

|
#12
W County Road 200 S
Frankfort, IN 46041
|
1,090 sq. feet
|
1 baths 3 beds |
show details | |

|
#13
E Boone St
Frankfort, IN 46041
|
2,461 sq. feet
|
2 baths 5 beds |
show details | |

|
#14
N County Road 700 E
Michigantown, IN 46057
|
2,926 sq. feet
|
2 baths 4 beds |
show details | |

|
#15
W 132 N
Delphi, IN 46923
|
1,540 sq. feet
|
2 baths 3 beds |
show details | |

|
#16
S Williams Rd
Frankfort, IN 46041
|
1,943 sq. feet
|
2 baths 3 beds |
show details | |

|
#17
N Wildwood Dr
Frankfort, IN 46041
|
4,056 sq. feet
|
3 baths 4 beds |
show details | |

|
#18
E Walnut St
Frankfort, IN 46041
|
942 sq. feet
|
1 baths 2 beds |
show details | |

|
#19
W Meredith St
Frankfort, IN 46041
|
992 sq. feet
|
2 baths 2 beds |
show details | |

|
#20
N Market St
Thorntown, IN 46071
|
1,084 sq. feet
|
2 baths 3 beds |
show details |
| Photo | Address | Area | Beds / Baths | Price | Details |
|---|---|---|---|---|---|

|
#21
E Morrison St
Frankfort, IN 46041
|
1,044 sq. feet
|
1 baths 2 beds |
show details | |

|
#22
W Antioch Rd
Frankfort, IN 46041
|
1,613 sq. feet
|
1 baths 3 beds |
show details | |

|
#23
N State Road 29
Michigantown, IN 46057
|
2,552 sq. feet
|
2 baths 3 beds |
show details | |

|
#24
S Maish Rd
Frankfort, IN 46041
|
2,392 sq. feet
|
1 baths 3 beds |
show details | |

|
#25
Walnut Ridge Rd
Lafayette, IN 47909
|
1,624 sq. feet
|
2 baths - beds |
show details | |

|
#26
E Jefferson St
Frankfort, IN 46041
|
1,924 sq. feet
|
1 baths 2 beds |
show details | |

|
#27
N County Road 0 Ew
Frankfort, IN 46041
|
1,486 sq. feet
|
2 baths 3 beds |
show details | |

|
#28
S Sycamore St
Flora, IN 46929
|
1,184 sq. feet
|
1 baths 2 beds |
show details | |

|
#29
Hawthorne Ave
Frankfort, IN 46041
|
1,065 sq. feet
|
1 baths 3 beds |
show details | |

|
#30
E Columbia St
Flora, IN 46929
|
1,128 sq. feet
|
1 baths 2 beds |
show details |
| Photo | Address | Area | Beds / Baths | Price | Details |
|---|---|---|---|---|---|

|
#31
Delphi Ave
Frankfort, IN 46041
|
1,508 sq. feet
|
1 baths 3 beds |
show details | |

|
#32
N Clay St
Frankfort, IN 46041
|
1,803 sq. feet
|
1 baths 3 beds |
show details | |

|
#33
W Jackson St
Frankfort, IN 46041
|
1,064 sq. feet
|
1 baths 3 beds |
show details | |

|
#34
John St
Frankfort, IN 46041
|
984 sq. feet
|
1 baths 2 beds |
show details | |

|
#35
E Jackson St
Flora, IN 46929
|
1,064 sq. feet
|
1 baths 2 beds |
show details | |

|
#36
S 5th St
Frankfort, IN 46041
|
1,395 sq. feet
|
1 baths 2 beds |
show details | |

|
#37
Gentry St
Frankfort, IN 46041
|
1,092 sq. feet
|
1 baths 3 beds |
show details | |

|
#38
W South St
Frankfort, IN 46041
|
1,000 sq. feet
|
1 baths 3 beds |
show details | |

|
#39
Evergreen Blvd
Linden, IN 47955
|
1,278 sq. feet
|
2 baths 3 beds |
show details | |

|
#40
Perrin Ave # 1
Lafayette, IN 47904
|
- sq. feet
|
- baths - beds |
show details |
| Photo | Address | Area | Beds / Baths | Price | Details |
|---|---|---|---|---|---|

|
#41
Autumn Ln
Lafayette, IN 47909
|
- sq. feet
|
- baths - beds |
show details | |

|
#42
E 300 S # J7
Lafayette, IN 47909
|
- sq. feet
|
- baths - beds |
show details | |

|
#43
Holly Dr
Lafayette, IN 47909
|
- sq. feet
|
- baths - beds |
show details | |

|
#44
N 24th St
Lafayette, IN 47904
|
- sq. feet
|
- baths - beds |
show details | |

|
#45
Jett St
Lafayette, IN 47905
|
- sq. feet
|
- baths - beds |
show details | |

|
#46
Scott St
Lafayette, IN 47904
|
- sq. feet
|
- baths - beds |
show details | |

|
#47
S 9th St Apt C
Lafayette, IN 47909
|
- sq. feet
|
- baths - beds |
show details | |

|
#48
Union St Apt 325
Lafayette, IN 47904
|
- sq. feet
|
- baths - beds |
show details | |

|
#49
Rainbow Dr
Lafayette, IN 47904
|
- sq. feet
|
- baths - beds |
show details | |

|
Check over 1 million property listings on Foreclosure.com!
|
browse all offers | |||

Latest news about housing in Mulberry, IN collected exclusively by city-data.com from local newspapers, TV, and radio stations

 | Home Buying in Lafayette/W.Lafayette - help on communities (2 replies) |
| how welcoming are teens to newcomers in Zionsville, IN (7 replies) |
| Madison, IN Questions (28 replies) |
| From Chicago to Lafayette (8 replies) |
| Moving to Evansville (42 replies) |
Median year apartment built: 1939
Household type by relationship:
Households: 1,291- Male householders: 220 (89 living alone), Female householders: 249 (102 living alone)
163 spouses (163 opposite-sex spouses), 57 unmarried partners, (57 opposite-sex unmarried partners), 345 children (289 natural, 38 adopted, 18 stepchildren), 50 grandchildren, 9 brothers or sisters, 3 parents, 8 foster children, 15 other relatives, 14 non-relatives
- In group quarters: 155
Size of family households: 100 2-persons, 58 3-persons, 66 4-persons, 16 5-persons, 14 6-persons, 2 7-or-more-persons.
Size of nonfamily households: 197 1-person, 23 2-persons.
147 married couples with children.
124 single-parent households (43 men, 81 women).
96.7% of residents of Mulberry speak English at home.
3.2% of residents speak Spanish at home (26% speak English very well, 39% speak English well, 11% speak English not well, 24% don't speak English at all).
0.3% of residents speak other Indo-European language at home (100% speak English well).
Foreign born population: 39 (3.0%)
(46.2% of them are naturalized citizens)
| Here: | 7.0 |
| State: | 6.6 |
| Here: | 5.2 |
| State: | 4.3 |

- Bedrooms in owner-occupied houses and condos in Mulberry, Indiana
- 0no bedroom
- 61 bedroom
- 1102 bedrooms
- 1733 bedrooms
- 824 bedrooms
- 125+ bedrooms

- Bedrooms in renter-occupied apartments in Mulberry, Indiana
- 18no bedroom
- 141 bedroom
- 272 bedrooms
- 93 bedrooms
- 284 bedrooms
- 05+ bedrooms

- Cars and other vehicles available in Mulberry in owner-occupied houses/condos
- 8no vehicle
- 1671 vehicle
- 1372 vehicles
- 553 vehicles
- 74 vehicles
- 85+ vehicles

- Cars and other vehicles available in Mulberry in renter-occupied apartments
- 29no vehicle
- 381 vehicle
- 142 vehicles
- 03 vehicles
- 154 vehicles
- 05+ vehicles

- Rooms in owner-occupied houses in Mulberry, Indiana
- 01 room
- 02 rooms
- 133 rooms
- 224 rooms
- 455 rooms
- 786 rooms
- 717 rooms
- 848 rooms
- 709+ rooms

- Rooms in renter-occupied apartments in Mulberry, Indiana
- 181 room
- 32 rooms
- 143 rooms
- 74 rooms
- 65 rooms
- 156 rooms
- 147 rooms
- 08 rooms
- 179+ rooms


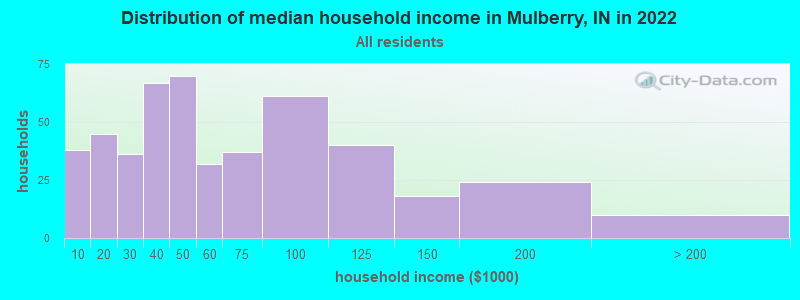
Mulberry, IN household income distribution

- 38Less than $10,000
- 45$10,000 to $19,999
- 36$20,000 to $29,999
- 67$30,000 to $39,999
- 70$40,000 to $49,999
- 32$50,000 to $59,999
- 37$60,000 to $74,999
- 61$75,000 to $99,999
- 40$100,000 to $124,999
- 18$125,000 to $149,999
- 24$150,000 to $199,999
- 10$200,000 or more
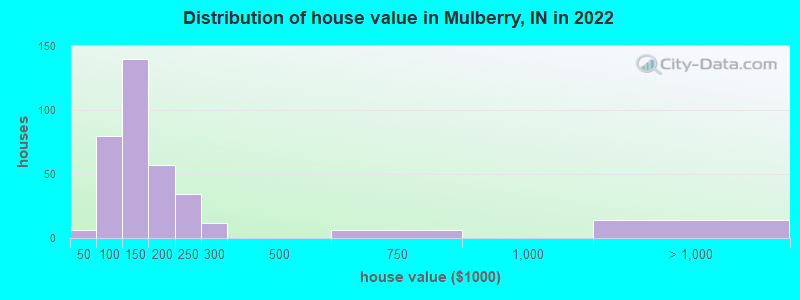
Home value of owner - occupied houses in 2022 in Mulberry, IN
-
- 4Less than $10,000
- 2$20,000 to $24,999
- 7$50,000 to $59,999
- 32$60,000 to $69,999
- 12$70,000 to $79,999
- 12$80,000 to $89,999
- 14$90,000 to $99,999
- 113$100,000 to $124,999
- 26$125,000 to $149,999
- 31$150,000 to $174,999
- 25$175,000 to $199,999
- 34$200,000 to $249,999
- 11$250,000 to $299,999
- 5$500,000 to $749,999
- 13$1,500,000 to $1,999,999
Rent paid by renters in 2022 in Mulberry, IN
-
- 12$150 to $199
- 1$450 to $499
- 5$500 to $549
- 3$600 to $649
- 12$650 to $699
- 23$800 to $899
- 3$900 to $999
- 16$1,000 to $1,249
- 15No cash rent


Percentage of workers working in this county: 34.2%
Number of people working at home: 28 (5.8% of all workers)
Travel time to work (commute)
- Less than 5 minutes: 16
- 5 to 9 minutes: 56
- 10 to 14 minutes: 47
- 15 to 19 minutes: 95
- 20 to 24 minutes: 112
- 25 to 29 minutes: 28
- 30 to 34 minutes: 64
- 35 to 39 minutes: 6
- 40 to 44 minutes: 2
- 45 to 59 minutes: 10
- 60 to 89 minutes: 8
- 90 or more minutes: 3
Means of transportation to work:
- Drove a car alone: 531 (86.3%)
- Carpooled: 57 (9.3%)
- Walked: 12 (2.0%)
- Other means: 2 (0.3%)
- Worked at home: 13 (2.1%)

- Unemployment by race in 2022
- Unemployment rate for White non-Hispanic residents
- 6.8%Males
- 10.1%Females

- Year of entry for the foreign-born population in Mulberry, Indiana
- 192010 or later
- 22000 to 2009
- 71990 to 1999
- 01980 to 1989
- 31970 to 1979
- 3Before 1970

First ancestries reported:
- American: 85 (16.8%)
- English: 84 (16.6%)
- German: 74 (14.7%)
- Irish: 64 (12.7%)
- French: 26 (5.2%)
- European: 11 (2.2%)
- Scottish: 10 (2.0%)
- Dutch: 6 (1.2%)
- Swedish: 5 (1.0%)
- Turkish: 4 (0.8%)
- Norwegian: 3 (0.6%)
- Czech: 2 (0.4%)
- Belgian: 1 (0.2%)
Most common places of birth for foreign-born residents (%):
| Mulberry: | 89.7% (35) |
| Indiana: | 0.8% (3,114) |
| Mulberry: | 12.8% (5) |
| Indiana: | 1.2% (4,520) |
| Mulberry: | 7.7% (3) |
| Indiana: | 0.1% (204) |
| Mulberry: | 5.1% (2) |
| Indiana: | 1.7% (6,439) |
| Mulberry: | 5.1% (2) |
| Indiana: | 27.0% (101,996) |
Place of birth for U.S.-born residents:
- This state: 1,063
- Other state: 174
- Northeast: 28
- Midwest: 43
- South: 81
- West: 20
84.8% of Mulberry residents lived in the same house 1 years ago.
Out of people who lived in different houses, 17.9% lived in this county.
Out of people who lived in different counties, 90.4% lived in Indiana.
| Mulberry: | 84.8% |
| State average: | 87.1% |
Education attainment for males 25 years and older:
- No schooling: 3
- Nursery to 4th grade: 0
- 5th and 6th grade: 3
- 7th and 8th grade: 2
- 9th grade: 0
- 10th grade: 21
- 11th grade: 11
- 12th grade, no diploma: 4
- High school graduate (or equivalency): 180
- Less than 1 year of college: 44
- Some college more than 1 year, no degree: 39
- Associate degree: 46
- Bachelor's degree: 24
- Master's degree: 7
- Professional school degree: 0
- Doctorate degree: 0

Education attainment for females 25 years and older:
- No schooling: 0
- Nursery to 4th grade: 8
- 5th and 6th grade: 0
- 7th and 8th grade: 10
- 9th grade: 0
- 10th grade: 18
- 11th grade: 6
- 12th grade, no diploma: 0
- High school graduate (or equivalency): 253
- Less than 1 year of college: 28
- Some college more than 1 year, no degree: 55
- Associate degree: 55
- Bachelor's degree: 24
- Master's degree: 11
- Professional school degree: 3
- Doctorate degree: 3


Housing units in structures:
- One, detached: 412
- One, attached: 24
- Two: 25
- 3 or 4: 2
- 10 to 19: 16
- 20 to 49: 12
House/condo owner moved in on average 14 years ago
Renter moved in on average 4 years ago

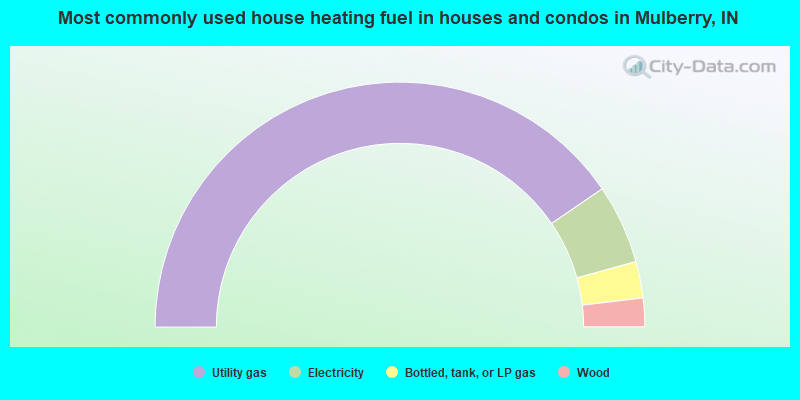
- 81.0%Utility gas
- 10.5%Electricity
- 4.8%Bottled, tank, or LP gas
- 3.8%Wood
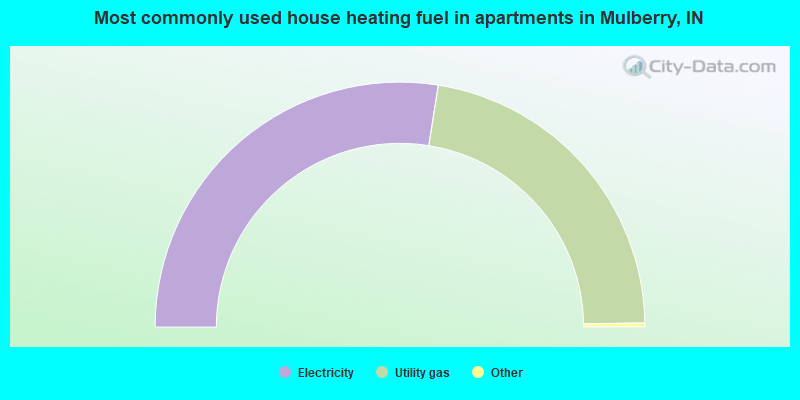
- 55.3%Electricity
- 44.7%Utility gas
Private vs. public school enrollment:
| Here: | 3.8% |
| Indiana: | 14.9% |
| Here: | 0.0% |
| Indiana: | 11.4% |
| Here: | 20.0% |
| Indiana: | 22.3% |


