Narragansett Pier, RI (Rhode Island) Houses and Residents
| Narragansett Pier: | $773,118 |
| Rhode Island: | $383,900 |
Mean price in 2022:
Detached houses: $954,136
Here: $954,136 State: $445,354 Townhouses or other attached units: $566,919
Here: $566,919 State: $371,092 In 3-to-4-unit structures: $830,075
Here: $830,075 State: $315,052 In 5-or-more-unit structures: $258,885
Here: $258,885 State: $291,252
Total population: 3,409 (All urban)
Houses: 2,260 (1,430 occupied: 825 owner occupied, 636 renter occupied)
| % of renters here: | 44% |
| State: | 37% |
Housing density: 624 houses/condos per square mile
Median price asked for vacant for-sale houses and condos in 2022: $6,142,106.
Median contract rent in 2022: $1,407 (lower quartile is $663, upper quartile is $1,889)
Median rent asked for vacant for-rent units in 2022: $1,554
Median gross rent in Narragansett Pier, RI in 2022: $1,662
Housing units in Narragansett Pier with a mortgage: 494 (147 second mortgage, 0 home equity loan, 149 both second mortgage and home equity loan)
Houses without a mortgage: 14
Median household income for houses/condos with a mortgage: $142,970
Median household income for apartments without a mortgage: $96,264
Median monthly housing costs: $1,671
Compare current foreclosures near Narragansett Pier, RI:
| Photo | Address | Area | Beds / Baths | Price | Details |
|---|---|---|---|---|---|

|
#1
Hallville Rd
Exeter, RI 02822
|
943 sq. feet
|
1 baths 2 beds |
$69,900
|
show details |

|
#2
Crestwood Dr
Hope Valley, RI 02832
|
1,320 sq. feet
|
2 baths 3 beds |
show details | |

|
#3
Winnisquam Dr
Warwick, RI 02886
|
2,192 sq. feet
|
2 baths 4 beds |
show details | |

|
#4
Ross Hill Rd
Charlestown, RI 02813
|
2,100 sq. feet
|
2 baths 3 beds |
show details | |

|
#5
Cole Dr
North Kingstown, RI 02852
|
1,483 sq. feet
|
1 baths 3 beds |
show details | |

|
#6
Sachuest Way
Middletown, RI 02842
|
1,640 sq. feet
|
1 baths 4 beds |
show details | |

|
#7
Blue Ridge Dr
Charlestown, RI 02813
|
2,338 sq. feet
|
2 baths 3 beds |
show details | |

|
#8
Fletcher Rd
North Kingstown, RI 02852
|
2,226 sq. feet
|
2 baths 4 beds |
show details | |

|
#9
Shady Grove Rd
Hope Valley, RI 02832
|
2,520 sq. feet
|
3 baths 4 beds |
show details | |

|
#10
Felucca Ave
Jamestown, RI 02835
|
1,050 sq. feet
|
1 baths 3 beds |
show details |
| Photo | Address | Area | Beds / Baths | Price | Details |
|---|---|---|---|---|---|

|
#11
Kenneth Ave
Portsmouth, RI 02871
|
936 sq. feet
|
1 baths 3 beds |
show details | |

|
#12
Clemente Dr
East Greenwich, RI 02818
|
1,170 sq. feet
|
1 baths 3 beds |
show details | |

|
#13
Fenner Hill Rd
Hope Valley, RI 02832
|
1,092 sq. feet
|
1 baths 3 beds |
show details | |

|
#14
Howland Rd
East Greenwich, RI 02818
|
2,642 sq. feet
|
2 baths 2 beds |
show details | |

|
#15
Hargraves Dr
Portsmouth, RI 02871
|
3,405 sq. feet
|
3 baths 4 beds |
show details | |

|
#16
Exchange Rd
West Warwick, RI 02893
|
1,976 sq. feet
|
1 baths 3 beds |
show details | |

|
#17
Longfellow Dr
Coventry, RI 02816
|
1,318 sq. feet
|
1 baths 3 beds |
show details | |

|
#18
South Rd
Exeter, RI 02822
|
1,258 sq. feet
|
1 baths 3 beds |
show details | |

|
#19
E Shore Rd
Jamestown, RI 02835
|
1,535 sq. feet
|
2 baths 3 beds |
show details | |

|
#20
Cardinal Dr
North Kingstown, RI 02852
|
1,166 sq. feet
|
2 baths 2 beds |
show details |
| Photo | Address | Area | Beds / Baths | Price | Details |
|---|---|---|---|---|---|

|
#21
Frank Ave
West Kingston, RI 02892
|
3,029 sq. feet
|
2 baths 5 beds |
show details | |

|
#22
Usquepaugh Rd
West Kingston, RI 02892
|
1,311 sq. feet
|
1 baths 3 beds |
show details | |

|
#23
Old Rose Hill Rd
Wakefield, RI 02879
|
1,132 sq. feet
|
3 baths 3 beds |
show details | |

|
#24
Andre Ave
Wakefield, RI 02879
|
1,306 sq. feet
|
1 baths 3 beds |
show details | |

|
#25
Mulberry Dr
Wakefield, RI 02879
|
2,930 sq. feet
|
2 baths 3 beds |
show details | |

|
#26
Dugway Bridge Rd # C
West Kingston, RI 02892
|
3,024 sq. feet
|
2 baths 3 beds |
show details | |

|
#27
Dinonsie Way
Wakefield, RI 02879
|
2,048 sq. feet
|
2 baths 3 beds |
show details | |

|
#28
Shannon Rd
Exeter, RI 02822
|
3,550 sq. feet
|
3 baths 5 beds |
show details | |

|
#29
Old Post Rd
Wakefield, RI 02879
|
988 sq. feet
|
1 baths 3 beds |
show details | |

|
#30
High St
Wakefield, RI 02879
|
2,400 sq. feet
|
3 baths 5 beds |
show details |
| Photo | Address | Area | Beds / Baths | Price | Details |
|---|---|---|---|---|---|

|
#31
Palm Beach Ave
Narragansett, RI 02882
|
1,404 sq. feet
|
1 baths 3 beds |
show details | |

|
#32
Oak Hill Rd
Wakefield, RI 02879
|
2,100 sq. feet
|
2 baths 4 beds |
show details | |

|
#33
E Woody Hill Rd
Westerly, RI 02891
|
- sq. feet
|
- baths - beds |
show details | |

|
#34
Lehigh Te
Portsmouth, RI 02871
|
- sq. feet
|
- baths - beds |
show details | |

|
#35
Brownell Ln
Portsmouth, RI 02871
|
- sq. feet
|
- baths - beds |
show details | |

|
#36
Patriot Way
West Greenwich, RI 02817
|
- sq. feet
|
- baths - beds |
show details | |

|
#37
Fairview Ave
Hope Valley, RI 02832
|
- sq. feet
|
- baths - beds |
show details | |

|
#38
Quaker Ln Apt 516
East Greenwich, RI 02818
|
- sq. feet
|
- baths - beds |
show details | |

|
#39
Stony Fort Rd
West Kingston, RI 02892
|
- sq. feet
|
- baths - beds |
show details | |

|
#40
Chapel St Apt D
Newport, RI 02840
|
- sq. feet
|
- baths - beds |
show details |
| Photo | Address | Area | Beds / Baths | Price | Details |
|---|---|---|---|---|---|

|
#41
Lauri Dr # 1b
Charlestown, RI 02813
|
- sq. feet
|
- baths - beds |
show details | |

|
#42
Mill St
Newport, RI 02840
|
- sq. feet
|
- baths - beds |
show details | |

|
#43
Admiral Kalbfus Rd Apt 9d
Newport, RI 02840
|
- sq. feet
|
- baths - beds |
show details | |

|
#44
S County Trl
Charlestown, RI 02813
|
- sq. feet
|
- baths - beds |
show details | |

|
#45
Johnson Ln
Charlestown, RI 02813
|
- sq. feet
|
- baths - beds |
show details | |

|
#46
Clearview Dr
West Kingston, RI 02892
|
- sq. feet
|
- baths - beds |
show details | |

|
#47
Broadway
Newport, RI 02840
|
2,016 sq. feet
|
- baths - beds |
show details | |

|
#48
Ranger Rd
Newport, RI 02840
|
- sq. feet
|
- baths - beds |
show details | |

|
#49
Dubois St
Portsmouth, RI 02871
|
- sq. feet
|
- baths - beds |
show details | |

|
Check over 1 million property listings on Foreclosure.com!
|
browse all offers | |||


 | Is Narragansett Pier the place to buy a second home (10 replies) |
| Why is the main entrance to Providence's City Hall closed? (58 replies) |
| Need a hotel room this weekend, sort of stuck (6 replies) |
| Must see/do: what do you recommend a tourist do in Rhode Island? (12 replies) |
| My wife just got a job at URI! (39 replies) |

Median year apartment built: 1957
Household type by relationship:
Households: 2,812- Male householders: 701 (232 living alone), Female householders: 716 (394 living alone)
503 spouses (503 opposite-sex spouses), 20 unmarried partners, (20 opposite-sex unmarried partners), 371 children (325 natural, 35 adopted, 11 stepchildren), 118 grandchildren, 18 brothers or sisters, 58 parents, 0 foster children, 68 other relatives, 145 non-relatives
- In group quarters: 90
Size of family households: 377 2-persons, 107 3-persons, 101 4-persons, 20 5-persons, 6 6-persons.
Size of nonfamily households: 710 1-person, 174 2-persons, 24 3-persons.
177 married couples with children.
14 single-parent households (0 men, 14 women).
93.5% of residents of Narragansett Pier speak English at home.
1.8% of residents speak Spanish at home (100% speak English very well).
2.2% of residents speak other Indo-European language at home (87% speak English very well, 13% speak English well).
4.0% of residents speak other language at home (100% speak English very well).
Foreign born population: 154 (5.5%)
(68.8% of them are naturalized citizens)
| Here: | 6.4 |
| State: | 6.2 |
| Here: | 3.9 |
| State: | 4.1 |

- Bedrooms in owner-occupied houses and condos in Narragansett Pier, Rhode Island
- 0no bedroom
- 81 bedroom
- 1602 bedrooms
- 3453 bedrooms
- 2404 bedrooms
- 725+ bedrooms

- Bedrooms in renter-occupied apartments in Narragansett Pier, Rhode Island
- 32no bedroom
- 1101 bedroom
- 3232 bedrooms
- 1273 bedrooms
- 04 bedrooms
- 445+ bedrooms

- Cars and other vehicles available in Narragansett Pier in owner-occupied houses/condos
- 4no vehicle
- 2031 vehicle
- 3712 vehicles
- 1323 vehicles
- 874 vehicles
- 295+ vehicles

- Cars and other vehicles available in Narragansett Pier in renter-occupied apartments
- 96no vehicle
- 2871 vehicle
- 1892 vehicles
- 543 vehicles
- 04 vehicles
- 105+ vehicles

- Rooms in owner-occupied houses in Narragansett Pier, Rhode Island
- 01 room
- 82 rooms
- 393 rooms
- 674 rooms
- 1455 rooms
- 1416 rooms
- 1507 rooms
- 528 rooms
- 2249+ rooms

- Rooms in renter-occupied apartments in Narragansett Pier, Rhode Island
- 321 room
- 572 rooms
- 1673 rooms
- 2034 rooms
- 355 rooms
- 666 rooms
- 107 rooms
- 588 rooms
- 89+ rooms


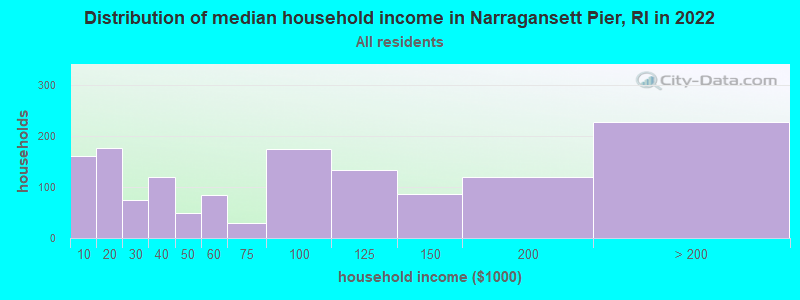
Narragansett Pier, RI household income distribution

- 161Less than $10,000
- 177$10,000 to $19,999
- 75$20,000 to $29,999
- 119$30,000 to $39,999
- 49$40,000 to $49,999
- 84$50,000 to $59,999
- 30$60,000 to $74,999
- 175$75,000 to $99,999
- 133$100,000 to $124,999
- 86$125,000 to $149,999
- 120$150,000 to $199,999
- 228$200,000 or more
Home value of owner - occupied houses in 2022 in Narragansett Pier, RI
-
- 4$25,000 to $29,999
- 9$30,000 to $34,999
- 15$70,000 to $79,999
- 61$100,000 to $124,999
- 7$200,000 to $249,999
- 4$250,000 to $299,999
- 93$300,000 to $399,999
- 65$400,000 to $499,999
- 197$500,000 to $749,999
- 343$750,000 to $999,999
- 51$1,000,000 to $1,499,999
- 89$1,500,000 to $1,999,999
- 47$2,000,000 or more

Rent paid by renters in 2022 in Narragansett Pier, RI
-
- 20$200 to $249
- 39$250 to $299
- 15$300 to $349
- 23$350 to $399
- 9$500 to $549
- 5$550 to $599
- 9$600 to $649
- 29$650 to $699
- 22$800 to $899
- 4$900 to $999
- 23$1,000 to $1,249
- 150$1,250 to $1,499
- 180$1,500 to $1,999
- 74$2,000 to $2,499
- 78No cash rent


Percentage of workers working in this county: 66.1%
Number of people working at home: 237 (17.6% of all workers)
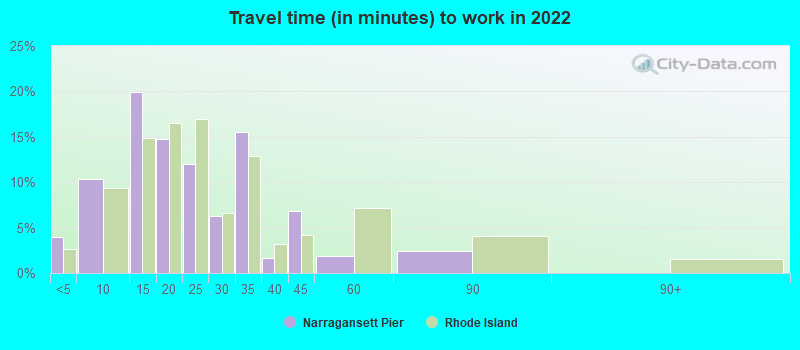
Travel time to work (commute)
- Less than 5 minutes: 92
- 5 to 9 minutes: 191
- 10 to 14 minutes: 166
- 15 to 19 minutes: 130
- 20 to 24 minutes: 195
- 25 to 29 minutes: 8
- 30 to 34 minutes: 69
- 35 to 39 minutes: 25
- 40 to 44 minutes: 59
- 45 to 59 minutes: 131
- 60 to 89 minutes: 11
- 90 or more minutes: 0
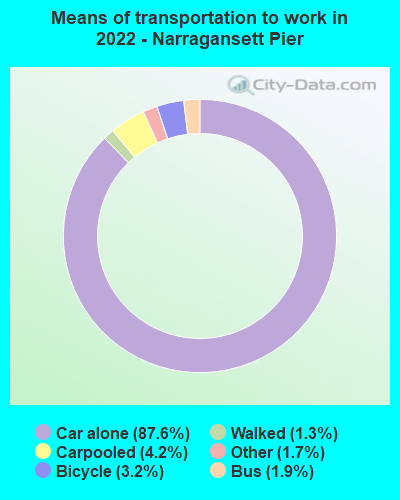
Means of transportation to work:
- Drove a car alone: 2,142 (77.8%)
- Carpooled: 111 (4.0%)
- Bus: 31 (1.1%)
- Taxi: 57 (2.1%)
- Bicycle: 110 (4.0%)
- Walked: 34 (1.2%)
- Worked at home: 237 (8.6%)

- Unemployment by race in 2022
- Unemployment rate for White non-Hispanic residents
- 13.0%Males
- 3.2%Females
- Unemployment rate for two or more race residents
- 47.2%Females

- Year of entry for the foreign-born population in Narragansett Pier, Rhode Island
- 1002010 or later
- 172000 to 2009
- 301990 to 1999
- 431980 to 1989
- 401970 to 1979
- 14Before 1970

First ancestries reported:
- English: 281 (21.8%)
- Irish: 255 (19.8%)
- Italian: 195 (15.1%)
- Egyptian: 134 (10.4%)
- American: 110 (8.5%)
- French Canadian: 30 (2.3%)
- Eastern European: 24 (1.9%)
- German: 23 (1.8%)
- Polish: 21 (1.6%)
- Scandinavian: 16 (1.2%)
- Dutch: 15 (1.2%)
- European: 11 (0.9%)
- Iranian: 10 (0.8%)
- Norwegian: 10 (0.8%)
- Swiss: 10 (0.8%)
- Finnish: 9 (0.7%)
- Scotch-Irish: 8 (0.6%)
- Russian: 7 (0.5%)
- Scottish: 7 (0.5%)
- Brazilian: 5 (0.4%)
- Portuguese: 3 (0.2%)
Most common places of birth for foreign-born residents (%):
| Narragansett Pier: | 37.8% (74) |
| Rhode Island: | 0.1% (104) |
| Narragansett Pier: | 15.8% (31) |
| Rhode Island: | 0.1% (192) |
| Narragansett Pier: | 5.6% (11) |
| Rhode Island: | 0.1% (107) |
| Narragansett Pier: | 5.6% (11) |
| Rhode Island: | 0.5% (756) |
| Narragansett Pier: | 5.1% (10) |
| Rhode Island: | 0.1% (213) |
| Narragansett Pier: | 5.1% (10) |
| Rhode Island: | 0.1% (126) |
| Narragansett Pier: | 4.6% (9) |
| Rhode Island: | 0.0% (20) |
| Narragansett Pier: | 4.6% (9) |
| Rhode Island: | 4.1% (6,520) |
| Narragansett Pier: | 3.6% (7) |
| Rhode Island: | 1.7% (2,625) |
| Narragansett Pier: | 3.6% (7) |
| Rhode Island: | 0.7% (1,165) |
| Narragansett Pier: | 2.6% (5) |
| Rhode Island: | 1.8% (2,826) |
| Narragansett Pier: | 1.5% (3) |
| Rhode Island: | 5.1% (8,042) |
Place of birth for U.S.-born residents:
- This state: 1,542
- Other state: 1,100
- Northeast: 718
- Midwest: 175
- South: 155
- West: 51
89.3% of Narragansett Pier residents lived in the same house 1 years ago.
Out of people who lived in different houses, 31.6% lived in this county.
Out of people who lived in different counties, 41.2% lived in Rhode Island.
| Narragansett Pier: | 89.3% |
| State average: | 89.3% |
Education attainment for males 25 years and older:
- No schooling: 10
- Nursery to 4th grade: 0
- 5th and 6th grade: 0
- 7th and 8th grade: 0
- 9th grade: 10
- 10th grade: 2
- 11th grade: 0
- 12th grade, no diploma: 0
- High school graduate (or equivalency): 160
- Less than 1 year of college: 25
- Some college more than 1 year, no degree: 78
- Associate degree: 109
- Bachelor's degree: 353
- Master's degree: 164
- Professional school degree: 75
- Doctorate degree: 84

Education attainment for females 25 years and older:
- No schooling: 12
- Nursery to 4th grade: 0
- 5th and 6th grade: 0
- 7th and 8th grade: 0
- 9th grade: 11
- 10th grade: 6
- 11th grade: 3
- 12th grade, no diploma: 6
- High school graduate (or equivalency): 202
- Less than 1 year of college: 71
- Some college more than 1 year, no degree: 92
- Associate degree: 44
- Bachelor's degree: 274
- Master's degree: 315
- Professional school degree: 85
- Doctorate degree: 39


Housing units in structures:
- One, detached: 1,285
- One, attached: 190
- Two: 130
- 3 or 4: 99
- 5 to 9: 218
- 10 to 19: 132
- 20 to 49: 104
- 50 or more: 77
- Mobile homes: 22
Housing units lacking complete kitchen facilities in 2022: 1.0%
House/condo owner moved in on average 19 years ago
Renter moved in on average 2 years ago

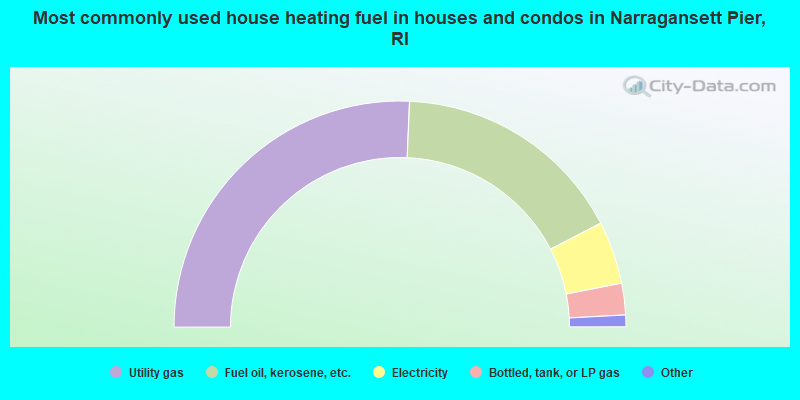
- 51.4%Utility gas
- 33.5%Fuel oil, kerosene, etc.
- 9.0%Electricity
- 4.5%Bottled, tank, or LP gas
- 1.1%Other fuel
- 0.4%Wood
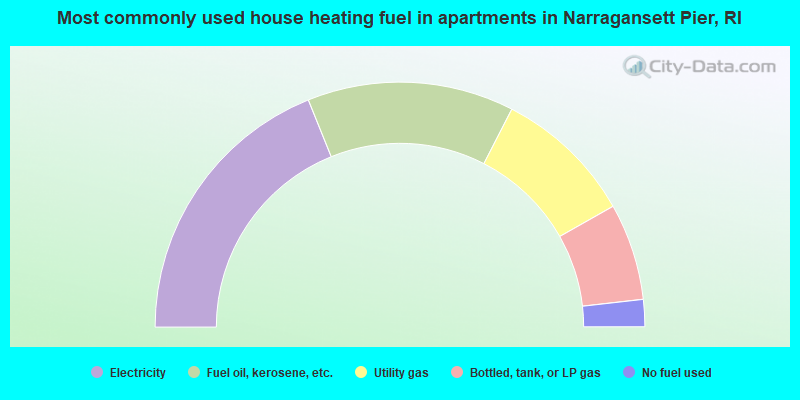
- 37.8%Electricity
- 27.3%Fuel oil, kerosene, etc.
- 18.5%Utility gas
- 12.8%Bottled, tank, or LP gas
- 3.6%No fuel used
Private vs. public school enrollment:
| Here: | 2.3% |
| Rhode Island: | 12.2% |
| Here: | 38.2% |
| Rhode Island: | 11.6% |
| Here: | 0.0% |
| Rhode Island: | 41.1% |


