Housing density: 252 houses/condos per square mile
Median price asked for vacant for-sale houses and condos in 2022 in this county: $820,471.
Median contract rent in 2022: $1,768 (lower quartile is $1,437, upper quartile is over $2,000)
Median rent asked for vacant for-rent units in 2022: $779
Median gross rent in New Fairfield, CT in 2022: over $2,000
Housing units in New Fairfield with a mortgage: 3,154 (364 second mortgage, 534 home equity loan, 6 both second mortgage and home equity loan) Houses without a mortgage: 955
Compare current foreclosures near New Fairfield, CT:
In family households: 768,709 (156,025 male householders, 76,871 female householders)
178,028 spouses, 283,184 children (270,358 natural, 5,825 adopted, 7,001 stepchildren), 13,517 grandchildren, 10,152 brothers or sisters, 9,951 parents, foster children, 13,466 other relatives, 21,162 non-relatives
In nonfamily households: 128,952 (44,659 male householders (33,783 living alone)), 57,990 female householders (49,710 living alone)), 26,303 nonrelatives
In group quarters: 19,168 (9,152 institutionalized population)
167,032 married couples with children.
41,379 single-parent households (6,664 men, 34,715 women).
90.1% of residents of New Fairfield speak English at home.
2.0% of residents speak Spanish at home (85% speak English very well, 7% speak English well, 9% speak English not well).
6.2% of residents speak other Indo-European language at home (80% speak English very well, 13% speak English well, 7% speak English not well).
1.0% of residents speak Asian or Pacific Island language at home (72% speak English very well, 21% speak English well, 7% speak English not well).
0.7% of residents speak other language at home (92% speak English very well, 8% speak English not well).
Foreign born population: 1,677 (11.4%)
(83.8% of them are naturalized citizens)
Year of entry for the foreign-born population in New Fairfield, Connecticut
1151995 to March 2000
501990 to 1994
691985 to 1989
801980 to 1984
961975 to 1979
841970 to 1974
1381965 to 1969
459Before 1965
First ancestries reported:
Irish: 4,457 (23.6%)
Italian: 3,618 (19.2%)
German: 2,962 (15.7%)
Other: 1,650 (8.7%)
English: 1,439 (7.6%)
Polish: 963 (5.1%)
United States: 480 (2.5%)
French: 441 (2.3%)
Russian: 294 (1.6%)
Swedish: 287 (1.5%)
Hungarian: 270 (1.4%)
Norwegian: 244 (1.3%)
Greek: 223 (1.2%)
Portuguese: 179 (0.9%)
French Canadian: 174 (0.9%)
Scottish: 156 (0.8%)
Scotch-Irish: 145 (0.8%)
Dutch: 142 (0.8%)
Welsh: 132 (0.7%)
Czech: 131 (0.7%)
Danish: 122 (0.6%)
Slovak: 119 (0.6%)
Ukrainian: 72 (0.4%)
Arab: 63 (0.3%)
Swiss: 49 (0.3%)
Lithuanian: 39 (0.2%)
West Indian: 30 (0.2%)
Most common places of birth for foreign-born residents (%):
Germany
New Fairfield:
16.2% (177)
Connecticut:
3.1% (11,432)
Italy
New Fairfield:
9.7% (106)
Connecticut:
7.0% (26,023)
Ireland
New Fairfield:
8.7% (95)
Connecticut:
1.2% (4,344)
United Kingdom
New Fairfield:
7.4% (81)
Connecticut:
4.4% (16,395)
Canada
New Fairfield:
5.3% (58)
Connecticut:
5.2% (19,083)
Hungary
New Fairfield:
4.4% (48)
Connecticut:
0.7% (2,646)
Korea
New Fairfield:
4.2% (46)
Connecticut:
1.5% (5,508)
China, excluding Hong Kong and Taiwan
New Fairfield:
3.4% (37)
Connecticut:
2.5% (9,358)
India
New Fairfield:
3.2% (35)
Connecticut:
4.1% (15,108)
Australia
New Fairfield:
2.9% (32)
Connecticut:
0.3% (1,032)
Yugoslavia
New Fairfield:
2.7% (30)
Connecticut:
0.5% (1,894)
Japan
New Fairfield:
2.5% (27)
Connecticut:
0.9% (3,472)
Cuba
New Fairfield:
2.2% (24)
Connecticut:
1.1% (3,919)
Greece
New Fairfield:
1.8% (20)
Connecticut:
1.2% (4,622)
Czechoslovakia (includes Czech Republic and Slovakia)
New Fairfield:
1.8% (20)
Connecticut:
0.5% (1,693)
Austria
New Fairfield:
1.6% (17)
Connecticut:
0.3% (1,224)
Place of birth for U.S.-born residents:
This state: 4,761
Other state: 7,987
Northeast: 6,616
Midwest: 602
South: 355
West: 414
64% of New Fairfield residents lived in the same house 5 years ago. Out of people who lived in different houses, 43% lived in this county. Out of people who lived in different counties, 7% lived in Connecticut.
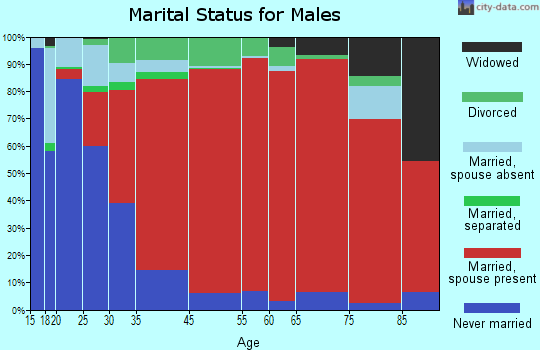
Education attainment for males 25 years and older:
No schooling: 8
Nursery to 4th grade: 0
5th and 6th grade: 6
7th and 8th grade: 41
9th grade: 29
10th grade: 59
11th grade: 33
12th grade, no diploma: 88
High school graduate (or equivalency): 1,150
Less than 1 year of college: 231
Some college more than 1 year, no degree: 625
Associate degree: 223
Bachelor's degree: 1,187
Master's degree: 498
Professional school degree: 167
Doctorate degree: 89
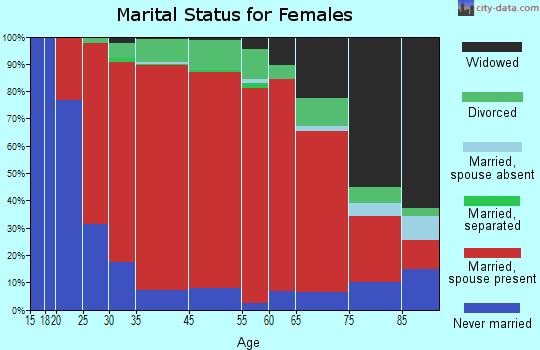
Education attainment for females 25 years and older:
No schooling: 0
Nursery to 4th grade: 0
5th and 6th grade: 4
7th and 8th grade: 43
9th grade: 58
10th grade: 85
11th grade: 26
12th grade, no diploma: 97
High school graduate (or equivalency): 1,306
Less than 1 year of college: 330
Some college more than 1 year, no degree: 517
Associate degree: 439
Bachelor's degree: 1,145
Master's degree: 531
Professional school degree: 91
Doctorate degree: 5
Housing units in structures:
One, detached: 5,027
One, attached: 10
Two: 85
3 or 4: 7
20 to 49: 6
Mobile homes: 13
Median worth of mobile homes: $86,374
Housing units lacking complete plumbing facilities: 0.3%
Housing units lacking complete kitchen facilities: 0.2%