Niagara, NY (New York) Houses and Residents
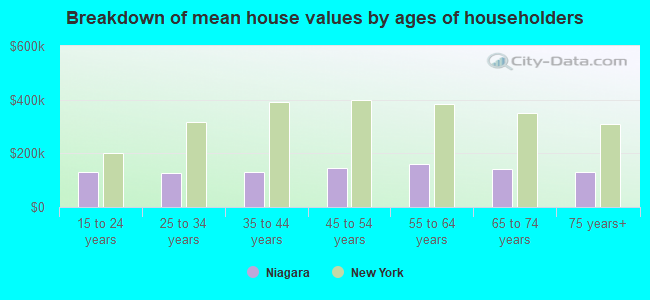
| Niagara: | $178,468 |
| New York: | $400,400 |
Total population: 8,378 (All urban)
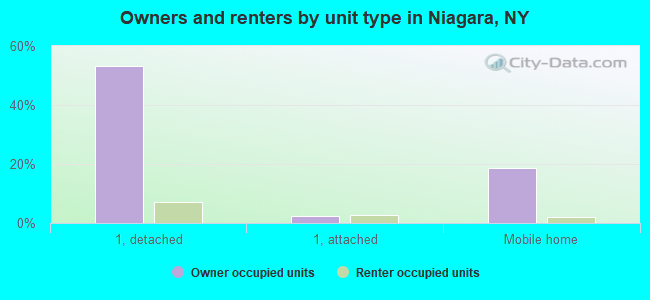
Houses: 3,880 (3,609 occupied: 2,706 owner occupied, 903 renter occupied)
| % of renters here: | 25% |
| State: | 46% |
Housing density: 413 houses/condos per square mile
Median price asked for vacant for-sale houses and condos in 2022 in this county: $67,646.
Median contract rent in 2022: $882 (lower quartile is $648, upper quartile is $1,084)
Median rent asked for vacant for-rent units in 2022: $681
Median gross rent in Niagara, NY in 2022: $1,086
Housing units in Niagara with a mortgage: 1,026 (63 second mortgage, 196 home equity loan, 16 both second mortgage and home equity loan)
Houses without a mortgage: 892
Compare current foreclosures near Niagara, NY:
| Photo | Address | Area | Beds / Baths | Price | Details |
|---|---|---|---|---|---|

|
#1
Juniper St
Lockport, NY 14094
|
1,570 sq. feet
|
2 baths 3 beds |
$49,900
|
show details |

|
#2
Rhode Island Ave
Niagara Falls, NY 14305
|
1,376 sq. feet
|
1 baths 3 beds |
$99,900
|
show details |

|
#3
Tremaine Ave
Buffalo, NY 14217
|
1,144 sq. feet
|
1 baths 3 beds |
$251,900
|
show details |

|
#4
Saint Lawrence Ave
Buffalo, NY 14216
|
1,868 sq. feet
|
2 baths 4 beds |
show details | |

|
#5
100th St
Niagara Falls, NY 14304
|
1,680 sq. feet
|
2 baths 3 beds |
show details | |

|
#6
Fernhill Ave
Buffalo, NY 14215
|
2,180 sq. feet
|
2 baths 4 beds |
show details | |

|
#7
Westwood Dr
Tonawanda, NY 14150
|
1,136 sq. feet
|
1 baths 3 beds |
show details | |

|
#8
South St
Lockport, NY 14094
|
- sq. feet
|
1 baths 3 beds |
show details | |

|
#9
Palmer Ave
Buffalo, NY 14217
|
1,823 sq. feet
|
2 baths 3 beds |
show details | |

|
#10
Alma Ave
Buffalo, NY 14215
|
2,366 sq. feet
|
2 baths 4 beds |
show details |
| Photo | Address | Area | Beds / Baths | Price | Details |
|---|---|---|---|---|---|

|
#11
Northumberland Ave
Buffalo, NY 14215
|
1,080 sq. feet
|
1 baths 3 beds |
show details | |

|
#12
Kenova St
Buffalo, NY 14214
|
1,105 sq. feet
|
1 baths 3 beds |
show details | |

|
#13
Colvin Blvd
Buffalo, NY 14223
|
3,258 sq. feet
|
4 baths 5 beds |
show details | |

|
#14
Two Mile Creek Rd
Tonawanda, NY 14150
|
1,056 sq. feet
|
1 baths 3 beds |
show details | |

|
#15
Cherrywood Ln
Lockport, NY 14094
|
1,896 sq. feet
|
2 baths 3 beds |
show details | |

|
#16
Ward Rd
Sanborn, NY 14132
|
2,156 sq. feet
|
2 baths 4 beds |
show details | |

|
#17
Laird Ave
Buffalo, NY 14207
|
2,208 sq. feet
|
2 baths 6 beds |
show details | |

|
#18
Lisbon Ave
Buffalo, NY 14215
|
1,924 sq. feet
|
2 baths 3 beds |
show details | |

|
#19
Purdy Rd
Lockport, NY 14094
|
1,542 sq. feet
|
1 baths 3 beds |
show details | |

|
#20
Revere Ave
North Tonawanda, NY 14120
|
936 sq. feet
|
1 baths 3 beds |
show details |
| Photo | Address | Area | Beds / Baths | Price | Details |
|---|---|---|---|---|---|

|
#21
Fletcher St
Tonawanda, NY 14150
|
2,606 sq. feet
|
2 baths 5 beds |
show details | |

|
#22
W Delavan Ave
Buffalo, NY 14222
|
2,462 sq. feet
|
3 baths 5 beds |
show details | |

|
#23
W Humboldt Pkwy
Buffalo, NY 14214
|
3,233 sq. feet
|
3 baths 4 beds |
show details | |

|
#24
Jasper Dr
Buffalo, NY 14226
|
1,423 sq. feet
|
1 baths 3 beds |
show details | |

|
#25
N Whitham Dr
Niagara Falls, NY 14304
|
1,580 sq. feet
|
1 baths 3 beds |
show details | |

|
#26
Cornell Ave
Buffalo, NY 14226
|
1,290 sq. feet
|
1 baths 3 beds |
show details | |

|
#27
Bennett Village Ter # 1
Buffalo, NY 14214
|
2,328 sq. feet
|
2 baths 6 beds |
show details | |

|
#28
Highgate Ave
Buffalo, NY 14215
|
776 sq. feet
|
1 baths 2 beds |
show details | |

|
#29
Potomac Ave
Buffalo, NY 14209
|
2,952 sq. feet
|
2 baths 4 beds |
show details | |

|
#30
Dunlop Ave
Buffalo, NY 14215
|
1,220 sq. feet
|
2 baths 4 beds |
show details |
| Photo | Address | Area | Beds / Baths | Price | Details |
|---|---|---|---|---|---|

|
#31
Ontario St
Lockport, NY 14094
|
1,912 sq. feet
|
1 baths 5 beds |
show details | |

|
#32
Winspear Ave
Buffalo, NY 14215
|
1,512 sq. feet
|
1 baths 4 beds |
show details | |

|
#33
Wade Ave
Buffalo, NY 14214
|
1,320 sq. feet
|
1 baths 4 beds |
show details | |

|
#34
Potomac Ave
Buffalo, NY 14209
|
2,338 sq. feet
|
2 baths 5 beds |
show details | |

|
#35
Gaslight Trl
Buffalo, NY 14221
|
1,647 sq. feet
|
1 baths 3 beds |
show details | |

|
#36
Brantford Pl
Buffalo, NY 14222
|
2,196 sq. feet
|
1 baths 5 beds |
show details | |

|
#37
Dewitt St
Buffalo, NY 14213
|
2,645 sq. feet
|
2 baths 6 beds |
show details | |

|
#38
Lisbon Ave
Buffalo, NY 14215
|
2,954 sq. feet
|
2 baths 6 beds |
show details | |

|
#39
Hyledge Dr
Buffalo, NY 14226
|
1,502 sq. feet
|
1 baths 3 beds |
show details | |

|
#40
West Ave
Lockport, NY 14094
|
2,043 sq. feet
|
1 baths 4 beds |
show details |
| Photo | Address | Area | Beds / Baths | Price | Details |
|---|---|---|---|---|---|

|
#41
Leroy Ave
Buffalo, NY 14214
|
2,358 sq. feet
|
2 baths 6 beds |
show details | |

|
#42
Webb St
Lockport, NY 14094
|
2,156 sq. feet
|
2 baths 3 beds |
show details | |

|
#43
Dewey Ave
Buffalo, NY 14214
|
1,744 sq. feet
|
2 baths 4 beds |
show details | |

|
#44
Beverly Rd
Buffalo, NY 14208
|
2,574 sq. feet
|
2 baths 6 beds |
show details | |

|
#45
Eggert Rd
Buffalo, NY 14215
|
1,076 sq. feet
|
1 baths 2 beds |
show details | |

|
#46
Hewitt Ave
Buffalo, NY 14215
|
1,065 sq. feet
|
1 baths 3 beds |
show details | |

|
#47
Eggert Rd
Buffalo, NY 14215
|
1,606 sq. feet
|
1 baths 3 beds |
show details | |

|
#48
Kensington Ave
Buffalo, NY 14215
|
2,590 sq. feet
|
2 baths 6 beds |
show details | |

|
#49
Lexington Ave
Buffalo, NY 14222
|
2,188 sq. feet
|
2 baths 5 beds |
show details | |

|
Check over 1 million property listings on Foreclosure.com!
|
browse all offers | |||

Household type by relationship:
Households: 212,150- In family households: 171,950 (38,590 male householders, 18,223 female householders)
40,806 spouses, 61,292 children (57,461 natural, 1,293 adopted, 2,538 stepchildren), 3,542 grandchildren, 1,298 brothers or sisters, 1,444 parents, foster children, 1,306 other relatives, 4,654 non-relatives
- In nonfamily households: 40,200 (15,874 male householders (12,870 living alone)), 17,869 female householders (15,536 living alone)), 6,457 nonrelatives
- In group quarters: 4,319 (2,091 institutionalized population)
36,121 married couples with children.
13,947 single-parent households (2,810 men, 11,137 women).
93.0% of residents of Niagara speak English at home.
1.2% of residents speak Spanish at home (75% speak English very well, 6% speak English well, 11% speak English not well, 9% don't speak English at all).
5.3% of residents speak other Indo-European language at home (73% speak English very well, 18% speak English well, 9% speak English not well).
0.1% of residents speak Asian or Pacific Island language at home (100% speak English very well).
0.3% of residents speak other language at home (100% speak English very well).
Foreign born population: 421 (4.9%)
(58.7% of them are naturalized citizens)
| Here: | 5.4 |
| State: | 6.3 |
| Here: | 4.5 |
| State: | 3.8 |
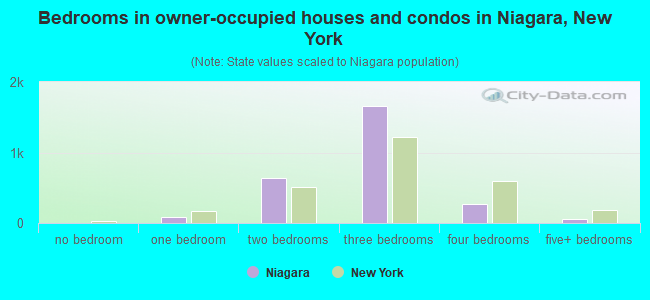
- Bedrooms in owner-occupied houses and condos in Niagara, New York
- 6no bedroom
- 841 bedroom
- 6332 bedrooms
- 1,6623 bedrooms
- 2664 bedrooms
- 555+ bedrooms
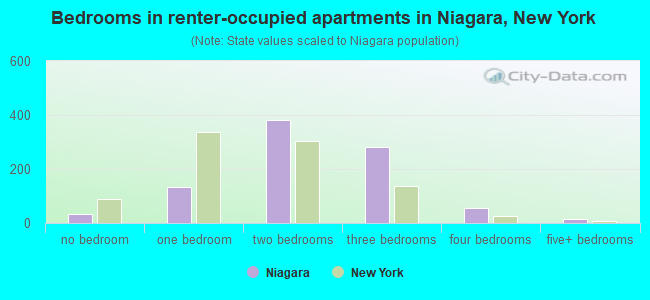
- Bedrooms in renter-occupied apartments in Niagara, New York
- 34no bedroom
- 1341 bedroom
- 3822 bedrooms
- 2813 bedrooms
- 564 bedrooms
- 165+ bedrooms
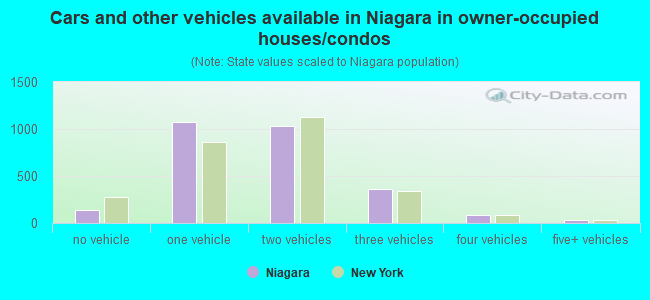
- Cars and other vehicles available in Niagara in owner-occupied houses/condos
- 134no vehicle
- 1,0721 vehicle
- 1,0302 vehicles
- 3593 vehicles
- 824 vehicles
- 295+ vehicles
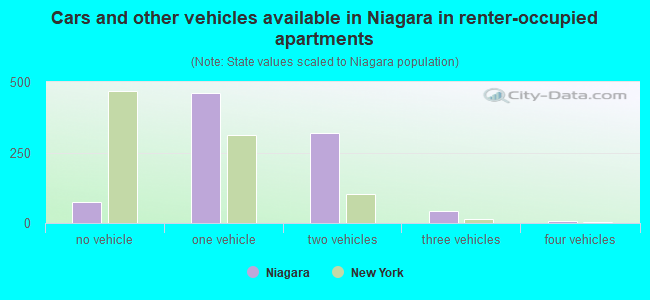
- Cars and other vehicles available in Niagara in renter-occupied apartments
- 75no vehicle
- 4601 vehicle
- 3202 vehicles
- 423 vehicles
- 64 vehicles
- 05+ vehicles
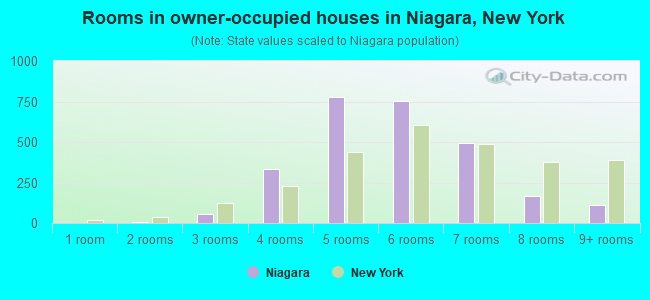
- Rooms in owner-occupied houses in Niagara, New York
- 01 room
- 92 rooms
- 563 rooms
- 3364 rooms
- 7785 rooms
- 7566 rooms
- 4947 rooms
- 1688 rooms
- 1099+ rooms
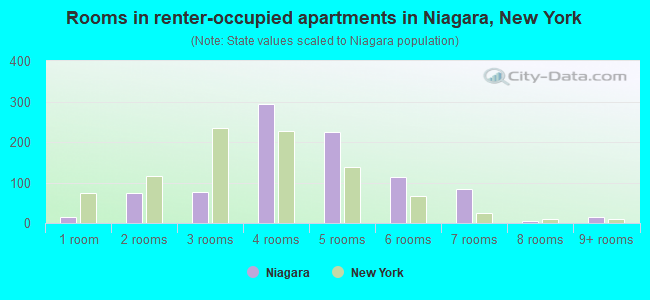
- Rooms in renter-occupied apartments in Niagara, New York
- 151 room
- 742 rooms
- 763 rooms
- 2944 rooms
- 2255 rooms
- 1146 rooms
- 837 rooms
- 68 rooms
- 169+ rooms
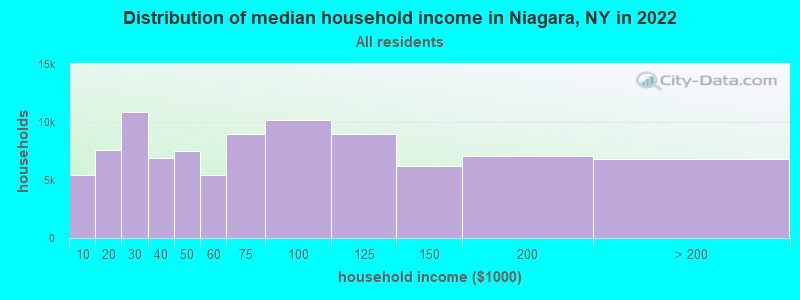
Niagara, NY household income distribution

- 5,467Less than $10,000
- 7,625$10,000 to $19,999
- 10,854$20,000 to $29,999
- 6,872$30,000 to $39,999
- 7,470$40,000 to $49,999
- 5,423$50,000 to $59,999
- 8,944$60,000 to $74,999
- 10,205$75,000 to $99,999
- 8,981$100,000 to $124,999
- 6,216$125,000 to $149,999
- 7,101$150,000 to $199,999
- 6,850$200,000 or more
Percentage of workers working in this county: 69.2%
Number of people working at home: 389 (9.5% of all workers)
Travel time to work (commute)
- Less than 5 minutes: 150
- 5 to 9 minutes: 701
- 10 to 14 minutes: 959
- 15 to 19 minutes: 652
- 20 to 24 minutes: 535
- 25 to 29 minutes: 281
- 30 to 34 minutes: 478
- 35 to 39 minutes: 66
- 40 to 44 minutes: 47
- 45 to 59 minutes: 43
- 60 to 89 minutes: 8
- 90 or more minutes: 34
Means of transportation to work:
- Drove a car alone: 3,422 (85.9%)
- Carpooled: 414 (10.4%)
- Bus or trolley bus: 11 (0.3%)
- Walked: 82 (2.1%)
- Other means: 25 (0.6%)
- Worked at home: 31 (0.8%)
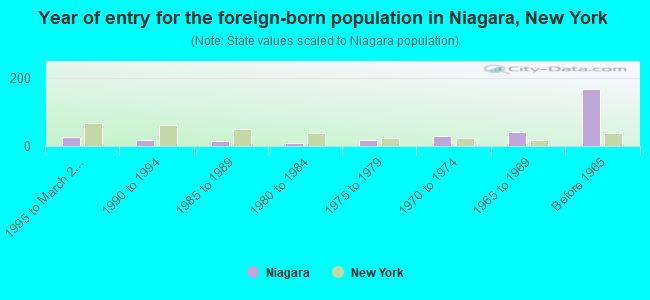
- Year of entry for the foreign-born population in Niagara, New York
- 261995 to March 2000
- 171990 to 1994
- 141985 to 1989
- 91980 to 1984
- 181975 to 1979
- 291970 to 1974
- 401965 to 1969
- 166Before 1965
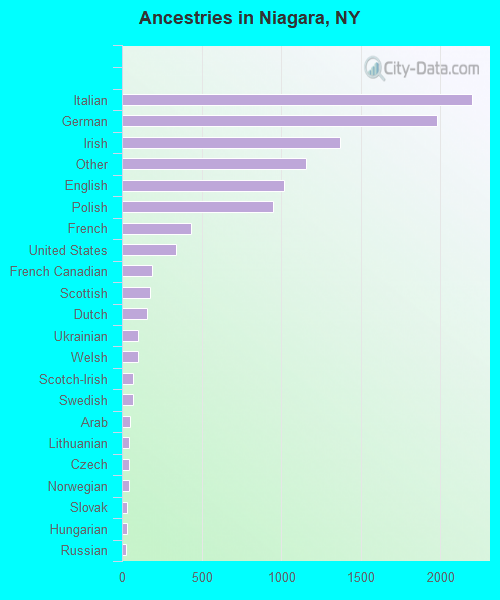
First ancestries reported:
- Italian: 2,197 (20.7%)
- German: 1,978 (18.6%)
- Irish: 1,368 (12.9%)
- Other: 1,156 (10.9%)
- English: 1,020 (9.6%)
- Polish: 947 (8.9%)
- French: 433 (4.1%)
- United States: 339 (3.2%)
- French Canadian: 189 (1.8%)
- Scottish: 176 (1.7%)
- Dutch: 156 (1.5%)
- Ukrainian: 101 (1.0%)
- Welsh: 99 (0.9%)
- Scotch-Irish: 72 (0.7%)
- Swedish: 72 (0.7%)
- Arab: 48 (0.5%)
- Lithuanian: 46 (0.4%)
- Czech: 41 (0.4%)
- Norwegian: 41 (0.4%)
- Slovak: 34 (0.3%)
- Hungarian: 29 (0.3%)
- Russian: 25 (0.2%)
- Subsaharan African: 13 (0.1%)
- Portuguese: 11 (0.1%)
- Danish: 10 (0.09%)
- Swiss: 8 (0.08%)
- West Indian: 8 (0.08%)
Most common places of birth for foreign-born residents (%):
| Niagara: | 40.1% (128) |
| New York: | 1.4% (54,876) |
| Niagara: | 26.6% (85) |
| New York: | 3.8% (147,729) |
| Niagara: | 8.5% (27) |
| New York: | 1.8% (69,327) |
| Niagara: | 6.0% (19) |
| New York: | 2.4% (94,595) |
| Niagara: | 4.1% (13) |
| New York: | 1.4% (53,825) |
| Niagara: | 3.8% (12) |
| New York: | 1.6% (62,237) |
| Niagara: | 3.8% (12) |
| New York: | 2.4% (93,187) |
| Niagara: | 2.8% (9) |
| New York: | 0.2% (8,512) |
| Niagara: | 2.5% (8) |
| New York: | 0.7% (26,202) |
| Niagara: | 1.9% (6) |
| New York: | 0.3% (10,672) |
Place of birth for U.S.-born residents:
- This state: 7,120
- Other state: 1,392
- Northeast: 738
- Midwest: 173
- South: 432
- West: 49
67% of Niagara residents lived in the same house 5 years ago.
Out of people who lived in different houses, 78% lived in this county.
Out of people who lived in different counties, 55% lived in New York.
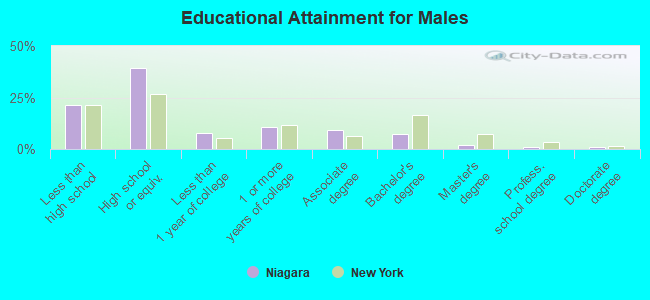
Education attainment for males 25 years and older:
- No schooling: 23
- Nursery to 4th grade: 11
- 5th and 6th grade: 19
- 7th and 8th grade: 91
- 9th grade: 89
- 10th grade: 179
- 11th grade: 70
- 12th grade, no diploma: 131
- High school graduate (or equivalency): 1,135
- Less than 1 year of college: 225
- Some college more than 1 year, no degree: 307
- Associate degree: 272
- Bachelor's degree: 216
- Master's degree: 62
- Professional school degree: 25
- Doctorate degree: 21
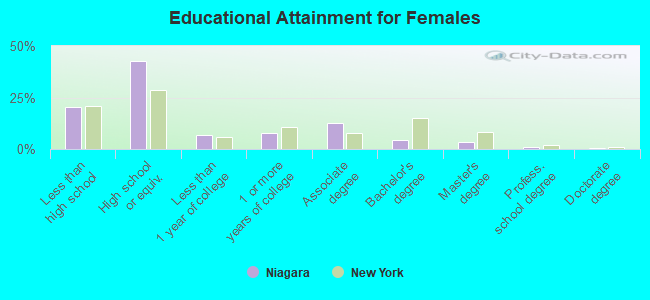
Education attainment for females 25 years and older:
- No schooling: 25
- Nursery to 4th grade: 0
- 5th and 6th grade: 32
- 7th and 8th grade: 90
- 9th grade: 125
- 10th grade: 131
- 11th grade: 139
- 12th grade, no diploma: 131
- High school graduate (or equivalency): 1,400
- Less than 1 year of college: 225
- Some college more than 1 year, no degree: 252
- Associate degree: 411
- Bachelor's degree: 147
- Master's degree: 118
- Professional school degree: 28
- Doctorate degree: 16


Housing units in structures:
- One, detached: 2,223
- One, attached: 186
- Two: 198
- 3 or 4: 58
- 5 to 9: 143
- 10 to 19: 97
- 20 to 49: 95
- 50 or more: 10
- Mobile homes: 870
Median worth of mobile homes: $26,007
Housing units lacking complete kitchen facilities: 1.7%
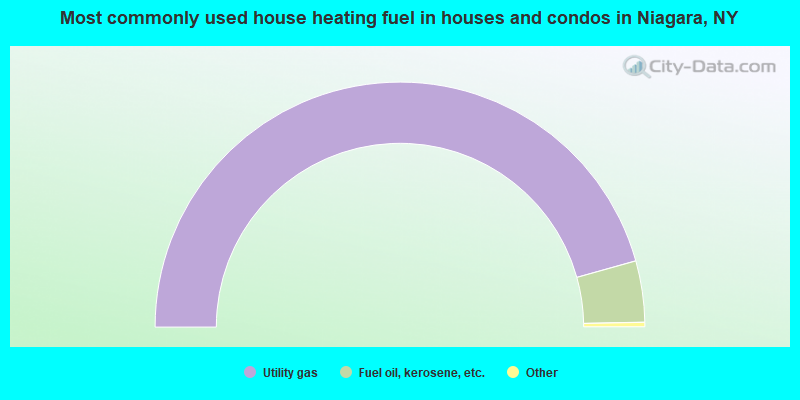
- 91.4%Utility gas
- 8.1%Fuel oil, kerosene, etc.
- 0.3%Electricity
- 0.2%Wood
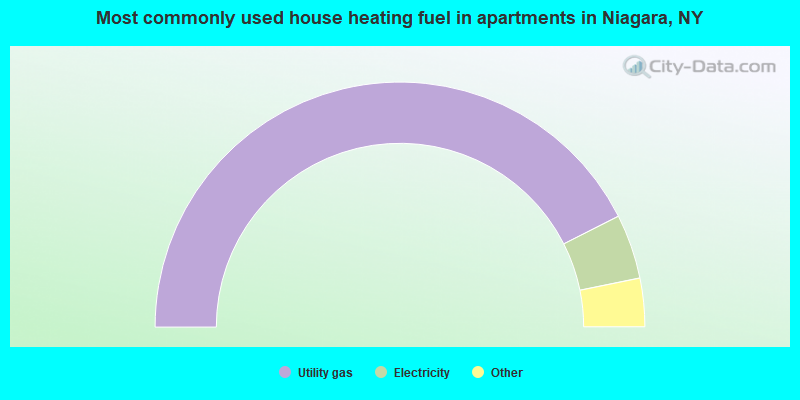
- 85.0%Utility gas
- 8.5%Electricity
- 3.3%Fuel oil, kerosene, etc.
- 2.0%Bottled, tank, or LP gas
- 1.1%No fuel used
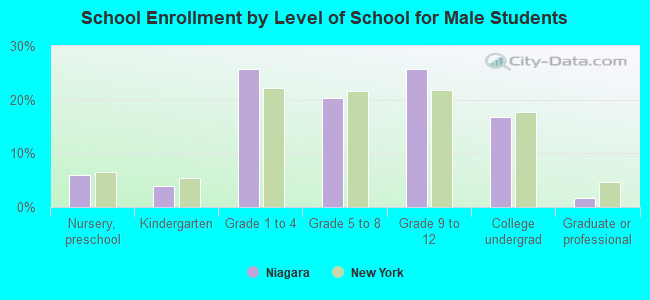
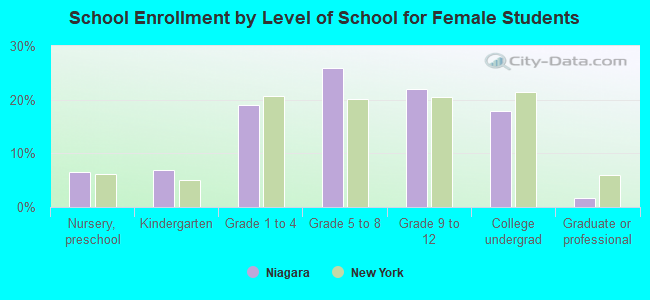
Private vs. public school enrollment:
| Here: | 11.4% |
| New York: | 14.0% |
| Here: | 1.8% |
| New York: | 13.2% |
| Here: | 24.0% |
| New York: | 38.2% |