Norridge, IL (Illinois) Houses and Residents
| Norridge: | $351,172 |
| Illinois: | $251,600 |
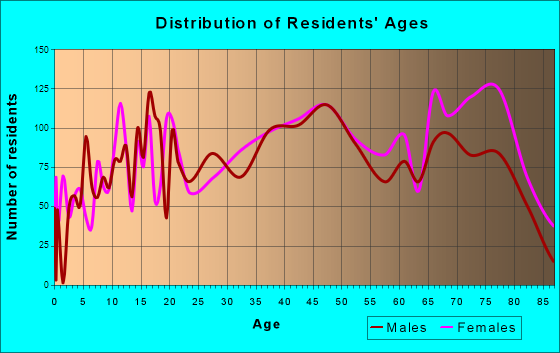
Total population: 14,674 (All urban)
Houses: 6,219 (5,889 occupied: 4,971 owner occupied, 1,019 renter occupied)
| % of renters here: | 17% |
| State: | 33% |
Housing density: 3,418 houses/condos per square mile
Median price asked for vacant for-sale houses and condos in 2022 in this county: $235,866.
Median contract rent in 2022: $1,370 (lower quartile is $973, upper quartile is $1,760)
Median rent asked for vacant for-rent units in 2022: $6,325
Median gross rent in Norridge, IL in 2022: $1,479
Housing units in Norridge with a mortgage: 2,265 (161 second mortgage, 0 home equity loan, 90 both second mortgage and home equity loan)
Houses without a mortgage: 8
Median household income for houses/condos with a mortgage: $108,406
Median household income for apartments without a mortgage: $69,356
Median monthly housing costs: $1,227
Compare current foreclosures near Norridge, IL:
| Photo | Address | Area | Beds / Baths | Price | Details |
|---|---|---|---|---|---|

|
#1
Christiana Ave # 1
Skokie, IL 60076
|
1,400 sq. feet
|
1 baths 3 beds |
$319,000
|
show details |

|
#2
Webster Ln
Des Plaines, IL 60018
|
1,608 sq. feet
|
3 baths 3 beds |
$530,000
|
show details |

|
#3
Raymond Ave
Brookfield, IL 60513
|
1,020 sq. feet
|
1 baths 2 beds |
$239,200
|
show details |

|
#4
Main St
Skokie, IL 60076
|
1,428 sq. feet
|
1 baths 3 beds |
$455,000
|
show details |

|
#5
W Barry Ave Apt 3bc
Chicago, IL 60657
|
2,500 sq. feet
|
3 baths 4 beds |
$699,000
|
show details |

|
#6
S Main St
Hometown, IL 60456
|
744 sq. feet
|
1 baths 2 beds |
$175,000
|
show details |

|
#7
S Honore St
Chicago, IL 60636
|
1,232 sq. feet
|
2 baths 4 beds |
$79,000
|
show details |

|
#8
S Ridgeland Ave
Oak Park, IL 60302
|
2,400 sq. feet
|
3 baths 4 beds |
$625,000
|
show details |

|
#9
S Ada St
Chicago, IL 60636
|
2,619 sq. feet
|
2 baths 6 beds |
$244,400
|
show details |

|
#10
E 46th St
Chicago, IL 60653
|
2,126 sq. feet
|
2 baths 2 beds |
$290,000
|
show details |
| Photo | Address | Area | Beds / Baths | Price | Details |
|---|---|---|---|---|---|

|
#11
N Austin Ave
Chicago, IL 60634
|
2,500 sq. feet
|
3 baths 4 beds |
$375,000
|
show details |

|
#12
S 87th Ave
Justice, IL 60458
|
2,725 sq. feet
|
3 baths 4 beds |
$585,000
|
show details |

|
#13
S Indiana Ave Apt 2s
Chicago, IL 60615
|
1,100 sq. feet
|
1 baths 2 beds |
$189,000
|
show details |

|
#14
W Polk St
Chicago, IL 60644
|
2,850 sq. feet
|
2 baths 6 beds |
$130,000
|
show details |

|
#15
W 63rd St
Chicago, IL 60638
|
1,250 sq. feet
|
2 baths 4 beds |
$385,000
|
show details |

|
#16
S Kensington Ave
La Grange, IL 60525
|
4,128 sq. feet
|
3 baths 4 beds |
$814,400
|
show details |

|
#17
N Francisco Ave
Chicago, IL 60659
|
1,100 sq. feet
|
1 baths 2 beds |
$164,900
|
show details |

|
#18
N Sheridan Rd Apt 6e
Chicago, IL 60660
|
1,200 sq. feet
|
2 baths 2 beds |
$255,000
|
show details |

|
#19
W Van Buren St
Chicago, IL 60644
|
2,839 sq. feet
|
3 baths 8 beds |
$87,500
|
show details |

|
#20
S Lyman Ave
Des Plaines, IL 60016
|
2,233 sq. feet
|
2 baths 4 beds |
$349,900
|
show details |
| Photo | Address | Area | Beds / Baths | Price | Details |
|---|---|---|---|---|---|

|
#21
Carriage Way Dr
Arlington Heights, IL 60004
|
- sq. feet
|
2 baths 2 beds |
$192,400
|
show details |

|
#22
N 4th Ave
Des Plaines, IL 60016
|
1,381 sq. feet
|
1 baths 3 beds |
$335,000
|
show details |

|
#23
Briar Hill Dr
Schaumburg, IL 60194
|
1,600 sq. feet
|
2 baths 4 beds |
$410,400
|
show details |

|
#24
E Crest Ave
Addison, IL 60101
|
2,023 sq. feet
|
1 baths 5 beds |
$329,000
|
show details |

|
#25
N 74th Ave
Elmwood Park, IL 60707
|
1,300 sq. feet
|
1 baths 3 beds |
$235,000
|
show details |

|
#26
W Garfield Blvd
Chicago, IL 60636
|
2,820 sq. feet
|
2 baths 5 beds |
$132,500
|
show details |

|
#27
- 24 S Kimbark Unit 105
Chicago, IL 60637
|
600 sq. feet
|
1 baths 1 beds |
$145,000
|
show details |

|
#28
S 13th Ave
Maywood, IL 60153
|
1,176 sq. feet
|
1 baths 3 beds |
$279,900
|
show details |

|
#29
S Carpenter St
Chicago, IL 60609
|
2,354 sq. feet
|
2 baths 5 beds |
$85,000
|
show details |

|
#30
W 21st St # 1
Chicago, IL 60608
|
1,250 sq. feet
|
1 baths 3 beds |
$219,900
|
show details |
| Photo | Address | Area | Beds / Baths | Price | Details |
|---|---|---|---|---|---|

|
#31
W 58th St
Chicago, IL 60629
|
- sq. feet
|
1 baths 3 beds |
$150,800
|
show details |

|
#32
S Winchester Ave
Chicago, IL 60636
|
- sq. feet
|
2 baths 4 beds |
$72,800
|
show details |

|
#33
Avenida Serra Test
Des Plaines, IL 60018
|
- sq. feet
|
2 baths 3 beds |
$100,000
|
show details |

|
#34
S 17th Ave
Maywood, IL 60153
|
800 sq. feet
|
1 baths 2 beds |
$64,900
|
show details |

|
#35
W Quincy St
Chicago, IL 60644
|
960 sq. feet
|
1 baths - beds |
$19,000
|
show details |

|
#36
Washington Blvd Apt 1
Oak Park, IL 60302
|
- sq. feet
|
1 baths 2 beds |
$149,900
|
show details |

|
#37
Niles Center Rd Apt 502
Skokie, IL 60077
|
- sq. feet
|
2 baths 2 beds |
$214,900
|
show details |

|
#38
S Rockwell St
Chicago, IL 60632
|
3,554 sq. feet
|
3 baths 6 beds |
show details | |

|
#39
W Arthington St
Chicago, IL 60612
|
- sq. feet
|
- baths - beds |
$20,000
|
show details |

|
#40
Kirkland Lane
Villa Park, IL 60181
|
1,100 sq. feet
|
2 baths 3 beds |
show details |
| Photo | Address | Area | Beds / Baths | Price | Details |
|---|---|---|---|---|---|

|
#41
W Grenshaw St
Chicago, IL 60624
|
2,148 sq. feet
|
2 baths 6 beds |
show details | |

|
#42
Dobson St
Evanston, IL 60202
|
2,212 sq. feet
|
3 baths 6 beds |
show details | |

|
#43
W Flournoy St
Chicago, IL 60624
|
1,288 sq. feet
|
2 baths - beds |
$19,900
|
show details |

|
#44
W Cermak Rd
Chicago, IL 60623
|
2,971 sq. feet
|
3 baths 7 beds |
show details | |

|
#45
W 18th St
Chicago, IL 60608
|
2,571 sq. feet
|
4 baths 6 beds |
show details | |

|
#46
W Corcoran Pl Apt 1
Chicago, IL 60644
|
- sq. feet
|
2 baths 3 beds |
$203,900
|
show details |

|
#47
Hesterman Dr
Glendale Heights, IL 60139
|
1,263 sq. feet
|
2 baths 2 beds |
show details | |

|
#48
Virginia Lane
Elmhurst, IL 60126
|
1,328 sq. feet
|
2 baths 3 beds |
show details | |

|
#49
34th St
Berwyn, IL 60402
|
1,480 sq. feet
|
2 baths 4 beds |
show details | |

|
Check over 1 million property listings on Foreclosure.com!
|
browse all offers | |||

Latest news about housing in Norridge, IL collected exclusively by city-data.com from local newspapers, TV, and radio stations

 | Gay Couple Moving to Chicago. Advise Please. (19 replies) |
| Buying Multiplex for Investment using home equity loan (33 replies) |
| Haaalp! Chicago Northwest Suburbs (21 replies) |
| I am ready to move to the BURBS(probably North but open to ideas) (26 replies) |
| Looking for SFH in walkable suburb with good schools (10 replies) |
| Lombard/Glen Ellyn vs Norridge/Harwood Heights (52 replies) |
Median year apartment built: 1968
Household type by relationship:
Households: 14,951- Male householders: 3,037 (706 living alone), Female householders: 2,696 (848 living alone)
2,907 spouses (2,898 opposite-sex spouses), 266 unmarried partners, (260 opposite-sex unmarried partners), 4,130 children (4,097 natural, 0 adopted, 32 stepchildren), 218 grandchildren, 246 brothers or sisters, 349 parents, 0 foster children, 352 other relatives, 310 non-relatives
- In group quarters: 434
Size of family households: 1,762 2-persons, 959 3-persons, 787 4-persons, 258 5-persons, 119 6-persons, 77 7-or-more-persons.
Size of nonfamily households: 1,671 1-person, 258 2-persons, 51 3-persons, 18 4-persons.
1,541 married couples with children.
684 single-parent households (293 men, 391 women).
47.4% of residents of Norridge speak English at home.
7.9% of residents speak Spanish at home (61% speak English very well, 30% speak English well, 9% speak English not well).
38.8% of residents speak other Indo-European language at home (45% speak English very well, 32% speak English well, 19% speak English not well, 4% don't speak English at all).
4.9% of residents speak Asian or Pacific Island language at home (57% speak English very well, 31% speak English well, 11% speak English not well).
2.8% of residents speak other language at home (94% speak English very well, 6% speak English well, 1% speak English not well).
Foreign born population: 5,774 (38.6%)
(68.5% of them are naturalized citizens)
| Here: | 5.6 |
| State: | 6.4 |
| Here: | 4.6 |
| State: | 4.1 |

- Bedrooms in owner-occupied houses and condos in Norridge, Illinois
- 21no bedroom
- 1841 bedroom
- 1,2422 bedrooms
- 2,7193 bedrooms
- 6614 bedrooms
- 1445+ bedrooms

- Bedrooms in renter-occupied apartments in Norridge, Illinois
- 103no bedroom
- 1561 bedroom
- 2912 bedrooms
- 3233 bedrooms
- 1454 bedrooms
- 15+ bedrooms

- Cars and other vehicles available in Norridge in owner-occupied houses/condos
- 422no vehicle
- 1,3671 vehicle
- 2,1312 vehicles
- 7693 vehicles
- 2044 vehicles
- 795+ vehicles

- Cars and other vehicles available in Norridge in renter-occupied apartments
- 81no vehicle
- 4971 vehicle
- 3762 vehicles
- 563 vehicles
- 94 vehicles
- 05+ vehicles

- Rooms in owner-occupied houses in Norridge, Illinois
- 101 room
- 272 rooms
- 1883 rooms
- 5664 rooms
- 1,5365 rooms
- 1,2566 rooms
- 6547 rooms
- 2638 rooms
- 4729+ rooms

- Rooms in renter-occupied apartments in Norridge, Illinois
- 1031 room
- 442 rooms
- 873 rooms
- 2254 rooms
- 2545 rooms
- 2316 rooms
- 287 rooms
- 388 rooms
- 109+ rooms


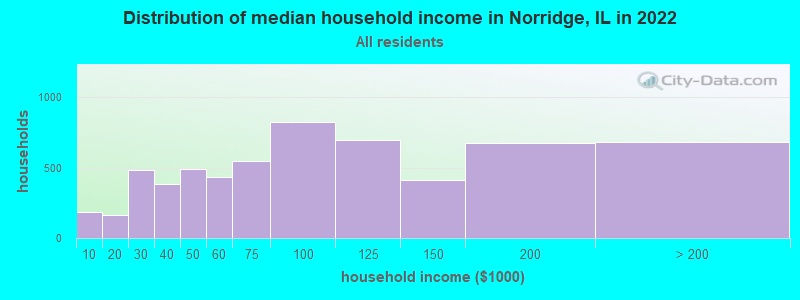
Norridge, IL household income distribution

- 185Less than $10,000
- 162$10,000 to $19,999
- 482$20,000 to $29,999
- 383$30,000 to $39,999
- 493$40,000 to $49,999
- 434$50,000 to $59,999
- 546$60,000 to $74,999
- 824$75,000 to $99,999
- 699$100,000 to $124,999
- 410$125,000 to $149,999
- 676$150,000 to $199,999
- 682$200,000 or more
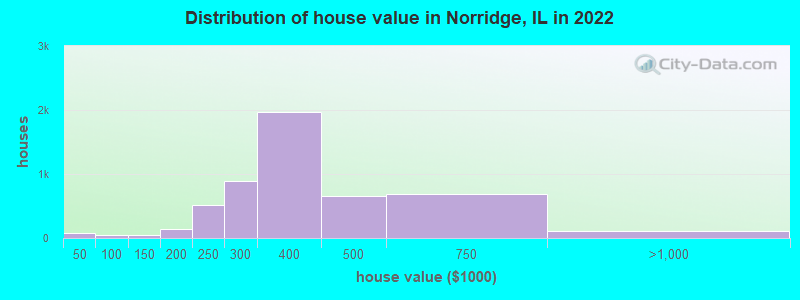
Home value of owner - occupied houses in 2022 in Norridge, IL
-
- 26$10,000 to $14,999
- 18$20,000 to $24,999
- 11$25,000 to $29,999
- 11$30,000 to $34,999
- 14$40,000 to $49,999
- 10$50,000 to $59,999
- 27$90,000 to $99,999
- 35$100,000 to $124,999
- 18$125,000 to $149,999
- 19$150,000 to $174,999
- 112$175,000 to $199,999
- 521$200,000 to $249,999
- 886$250,000 to $299,999
- 1,975$300,000 to $399,999
- 660$400,000 to $499,999
- 680$500,000 to $749,999
- 81$750,000 to $999,999
- 28$1,000,000 to $1,499,999
Rent paid by renters in 2022 in Norridge, IL
-
- 5$450 to $499
- 15$500 to $549
- 60$700 to $749
- 127$800 to $899
- 52$900 to $999
- 140$1,000 to $1,249
- 131$1,250 to $1,499
- 317$1,500 to $1,999
- 43$2,000 to $2,499
- 35$2,500 to $2,999
- 116No cash rent

Percentage of workers working in this county: 90.6%
Number of people working at home: 733 (10.2% of all workers)
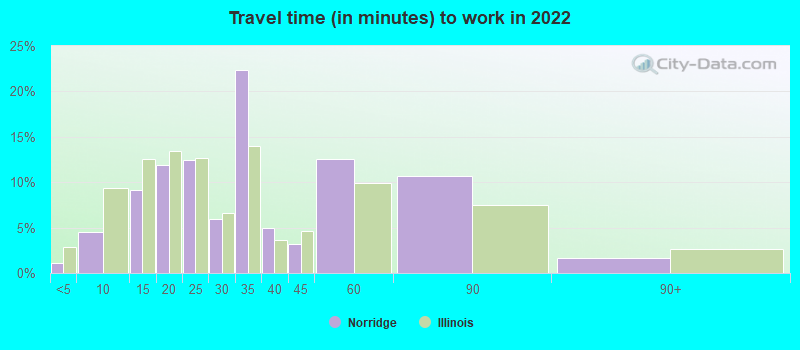
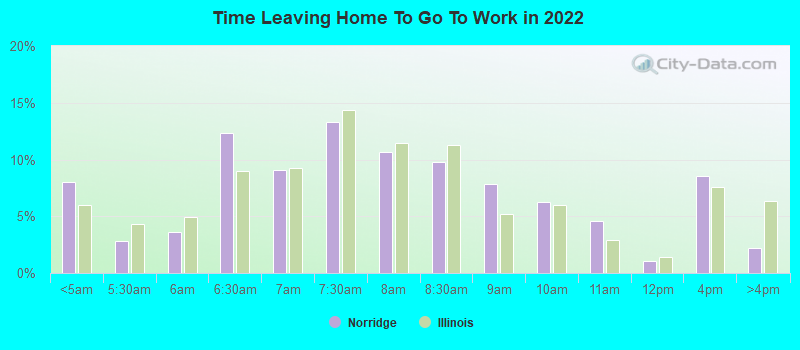
Travel time to work (commute)
- Less than 5 minutes: 111
- 5 to 9 minutes: 277
- 10 to 14 minutes: 531
- 15 to 19 minutes: 738
- 20 to 24 minutes: 708
- 25 to 29 minutes: 330
- 30 to 34 minutes: 1,225
- 35 to 39 minutes: 176
- 40 to 44 minutes: 374
- 45 to 59 minutes: 980
- 60 to 89 minutes: 539
- 90 or more minutes: 242
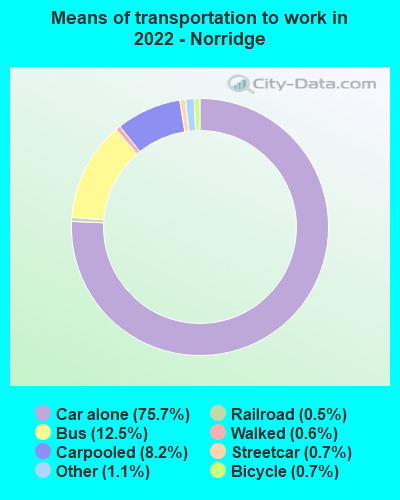
Means of transportation to work:
- Drove a car alone: 2,987 (64.8%)
- Carpooled: 345 (7.5%)
- Bus: 457 (9.9%)
- Subway or elevated rail: 19 (0.4%)
- Light rail, streetcar or trolley: 16 (0.3%)
- Taxi: 42 (0.9%)
- Bicycle: 28 (0.6%)
- Walked: 25 (0.5%)
- Worked at home: 733 (15.9%)
- Unemployment by race in 2022
- Unemployment rate for White non-Hispanic residents
- 4.7%Males
- 4.8%Females
- Unemployment rate for Black residents
- 33.7%Females
- Unemployment rate for other race residents
- 23.5%Males
- Unemployment rate for two or more race residents
- 12.6%Males
- Unemployment rate for Hispanic or Latino residents
- 17.3%Males

- Year of entry for the foreign-born population in Norridge, Illinois
- 1,1812010 or later
- 9662000 to 2009
- 1,6191990 to 1999
- 8351980 to 1989
- 8691970 to 1979
- 1,680Before 1970

First ancestries reported:
- Polish: 3,102 (34.0%)
- Italian: 1,085 (11.9%)
- American: 749 (8.2%)
- Irish: 509 (5.6%)
- German: 483 (5.3%)
- Syrian: 343 (3.8%)
- Yugoslavian: 251 (2.8%)
- Serbian: 225 (2.5%)
- Greek: 220 (2.4%)
- Ukrainian: 210 (2.3%)
- Palestinian: 107 (1.2%)
- Norwegian: 106 (1.2%)
- Romanian: 91 (1.0%)
- Czech: 55 (0.6%)
- Arab: 46 (0.5%)
- English: 36 (0.4%)
- Scandinavian: 33 (0.4%)
- Scottish: 32 (0.4%)
- Slovak: 26 (0.3%)
- French: 21 (0.2%)
- Albanian: 20 (0.2%)
- Macedonian: 20 (0.2%)
- Lithuanian: 18 (0.2%)
- Dutch: 14 (0.2%)
- European: 14 (0.2%)
- Assyrian: 12 (0.1%)
- Croatian: 11 (0.1%)
- Austrian: 7 (0.08%)
Most common places of birth for foreign-born residents (%):
| Norridge: | 39.9% (2,305) |
| Illinois: | 6.9% (124,474) |
| Norridge: | 12.3% (711) |
| Illinois: | 0.9% (15,679) |
| Norridge: | 7.7% (446) |
| Illinois: | 5.2% (93,003) |
| Norridge: | 7.3% (421) |
| Illinois: | 34.7% (626,958) |
| Norridge: | 4.7% (270) |
| Illinois: | 1.6% (29,316) |
| Norridge: | 3.7% (212) |
| Illinois: | 0.4% (6,781) |
| Norridge: | 3.1% (178) |
| Illinois: | 0.6% (10,776) |
| Norridge: | 2.6% (152) |
| Illinois: | 0.6% (10,720) |
| Norridge: | 2.4% (136) |
| Illinois: | 0.4% (7,117) |
| Norridge: | 2.2% (127) |
| Illinois: | 0.5% (8,574) |
| Norridge: | 2.1% (124) |
| Illinois: | 9.2% (166,409) |
Place of birth for U.S.-born residents:
- This state: 8,316
- Other state: 659
- Northeast: 145
- Midwest: 355
- South: 146
- West: 23
94.6% of Norridge residents lived in the same house 1 years ago.
Out of people who lived in different houses, 36.9% lived in this county.
Out of people who lived in different counties, 92.7% lived in Illinois.
| Norridge: | 94.6% |
| State average: | 88.3% |
Education attainment for males 25 years and older:
- No schooling: 105
- Nursery to 4th grade: 0
- 5th and 6th grade: 98
- 7th and 8th grade: 199
- 9th grade: 22
- 10th grade: 43
- 11th grade: 20
- 12th grade, no diploma: 247
- High school graduate (or equivalency): 1,495
- Less than 1 year of college: 341
- Some college more than 1 year, no degree: 855
- Associate degree: 487
- Bachelor's degree: 1,009
- Master's degree: 353
- Professional school degree: 70
- Doctorate degree: 63

Education attainment for females 25 years and older:
- No schooling: 141
- Nursery to 4th grade: 19
- 5th and 6th grade: 100
- 7th and 8th grade: 108
- 9th grade: 47
- 10th grade: 15
- 11th grade: 26
- 12th grade, no diploma: 144
- High school graduate (or equivalency): 1,895
- Less than 1 year of college: 312
- Some college more than 1 year, no degree: 786
- Associate degree: 497
- Bachelor's degree: 1,119
- Master's degree: 692
- Professional school degree: 81
- Doctorate degree: 15

Housing units in structures:
- One, detached: 4,632
- One, attached: 118
- Two: 220
- 3 or 4: 169
- 5 to 9: 130
- 10 to 19: 37
- 20 to 49: 399
- 50 or more: 502
- Mobile homes: 8
Housing units lacking complete kitchen facilities in 2022: 1.0%
House/condo owner moved in on average 18 years ago
Renter moved in on average 2 years ago

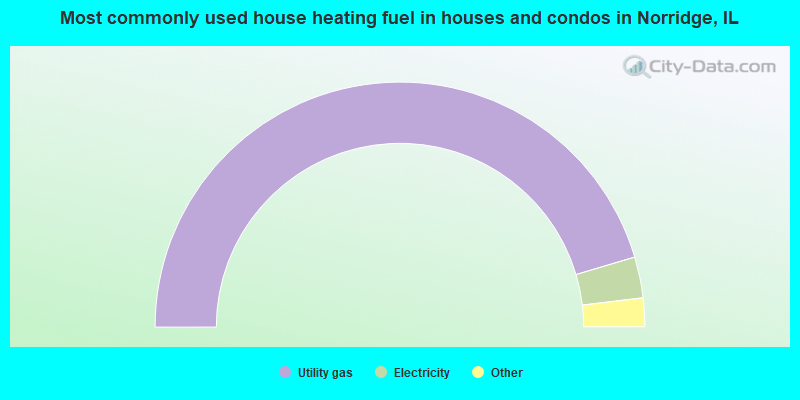
- 90.8%Utility gas
- 5.4%Electricity
- 3.1%Bottled, tank, or LP gas
- 0.5%Other fuel
- 0.2%No fuel used
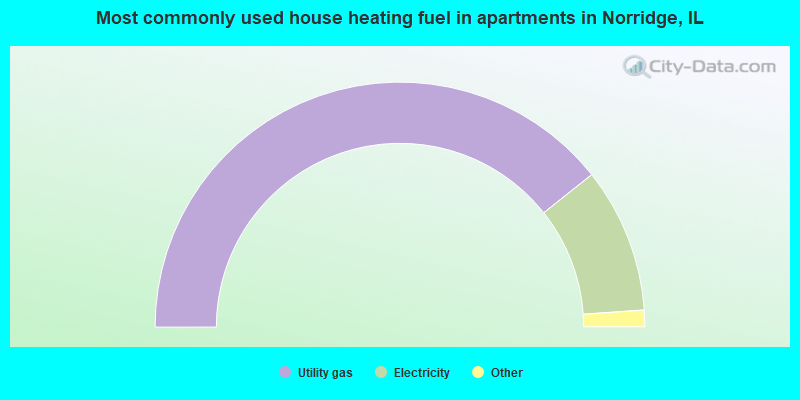
- 78.8%Utility gas
- 19.2%Electricity
- 1.1%Bottled, tank, or LP gas
- 0.9%No fuel used
Private vs. public school enrollment:
| Here: | 15.9% |
| Illinois: | 13.3% |
| Here: | 13.4% |
| Illinois: | 9.9% |
| Here: | 41.2% |
| Illinois: | 27.4% |


