North Atlanta, GA (Georgia) Houses and Residents
| North Atlanta: | $653,219 |
| Georgia: | $297,400 |
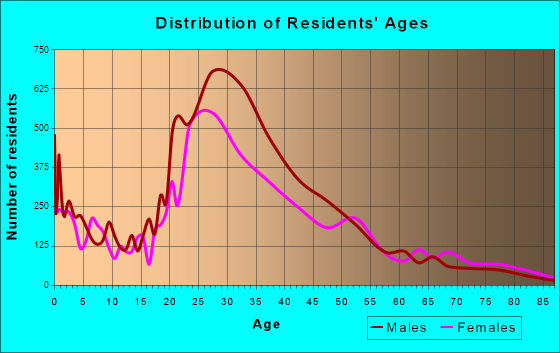
Total population: 40,456 (Urban population: 38,403, Rural population: 0)
Houses: 18,910 (16,810 occupied: 7,339 owner occupied, 10,123 renter occupied)
| % of renters here: | 58% |
| State: | 34% |
Housing density: 2,471 houses/condos per square mile
Median price asked for vacant for-sale houses and condos in 2012_5yr: $192,376.
Median contract rent in 2022: $1,479 (lower quartile is $1,137, upper quartile is over $2,000)
Median rent asked for vacant for-rent units in 2022: $1,431
Median gross rent in North Atlanta, GA in 2022: $1,691
Housing units in North Atlanta with a mortgage: 5,034 (129 second mortgage, 504 home equity loan, 19 both second mortgage and home equity loan)
Houses without a mortgage: 1,499
Median household income for houses/condos with a mortgage: $177,188
Median household income for apartments without a mortgage: $116,076
Median monthly housing costs: $1,405


 | Moving to North Atlanta Soon - Advice about Schools and Rental Houses (2 replies) |
| Housing Search (230 replies) |
| Is there any slowdown in housing yet? (76 replies) |
| Indian family moving to North Atlanta (23 replies) |
| Atlanta Good Rating Schools Indian Population Buying home (15 replies) |
| Buying an existing home in Competitive market (21 replies) |
Median year apartment built: 1988
Household type by relationship:
Households: 41,078- In family households: 28,088 (4,684 male householders, 3,126 female householders)
6,028 spouses, 9,389 children (8,861 natural, 240 adopted, 287 stepchildren), 155 grandchildren, 1,745 brothers or sisters, 406 parents, 0 foster children, 873 other relatives, 1,679 non-relatives
- In nonfamily households: 12,186 (4,354 male householders (2,960 living alone)), 4,314 female householders (3,611 living alone)), 3,517 nonrelatives
- In group quarters: 804
Size of family households: 3,773 2-persons, 1,609 3-persons, 1,468 4-persons, 578 5-persons, 277 6-persons, 391 7-or-more-persons.
Size of nonfamily households: 7,336 1-person, 2,194 2-persons, 288 3-persons, 44 6-persons.
5,926 married couples with children.
1,579 single-parent households (791 men, 788 women).
59.0% of residents of North Atlanta speak English at home.
28.1% of residents speak Spanish at home (46% speak English very well, 16% speak English well, 24% speak English not well, 14% don't speak English at all).
5.6% of residents speak other Indo-European language at home (64% speak English very well, 20% speak English well, 15% speak English not well, 1% don't speak English at all).
2.9% of residents speak Asian or Pacific Island language at home (62% speak English very well, 26% speak English well, 13% speak English not well).
3.3% of residents speak other language at home (54% speak English very well, 28% speak English well, 18% speak English not well).
Foreign born population: 12,095 (30.6%)
(15.2% of them are naturalized citizens)
| Here: | 7.2 |
| State: | 6.8 |
| Here: | 4.1 |
| State: | 4.6 |

- Bedrooms in owner-occupied houses and condos in North Atlanta, Georgia
- 0no bedroom
- 1491 bedroom
- 1,2262 bedrooms
- 3,3223 bedrooms
- 1,7634 bedrooms
- 8805+ bedrooms

- Bedrooms in renter-occupied apartments in North Atlanta, Georgia
- 161no bedroom
- 3,2521 bedroom
- 5,1422 bedrooms
- 1,4463 bedrooms
- 1084 bedrooms
- 155+ bedrooms

- Cars and other vehicles available in North Atlanta in owner-occupied houses/condos
- 221no vehicle
- 2,1801 vehicle
- 4,0562 vehicles
- 8163 vehicles
- 464 vehicles
- 205+ vehicles

- Cars and other vehicles available in North Atlanta in renter-occupied apartments
- 2,116no vehicle
- 5,1091 vehicle
- 2,6722 vehicles
- 2263 vehicles
- 04 vehicles
- 05+ vehicles

- Rooms in owner-occupied houses in North Atlanta, Georgia
- 01 room
- 492 rooms
- 1153 rooms
- 2424 rooms
- 8895 rooms
- 1,7186 rooms
- 1,3457 rooms
- 1,1608 rooms
- 1,8769+ rooms

- Rooms in renter-occupied apartments in North Atlanta, Georgia
- 1621 room
- 5432 rooms
- 2,0283 rooms
- 3,6874 rooms
- 2,3065 rooms
- 8626 rooms
- 2997 rooms
- 1168 rooms
- 1949+ rooms


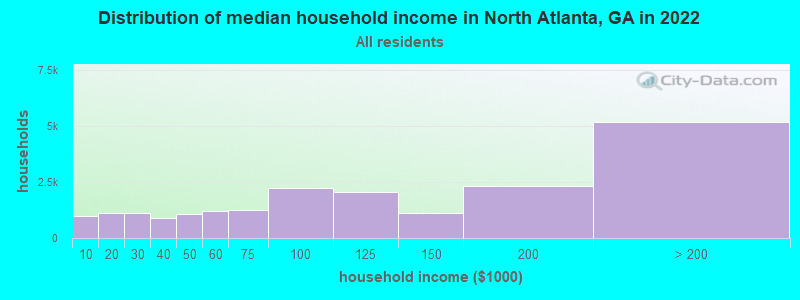
North Atlanta, GA household income distribution

- 968Less than $10,000
- 1,114$10,000 to $19,999
- 1,101$20,000 to $29,999
- 910$30,000 to $39,999
- 1,089$40,000 to $49,999
- 1,216$50,000 to $59,999
- 1,258$60,000 to $74,999
- 2,213$75,000 to $99,999
- 2,072$100,000 to $124,999
- 1,095$125,000 to $149,999
- 2,308$150,000 to $199,999
- 5,169$200,000 or more
Rent paid by renters in 2012_3yr in North Atlanta, GA
-
- 20$100 to $149
- 115$150 to $199
- 24$200 to $249
- 16$250 to $299
- 49$300 to $349
- 40$350 to $399
- 10$400 to $449
- 221$450 to $499
- 155$500 to $549
- 427$550 to $599
- 417$600 to $649
- 1,337$650 to $699
- 698$700 to $749
- 899$750 to $799
- 1,247$800 to $899
- 648$900 to $999
- 2,277$1,000 to $1,249
- 629$1,250 to $1,499
- 127$1,500 to $1,999
- 260$2,000 or more
- 39No cash rent

Percentage of workers working in this county: 42.9%
Number of people working at home: 4,777 (17.6% of all workers)
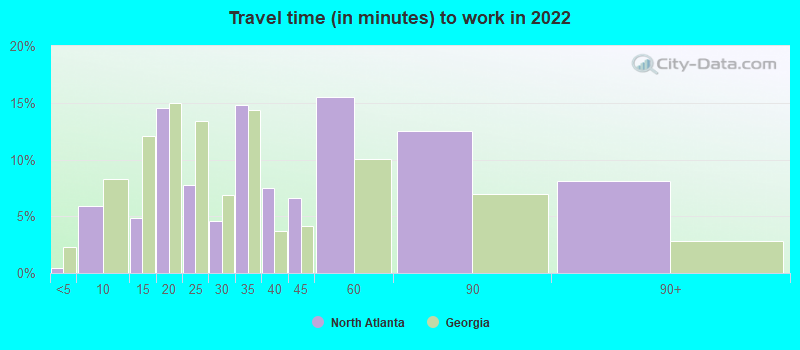
Travel time to work (commute)
- Less than 5 minutes: 241
- 5 to 9 minutes: 928
- 10 to 14 minutes: 1,686
- 15 to 19 minutes: 3,818
- 20 to 24 minutes: 3,570
- 25 to 29 minutes: 2,514
- 30 to 34 minutes: 4,570
- 35 to 39 minutes: 1,430
- 40 to 44 minutes: 689
- 45 to 59 minutes: 1,908
- 60 to 89 minutes: 1,539
- 90 or more minutes: 728
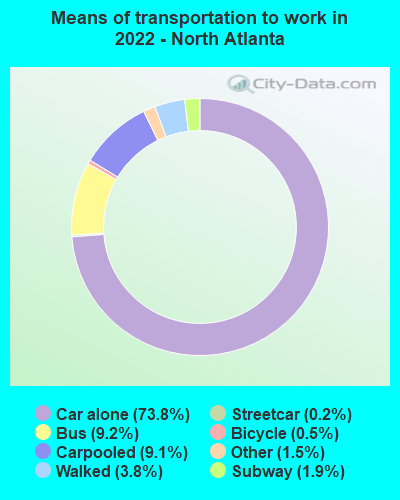
Means of transportation to work:
- Drove a car alone: 8,411 (60.0%)
- Carpooled: 931 (6.6%)
- Bus or trolley bus: 668 (4.8%)
- Streetcar or trolley car: 5 (0.0%)
- Subway or elevated: 198 (1.4%)
- Taxi: 147 (1.0%)
- Bicycle: 26 (0.2%)
- Walked: 417 (3.0%)
- Worked at home: 5,408 (38.5%)
- Unemployment by race in 2022
- Unemployment rate for White non-Hispanic residents
- 1.2%Males
- 0.8%Females
- Unemployment rate for Black residents
- 4.5%Males
- 3.2%Females
- Unemployment rate for Asian residents
- 2.7%Females
- Unemployment rate for other race residents
- 3.5%Males
- 7.4%Females
- Unemployment rate for two or more race residents
- 4.2%Males
- Unemployment rate for Hispanic or Latino residents
- 3.2%Males
- 5.2%Females

- Year of entry for the foreign-born population in North Atlanta, Georgia
- 1,1792010 or later
- 5952000 to 2009
- 2411990 to 1999
- 2,1321980 to 1989
- 6241970 to 1979
- 335Before 1970

First ancestries reported:
- English: 1,755 (6.5%)
- American: 1,338 (5.0%)
- Irish: 1,120 (4.2%)
- European: 912 (3.4%)
- German: 797 (3.0%)
- Ethiopian: 708 (2.6%)
- Italian: 399 (1.5%)
- British: 357 (1.3%)
- Nigerian: 321 (1.2%)
- Polish: 316 (1.2%)
- Russian: 306 (1.1%)
- Scottish: 220 (0.8%)
- Scotch-Irish: 184 (0.7%)
- African: 184 (0.7%)
- Ghanaian: 166 (0.6%)
- French: 160 (0.6%)
- Brazilian: 157 (0.6%)
- Welsh: 141 (0.5%)
- Canadian: 132 (0.5%)
- West Indian: 125 (0.5%)
- Eastern European: 106 (0.4%)
- Norwegian: 91 (0.3%)
- Hungarian: 69 (0.3%)
- Dutch: 68 (0.3%)
- Swedish: 67 (0.2%)
- Greek: 50 (0.2%)
- Austrian: 49 (0.2%)
- Iranian: 45 (0.2%)
- Lebanese: 42 (0.2%)
- Jamaican: 42 (0.2%)
- Slavic: 41 (0.2%)
- Australian: 40 (0.1%)
- French Canadian: 35 (0.1%)
- Bulgarian: 29 (0.1%)
- Romanian: 27 (0.1%)
- Belgian: 25 (0.09%)
- Turkish: 24 (0.09%)
- New Zealander: 24 (0.09%)
- Maltese: 23 (0.09%)
- Slovak: 21 (0.08%)
- South African: 21 (0.08%)
- Cajun: 20 (0.07%)
- Ukrainian: 20 (0.07%)
- Czech: 18 (0.07%)
- Scandinavian: 15 (0.06%)
- Danish: 14 (0.05%)
- Swiss: 13 (0.05%)
- Arab: 11 (0.04%)
- Latvian: 11 (0.04%)
- Yugoslavian: 9 (0.03%)
- British West Indian: 8 (0.03%)
Most common places of birth for foreign-born residents (%):
| North Atlanta: | 58.2% (6,921) |
| Georgia: | 100.0% (-1) |
| North Atlanta: | 3.3% (396) |
| Georgia: | 100.0% (-1) |
| North Atlanta: | 3.3% (389) |
| Georgia: | 100.0% (-1) |
| North Atlanta: | 2.5% (303) |
| Georgia: | 100.0% (-1) |
| North Atlanta: | 2.5% (297) |
| Georgia: | 100.0% (-1) |
| North Atlanta: | 2.4% (285) |
| Georgia: | 100.0% (-1) |
| North Atlanta: | 2.0% (239) |
| Georgia: | 100.0% (-1) |
| North Atlanta: | 1.6% (193) |
| Georgia: | 100.0% (-1) |
Place of birth for U.S.-born residents:
- This state: 13,190
- Other state: 13,260
- Northeast: 3,321
- Midwest: 2,947
- South: 5,620
- West: 1,384
87.5% of North Atlanta residents lived in the same house 1 years ago.
Out of people who lived in different houses, 27.5% lived in this county.
Out of people who lived in different counties, 65.9% lived in Georgia.
| North Atlanta: | 87.5% |
| State average: | 86.6% |
Education attainment for males 25 years and older:
- No schooling: 683
- Nursery to 4th grade: 363
- 5th and 6th grade: 460
- 7th and 8th grade: 263
- 9th grade: 203
- 10th grade: 215
- 11th grade: 18
- 12th grade, no diploma: 150
- High school graduate (or equivalency): 3,048
- Less than 1 year of college: 147
- Some college more than 1 year, no degree: 1,153
- Associate degree: 1,156
- Bachelor's degree: 5,334
- Master's degree: 2,763
- Professional school degree: 961
- Doctorate degree: 304

Education attainment for females 25 years and older:
- No schooling: 187
- Nursery to 4th grade: 208
- 5th and 6th grade: 389
- 7th and 8th grade: 203
- 9th grade: 221
- 10th grade: 37
- 11th grade: 35
- 12th grade, no diploma: 56
- High school graduate (or equivalency): 2,086
- Less than 1 year of college: 184
- Some college more than 1 year, no degree: 956
- Associate degree: 801
- Bachelor's degree: 5,772
- Master's degree: 3,072
- Professional school degree: 703
- Doctorate degree: 511

Housing units in structures:
- One, detached: 7,009
- One, attached: 1,636
- Two: 345
- 3 or 4: 556
- 5 to 9: 2,958
- 10 to 19: 2,682
- 20 to 49: 1,751
- 50 or more: 1,930
- Mobile homes: 39
Median worth of mobile homes: $13,388
Housing units lacking complete kitchen facilities in 2022: 2.2%
House/condo owner moved in on average 11 years ago
Renter moved in on average 0 years ago

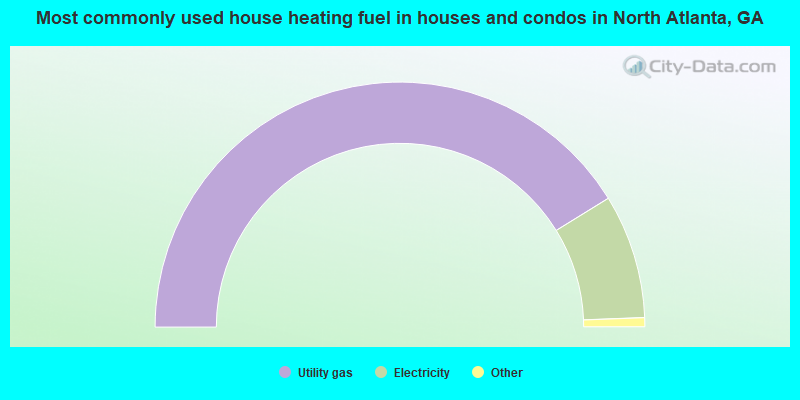
- 82.4%Utility gas
- 16.4%Electricity
- 0.7%Bottled, tank, or LP gas
- 0.6%No fuel used
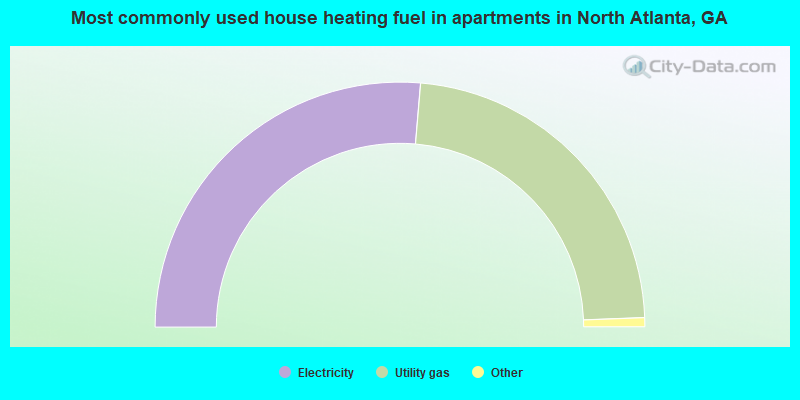
- 52.7%Electricity
- 46.1%Utility gas
- 0.7%Bottled, tank, or LP gas
- 0.2%No fuel used
- 0.2%Wood
- 0.1%Other fuel
Private vs. public school enrollment:
| Here: | 29.1% |
| Georgia: | 12.1% |
| Here: | 13.2% |
| Georgia: | 10.8% |
| Here: | 37.8% |
| Georgia: | 17.1% |


