North El Dorado, CA (California) Houses and Residents
| North El Dorado: | $616,775 |
| California: | $715,900 |
Total population: 31,656 (Urban population: 5,129 (all inside urban clusters), Rural population: 23,154 (450 farm, 22,704 nonfarm))
Houses: 11,960 (10,730 occupied: 9,016 owner occupied, 1,714 renter occupied)
| % of renters here: | 16% |
| State: | 44% |
Housing density: 16 houses/condos per square mile
Median price asked for vacant for-sale houses and condos in 2022 in this county: $493,466.
Median contract rent in 2022: $1,301 (lower quartile is $791, upper quartile is over $2,000)
Median rent asked for vacant for-rent units in 2022: $887
Median gross rent in North El Dorado, CA in 2022: $1,741
Housing units in North El Dorado with a mortgage: 4,992 (696 second mortgage, 452 home equity loan, 19 both second mortgage and home equity loan)
Houses without a mortgage: 1,622
Compare current foreclosures near North El Dorado, CA:
| Photo | Address | Area | Beds / Baths | Price | Details |
|---|---|---|---|---|---|

|
#1
Sly Park Rd
Pollock Pines, CA 95726
|
1,252 sq. feet
|
2 baths 4 beds |
show details | |

|
#2
Happy Pines Dr
Foresthill, CA 95631
|
2,996 sq. feet
|
2 baths 3 beds |
show details | |

|
#3
Dusty Ln
Placerville, CA 95667
|
2,357 sq. feet
|
3 baths 3 beds |
show details | |

|
#4
Pollock Ave
Pollock Pines, CA 95726
|
1,331 sq. feet
|
2 baths 3 beds |
show details | |

|
#5
Fort Jim Rd
Placerville, CA 95667
|
2,300 sq. feet
|
2 baths 3 beds |
show details | |

|
#6
Gregory Ln
Placerville, CA 95667
|
1,440 sq. feet
|
2 baths 2 beds |
show details | |

|
#7
Westley Rd
Placerville, CA 95667
|
1,540 sq. feet
|
2 baths 3 beds |
show details | |

|
#8
Marjorie Way
Pollock Pines, CA 95726
|
1,826 sq. feet
|
2 baths 3 beds |
show details | |

|
#9
Stellar Ln
Pollock Pines, CA 95726
|
- sq. feet
|
1 baths 2 beds |
show details | |

|
#10
Pony Express Trl
Camino, CA 95709
|
1,320 sq. feet
|
1 baths 3 beds |
show details |
| Photo | Address | Area | Beds / Baths | Price | Details |
|---|---|---|---|---|---|

|
#11
Nugget Ln
Placerville, CA 95667
|
1,584 sq. feet
|
2 baths 3 beds |
show details | |

|
#12
Meadow Glen Dr
Grizzly Flats, CA 95636
|
1,260 sq. feet
|
2 baths 3 beds |
show details | |

|
#13
Fallen Oak Trl
Pollock Pines, CA 95726
|
1,590 sq. feet
|
2 baths 2 beds |
show details | |

|
#14
Maltby Mine Rd
Greenwood, CA 95635
|
1,152 sq. feet
|
2 baths 2 beds |
show details | |

|
#15
Chestnut Ln
Placerville, CA 95667
|
1,272 sq. feet
|
2 baths 3 beds |
show details | |

|
#16
Good Pasture Rd
Placerville, CA 95667
|
2,082 sq. feet
|
3 baths 3 beds |
show details | |

|
#17
Odd Fellows
Diamond Springs, CA 95619
|
1,304 sq. feet
|
1 baths 2 beds |
show details | |

|
#18
Rainbow Ridge Rd
Placerville, CA 95667
|
4,216 sq. feet
|
3 baths 5 beds |
show details | |

|
#19
Pasture Pl
Garden Valley, CA 95633
|
1,493 sq. feet
|
2 baths 3 beds |
show details | |

|
#20
Log Cabin Ln
Placerville, CA 95667
|
1,315 sq. feet
|
2 baths 2 beds |
show details |
| Photo | Address | Area | Beds / Baths | Price | Details |
|---|---|---|---|---|---|

|
#21
Bronzecrest St
Placerville, CA 95667
|
1,955 sq. feet
|
2 baths 3 beds |
show details | |

|
#22
Pleasant Valley Rd
Placerville, CA 95667
|
1,010 sq. feet
|
1 baths 2 beds |
show details | |

|
#23
State Highway 49
Placerville, CA 95667
|
1,728 sq. feet
|
2 baths 4 beds |
show details | |

|
#24
Heagey Hill Rd
Placerville, CA 95667
|
2,396 sq. feet
|
2 baths 4 beds |
show details | |

|
#25
Amaryllis Dr
Pollock Pines, CA 95726
|
960 sq. feet
|
1 baths 1 beds |
show details | |

|
#26
Crown Point Dr
Diamond Springs, CA 95619
|
1,139 sq. feet
|
2 baths 3 beds |
show details | |

|
#27
Twelve Oaks Ln
Placerville, CA 95667
|
1,559 sq. feet
|
2 baths 3 beds |
show details | |

|
#28
Hollow Oak Ct
Garden Valley, CA 95633
|
1,262 sq. feet
|
2 baths 3 beds |
show details | |

|
#29
Washington St
Placerville, CA 95667
|
892 sq. feet
|
1 baths 3 beds |
show details | |

|
#30
Logans Ln
Placerville, CA 95667
|
1,662 sq. feet
|
2 baths 3 beds |
show details |
| Photo | Address | Area | Beds / Baths | Price | Details |
|---|---|---|---|---|---|

|
#31
Deer Canyon Ct
Placerville, CA 95667
|
2,508 sq. feet
|
2 baths 2 beds |
show details | |

|
#32
Panorama Dr
Placerville, CA 95667
|
1,300 sq. feet
|
1 baths 2 beds |
show details | |

|
#33
Golden Spur Dr
Placerville, CA 95667
|
2,633 sq. feet
|
3 baths 4 beds |
show details | |

|
#34
Quartz Dr
El Dorado, CA 95623
|
1,920 sq. feet
|
2 baths 3 beds |
show details | |

|
#35
Slug Gulch Rd
Somerset, CA 95684
|
1,464 sq. feet
|
2 baths 3 beds |
show details | |

|
#36
Cold Springs Dr
Foresthill, CA 95631
|
2,045 sq. feet
|
2 baths 2 beds |
show details | |

|
#37
Granite Springs Rd
Somerset, CA 95684
|
1,628 sq. feet
|
2 baths 3 beds |
show details | |

|
#38
Hillbrook Ct
El Dorado, CA 95623
|
1,418 sq. feet
|
2 baths 3 beds |
show details | |

|
#39
Alazan Rd
Placerville, CA 95667
|
1,344 sq. feet
|
2 baths 2 beds |
show details | |

|
#40
Greenstone Rd
Placerville, CA 95667
|
3,800 sq. feet
|
4 baths 4 beds |
show details |
| Photo | Address | Area | Beds / Baths | Price | Details |
|---|---|---|---|---|---|

|
#41
Happy Pines Dr
Foresthill, CA 95631
|
1,904 sq. feet
|
2 baths 3 beds |
show details | |

|
#42
Outingdale Rd
Somerset, CA 95684
|
1,533 sq. feet
|
2 baths 2 beds |
show details | |

|
#43
Cascade Trl
Cool, CA 95614
|
1,542 sq. feet
|
2 baths 2 beds |
show details | |

|
#44
Indian Creek Rd
Placerville, CA 95667
|
1,736 sq. feet
|
2 baths 4 beds |
show details | |

|
#45
Springvale Rd
Placerville, CA 95667
|
1,565 sq. feet
|
1 baths 2 beds |
show details | |

|
#46
Bellwood Ct
Foresthill, CA 95631
|
2,112 sq. feet
|
3 baths 3 beds |
show details | |

|
#47
Jacarah Rd
Placerville, CA 95667
|
3,071 sq. feet
|
3 baths 4 beds |
show details | |

|
#48
Potter Ln
Foresthill, CA 95631
|
2,516 sq. feet
|
1 baths 3 beds |
show details | |

|
#49
Patterson Dr
Diamond Springs, CA 95619
|
672 sq. feet
|
1 baths 2 beds |
show details | |

|
Check over 1 million property listings on Foreclosure.com!
|
browse all offers | |||

Household type by relationship:
Households: 179,415- In family households: 152,575 (37,135 male householders, 12,583 female householders)
40,272 spouses, 50,057 children (46,225 natural, 1,418 adopted, 2,414 stepchildren), 2,802 grandchildren, 1,252 brothers or sisters, 1,468 parents, foster children, 1,623 other relatives, 4,132 non-relatives
- In nonfamily households: 26,840 (10,259 male householders (7,357 living alone)), 10,246 female householders (8,143 living alone)), 6,335 nonrelatives
- In group quarters: 1,643 (911 institutionalized population)
29,716 married couples with children.
7,709 single-parent households (2,180 men, 5,529 women).
94.4% of residents of North El Dorado speak English at home.
3.1% of residents speak Spanish at home (64% speak English very well, 20% speak English well, 8% speak English not well, 8% don't speak English at all).
2.1% of residents speak other Indo-European language at home (85% speak English very well, 12% speak English well, 2% speak English not well, 1% don't speak English at all).
0.3% of residents speak Asian or Pacific Island language at home (77% speak English very well, 23% speak English well).
0.1% of residents speak other language at home (100% speak English very well).
Foreign born population: 1,739 (5.0%)
(68.9% of them are naturalized citizens)
| Here: | 5.2 |
| State: | 6.0 |
| Here: | 4.3 |
| State: | 3.9 |

- Bedrooms in owner-occupied houses and condos in North El Dorado, California
- 110no bedroom
- 6521 bedroom
- 2,3882 bedrooms
- 4,5663 bedrooms
- 1,0644 bedrooms
- 2365+ bedrooms

- Bedrooms in renter-occupied apartments in North El Dorado, California
- 108no bedroom
- 3841 bedroom
- 6502 bedrooms
- 4743 bedrooms
- 734 bedrooms
- 255+ bedrooms

- Cars and other vehicles available in North El Dorado in owner-occupied houses/condos
- 207no vehicle
- 1,7491 vehicle
- 3,8302 vehicles
- 2,1753 vehicles
- 6704 vehicles
- 3855+ vehicles

- Cars and other vehicles available in North El Dorado in renter-occupied apartments
- 125no vehicle
- 7261 vehicle
- 5842 vehicles
- 1853 vehicles
- 464 vehicles
- 485+ vehicles

- Rooms in owner-occupied houses in North El Dorado, California
- 771 room
- 1642 rooms
- 6763 rooms
- 9424 rooms
- 2,2785 rooms
- 2,1286 rooms
- 1,2397 rooms
- 9028 rooms
- 6109+ rooms

- Rooms in renter-occupied apartments in North El Dorado, California
- 931 room
- 1712 rooms
- 3463 rooms
- 4114 rooms
- 3145 rooms
- 1716 rooms
- 1137 rooms
- 728 rooms
- 239+ rooms


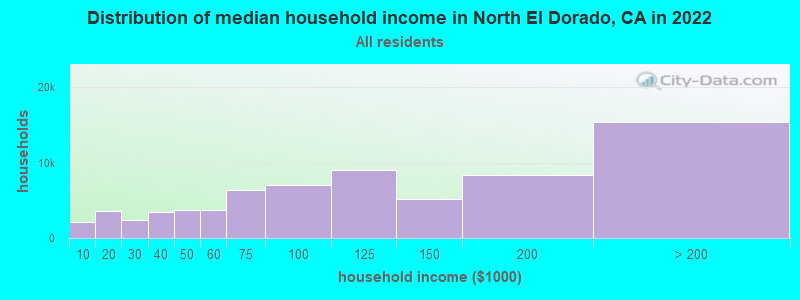
North El Dorado, CA household income distribution

- 2,163Less than $10,000
- 3,518$10,000 to $19,999
- 2,416$20,000 to $29,999
- 3,411$30,000 to $39,999
- 3,695$40,000 to $49,999
- 3,750$50,000 to $59,999
- 6,374$60,000 to $74,999
- 7,038$75,000 to $99,999
- 8,960$100,000 to $124,999
- 5,122$125,000 to $149,999
- 8,328$150,000 to $199,999
- 15,397$200,000 or more
Percentage of workers working in this county: 63.8%
Number of people working at home: 2,467 (16.4% of all workers)
Travel time to work (commute)
- Less than 5 minutes: 313
- 5 to 9 minutes: 825
- 10 to 14 minutes: 1,037
- 15 to 19 minutes: 1,151
- 20 to 24 minutes: 1,284
- 25 to 29 minutes: 561
- 30 to 34 minutes: 1,359
- 35 to 39 minutes: 425
- 40 to 44 minutes: 570
- 45 to 59 minutes: 1,655
- 60 to 89 minutes: 1,717
- 90 or more minutes: 704
Means of transportation to work:
- Drove a car alone: 9,510 (76.8%)
- Carpooled: 1,665 (13.4%)
- Bus or trolley bus: 95 (0.8%)
- Ferryboat: 8 (0.1%)
- Motorcycle: 32 (0.3%)
- Walked: 210 (1.7%)
- Other means: 81 (0.7%)
- Worked at home: 779 (6.3%)


- Year of entry for the foreign-born population in North El Dorado, California
- 1311995 to March 2000
- 1271990 to 1994
- 541985 to 1989
- 761980 to 1984
- 511975 to 1979
- 311970 to 1974
- 591965 to 1969
- 392Before 1965
Most common places of birth for foreign-born residents (%):
| North El Dorado: | 24.3% (224) |
| California: | 44.3% (3,928,701) |
| North El Dorado: | 14.0% (129) |
| California: | 1.6% (141,181) |
| North El Dorado: | 12.1% (111) |
| California: | 1.5% (133,090) |
| North El Dorado: | 11.4% (105) |
| California: | 1.1% (98,160) |
| North El Dorado: | 3.4% (31) |
| California: | 0.3% (22,931) |
| North El Dorado: | 3.1% (29) |
| California: | 0.3% (22,311) |
| North El Dorado: | 2.9% (27) |
| California: | 0.3% (25,825) |
| North El Dorado: | 2.7% (25) |
| California: | 0.3% (28,978) |
| North El Dorado: | 2.5% (23) |
| California: | 0.1% (9,641) |
| North El Dorado: | 2.4% (22) |
| California: | 0.3% (24,350) |
| North El Dorado: | 2.4% (22) |
| California: | 2.4% (211,458) |
| North El Dorado: | 2.2% (20) |
| California: | 7.5% (664,935) |
| North El Dorado: | 1.8% (17) |
| California: | 0.2% (16,809) |
| North El Dorado: | 1.6% (15) |
| California: | 0.2% (20,388) |
Place of birth for U.S.-born residents:
- This state: 18,600
- Other state: 8,542
- Northeast: 1,469
- Midwest: 3,173
- South: 1,733
- West: 2,167
59% of North El Dorado residents lived in the same house 5 years ago.
Out of people who lived in different houses, 42% lived in this county.
Out of people who lived in different counties, 84% lived in California.
Education attainment for males 25 years and older:
- No schooling: 15
- Nursery to 4th grade: 41
- 5th and 6th grade: 36
- 7th and 8th grade: 153
- 9th grade: 172
- 10th grade: 227
- 11th grade: 195
- 12th grade, no diploma: 420
- High school graduate (or equivalency): 2,546
- Less than 1 year of college: 810
- Some college more than 1 year, no degree: 2,066
- Associate degree: 888
- Bachelor's degree: 1,497
- Master's degree: 549
- Professional school degree: 228
- Doctorate degree: 108

Education attainment for females 25 years and older:
- No schooling: 0
- Nursery to 4th grade: 16
- 5th and 6th grade: 27
- 7th and 8th grade: 94
- 9th grade: 99
- 10th grade: 209
- 11th grade: 223
- 12th grade, no diploma: 314
- High school graduate (or equivalency): 2,806
- Less than 1 year of college: 1,119
- Some college more than 1 year, no degree: 2,089
- Associate degree: 932
- Bachelor's degree: 1,446
- Master's degree: 425
- Professional school degree: 195
- Doctorate degree: 42


Housing units in structures:
- One, detached: 10,408
- One, attached: 127
- Two: 84
- 3 or 4: 64
- 5 to 9: 48
- 10 to 19: 26
- 50 or more: 13
- Mobile homes: 1,093
- Boats, RVs, vans, etc.: 97
Median worth of mobile homes: $175,712
Housing units lacking complete kitchen facilities: 0.5%

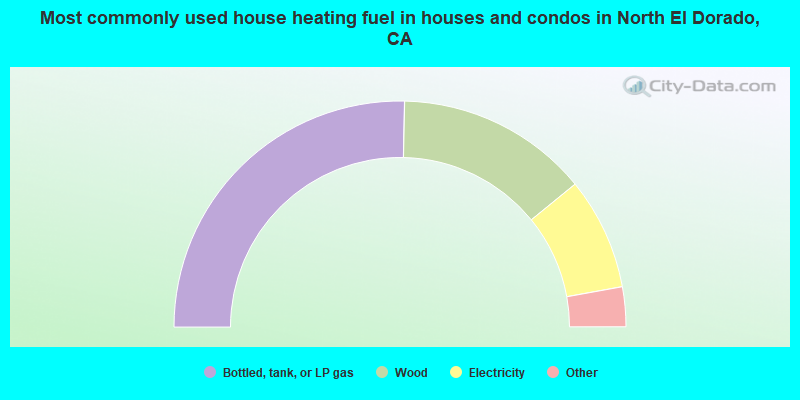
- 50.7%Bottled, tank, or LP gas
- 27.6%Wood
- 16.1%Electricity
- 2.6%Utility gas
- 1.9%Other fuel
- 1.1%Fuel oil, kerosene, etc.
- 0.2%Solar energy
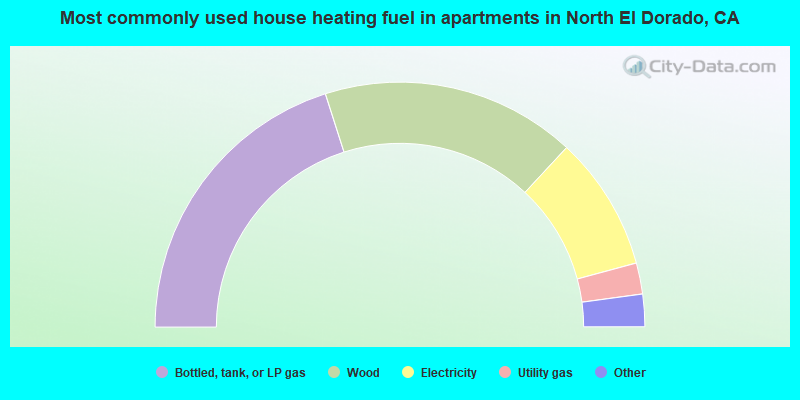
- 40.2%Bottled, tank, or LP gas
- 33.7%Wood
- 17.8%Electricity
- 4.1%Utility gas
- 3.2%Fuel oil, kerosene, etc.
- 0.8%No fuel used
- 0.3%Other fuel
Private vs. public school enrollment:
| Here: | 7.0% |
| California: | 9.9% |
| Here: | 4.1% |
| California: | 7.8% |
| Here: | 13.8% |
| California: | 15.4% |


