North Myrtle Beach, SC (South Carolina) Houses and Residents
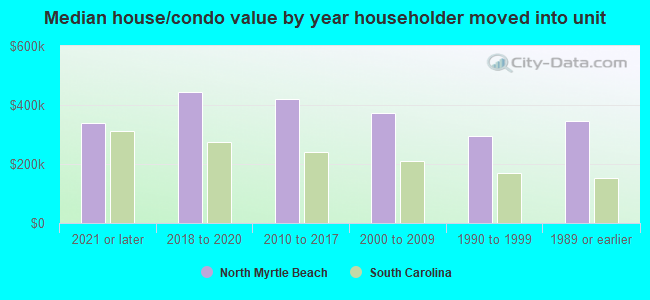
| North Myrtle Beach: | $411,052 |
| South Carolina: | $254,600 |
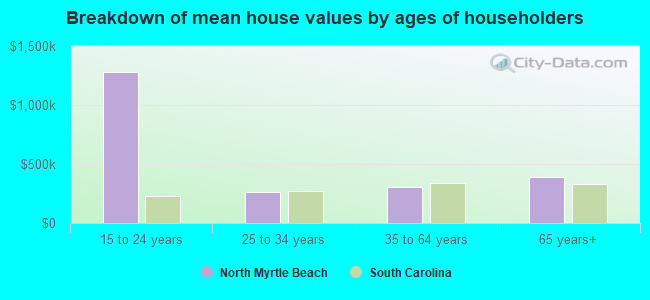
Mean price in 2022:
Detached houses: $519,259
Here: $519,259 State: $368,255 Townhouses or other attached units: $279,502
Here: $279,502 State: $292,023 In 2-unit structures: $228,262
Here: $228,262 State: $358,283 In 3-to-4-unit structures: $119,794
Here: $119,794 State: $230,702 In 5-or-more-unit structures: $257,995
Here: $257,995 State: $326,361 Mobile homes: $122,487
Here: $122,487 State: $102,531
Total population: 15,174 (Urban population: 9,894, Rural population: 1,112 (all nonfarm))
Houses: 27,976 (9,399 occupied: 8,551 owner occupied, 1,631 renter occupied)
| % of renters here: | 16% |
| State: | 28% |
Housing density: 2,146 houses/condos per square mile
Median price asked for vacant for-sale houses and condos in 2022: $246,130.
Median contract rent in 2022: $1,190 (lower quartile is $884, upper quartile is $1,527)
Median rent asked for vacant for-rent units in 2022: $3,369
Median gross rent in North Myrtle Beach, SC in 2022: $1,322
Housing units in North Myrtle Beach with a mortgage: 4,450 (339 second mortgage, 0 home equity loan, 351 both second mortgage and home equity loan)
Houses without a mortgage: 26
Median household income for houses/condos with a mortgage: $104,633
Median household income for apartments without a mortgage: $61,671
Median monthly housing costs: $1,070
Compare current foreclosures near North Myrtle Beach, SC:
| Photo | Address | Area | Beds / Baths | Price | Details |
|---|---|---|---|---|---|

|
#1
Clipper Rd
North Myrtle Beach, SC 29582
|
1,580 sq. feet
|
2 baths 3 beds |
show details | |

|
#2
Anne St
North Myrtle Beach, SC 29582
|
1,810 sq. feet
|
1 baths 3 beds |
show details | |

|
#3
Inlet Marsh Pt
North Myrtle Beach, SC 29582
|
- sq. feet
|
- baths - beds |
show details | |

|
#4
Landing Rd
Little River, SC 29566
|
- sq. feet
|
2 baths 3 beds |
$369,600
|
show details |

|
#5
13th Ave S
Myrtle Beach, SC 29577
|
1,811 sq. feet
|
2 baths 3 beds |
show details | |

|
#6
Hitchcock Way Apt 836
Myrtle Beach, SC 29577
|
1,211 sq. feet
|
2 baths 3 beds |
show details | |

|
#7
N Highway 905
Longs, SC 29568
|
1,344 sq. feet
|
2 baths 3 beds |
show details | |

|
#8
River Oaks Dr Unit 3a
Myrtle Beach, SC 29579
|
606 sq. feet
|
1 baths 1 beds |
show details | |

|
#9
Southern Trl
Myrtle Beach, SC 29579
|
1,956 sq. feet
|
2 baths 3 beds |
show details | |

|
#10
Lake Tree Dr SW
Ocean Isle Beach, NC 28469
|
2,026 sq. feet
|
2 baths 3 beds |
show details |
| Photo | Address | Area | Beds / Baths | Price | Details |
|---|---|---|---|---|---|

|
#11
Pilot House Pl
Calabash, NC 28467
|
1,600 sq. feet
|
3 baths 3 beds |
show details | |

|
#12
Wyndfall Dr SW
Sunset Beach, NC 28468
|
1,328 sq. feet
|
2 baths 3 beds |
show details | |

|
#13
High Point Ave
Calabash, NC 28467
|
1,068 sq. feet
|
2 baths 2 beds |
show details | |

|
#14
Callalily Ct
Myrtle Beach, SC 29579
|
1,852 sq. feet
|
2 baths 4 beds |
show details | |

|
#15
Abingdon Dr
Myrtle Beach, SC 29579
|
2,414 sq. feet
|
2 baths 3 beds |
show details | |

|
#16
Finch Dr SW
Shallotte, NC 28470
|
1,012 sq. feet
|
2 baths 3 beds |
show details | |

|
#17
Haystack Way
Calabash, NC 28467
|
2,080 sq. feet
|
2 baths 4 beds |
show details | |

|
#18
Coteswood Dr
Myrtle Beach, SC 29572
|
1,620 sq. feet
|
1 baths 3 beds |
show details | |

|
#19
Stoney Falls Blvd
Myrtle Beach, SC 29579
|
1,319 sq. feet
|
2 baths 3 beds |
show details | |

|
#20
Blackwolf Dr
Myrtle Beach, SC 29579
|
1,582 sq. feet
|
2 baths 3 beds |
show details |
| Photo | Address | Area | Beds / Baths | Price | Details |
|---|---|---|---|---|---|

|
#21
Buoy Ct
Calabash, NC 28467
|
2,205 sq. feet
|
2 baths 2 beds |
show details | |

|
#22
Heath Dr
Longs, SC 29568
|
1,407 sq. feet
|
2 baths 3 beds |
show details | |

|
#23
Wildhorse Dr
Conway, SC 29526
|
2,676 sq. feet
|
4 baths 4 beds |
show details | |

|
#24
Woodlawn Dr
Conway, SC 29526
|
1,724 sq. feet
|
2 baths 3 beds |
show details | |

|
#25
Nottoway Ave NW
Calabash, NC 28467
|
1,448 sq. feet
|
2 baths 3 beds |
show details | |

|
#26
Arundel Rd
Myrtle Beach, SC 29577
|
2,472 sq. feet
|
2 baths 3 beds |
show details | |

|
#27
Red Bluff Rd
Loris, SC 29569
|
1,058 sq. feet
|
1 baths 3 beds |
show details | |

|
#28
Weeping Willow Dr
Myrtle Beach, SC 29579
|
2,239 sq. feet
|
2 baths 3 beds |
show details | |

|
#29
Bellegrove Dr
Myrtle Beach, SC 29579
|
1,410 sq. feet
|
2 baths 3 beds |
show details | |

|
#30
Sevilleen St SW
Ocean Isle Beach, NC 28469
|
1,872 sq. feet
|
2 baths 3 beds |
show details |
| Photo | Address | Area | Beds / Baths | Price | Details |
|---|---|---|---|---|---|

|
#31
Barn Owl Ct
Myrtle Beach, SC 29579
|
1,582 sq. feet
|
3 baths 3 beds |
show details | |

|
#32
Freeboard Ln
Calabash, NC 28467
|
1,600 sq. feet
|
2 baths 3 beds |
show details | |

|
#33
Valley Dr
Calabash, NC 28467
|
1,330 sq. feet
|
2 baths 3 beds |
show details | |

|
#34
Boundaryline Dr NW
Calabash, NC 28467
|
2,311 sq. feet
|
2 baths 3 beds |
show details | |

|
#35
Scotch Broom Dr # D-103
Little River, SC 29566
|
1,552 sq. feet
|
2 baths 3 beds |
show details | |

|
#36
Nature Trl
Little River, SC 29566
|
1,142 sq. feet
|
2 baths 3 beds |
show details | |

|
#37
Sultana Dr
Little River, SC 29566
|
1,322 sq. feet
|
2 baths 3 beds |
show details | |

|
#38
Stegal Cir
Longs, SC 29568
|
2,864 sq. feet
|
2 baths 3 beds |
show details | |

|
#39
Churchill Downs Dr
Myrtle Beach, SC 29579
|
1,644 sq. feet
|
2 baths 3 beds |
show details | |

|
#40
Seneca Ridge Dr
Myrtle Beach, SC 29579
|
2,812 sq. feet
|
2 baths 4 beds |
show details |
| Photo | Address | Area | Beds / Baths | Price | Details |
|---|---|---|---|---|---|

|
#41
Isabel Ct
Myrtle Beach, SC 29579
|
1,478 sq. feet
|
2 baths 3 beds |
show details | |

|
#42
3rd Ave S
Myrtle Beach, SC 29577
|
1,368 sq. feet
|
1 baths 3 beds |
show details | |

|
#43
Indianola Ct
Myrtle Beach, SC 29579
|
3,111 sq. feet
|
2 baths 4 beds |
show details | |

|
#44
Waterway Village Blvd Apt 18b
Myrtle Beach, SC 29579
|
894 sq. feet
|
2 baths 2 beds |
show details | |

|
#45
Farm Lake Dr
Myrtle Beach, SC 29579
|
1,355 sq. feet
|
2 baths 3 beds |
show details | |

|
#46
Seneca Ridge Dr
Myrtle Beach, SC 29579
|
2,056 sq. feet
|
2 baths 4 beds |
show details | |

|
#47
Waterway Village Blvd Apt 15a
Myrtle Beach, SC 29579
|
894 sq. feet
|
2 baths 2 beds |
show details | |

|
#48
Newburgh Ct
Myrtle Beach, SC 29579
|
- sq. feet
|
- baths - beds |
show details | |

|
#49
Dewberry Ln
Myrtle Beach, SC 29579
|
- sq. feet
|
- baths - beds |
show details | |

|
Check over 1 million property listings on Foreclosure.com!
|
browse all offers | |||


 | Oceanfront Condos along the Grand Strand (9 replies) |
| Cost to build a new home in nmb? (6 replies) |
| Retiring in north Myrtle beach vs florida (24 replies) |
| North Myrtle Beach vs. Myrtle Beach (11 replies) |
| Furnished Apartments or Condo's (2 replies) |
| Tell me about Myrtle Beach crime (15 replies) |

Median year apartment built: 1989
Household type by relationship:
Households: 20,252- Male householders: 5,200 (1,481 living alone), Female householders: 4,408 (1,596 living alone)
4,748 spouses (4,692 opposite-sex spouses), 608 unmarried partners, (576 opposite-sex unmarried partners), 3,046 children (2,826 natural, 126 adopted, 93 stepchildren), 570 grandchildren, 431 brothers or sisters, 247 parents, 0 foster children, 426 other relatives, 559 non-relatives
- In group quarters: 4
Size of family households: 5,158 2-persons, 867 3-persons, 354 4-persons, 101 5-persons, 167 6-persons, 4 7-or-more-persons.
Size of nonfamily households: 3,099 1-person, 634 2-persons, 5 3-persons, 83 4-persons, 8 5-persons.
1,275 married couples with children.
383 single-parent households (7 men, 376 women).
92.0% of residents of North Myrtle Beach speak English at home.
5.1% of residents speak Spanish at home (55% speak English very well, 27% speak English well, 19% speak English not well).
1.5% of residents speak other Indo-European language at home (91% speak English very well, 7% speak English well, 2% speak English not well).
1.7% of residents speak Asian or Pacific Island language at home (51% speak English very well, 21% speak English well, 28% speak English not well).
0.3% of residents speak other language at home (87% speak English very well, 13% speak English well).
Foreign born population: 1,668 (8.2%)
(39.9% of them are naturalized citizens)
| Here: | 5.9 |
| State: | 6.4 |
| Here: | 4.3 |
| State: | 4.5 |
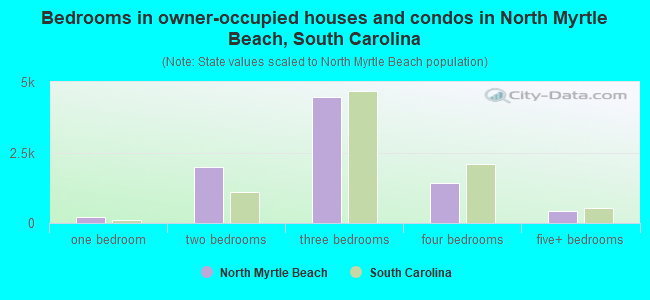
- Bedrooms in owner-occupied houses and condos in North Myrtle Beach, South Carolina
- 30no bedroom
- 2171 bedroom
- 1,9952 bedrooms
- 4,4643 bedrooms
- 1,4204 bedrooms
- 4265+ bedrooms
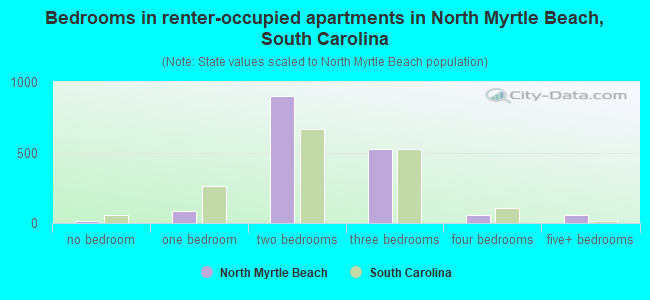
- Bedrooms in renter-occupied apartments in North Myrtle Beach, South Carolina
- 15no bedroom
- 841 bedroom
- 9012 bedrooms
- 5233 bedrooms
- 554 bedrooms
- 555+ bedrooms
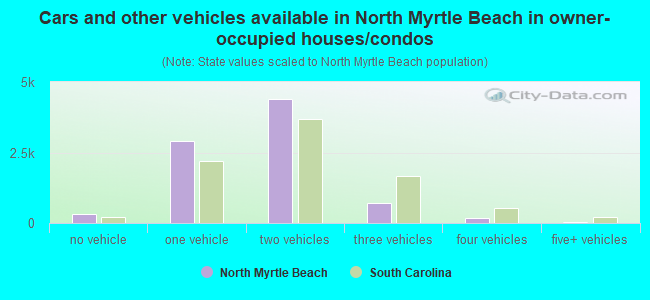
- Cars and other vehicles available in North Myrtle Beach in owner-occupied houses/condos
- 328no vehicle
- 2,9211 vehicle
- 4,3882 vehicles
- 7253 vehicles
- 1654 vehicles
- 255+ vehicles
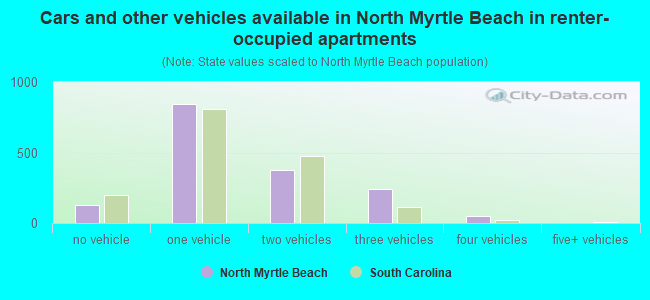
- Cars and other vehicles available in North Myrtle Beach in renter-occupied apartments
- 129no vehicle
- 8421 vehicle
- 3772 vehicles
- 2383 vehicles
- 474 vehicles
- 05+ vehicles
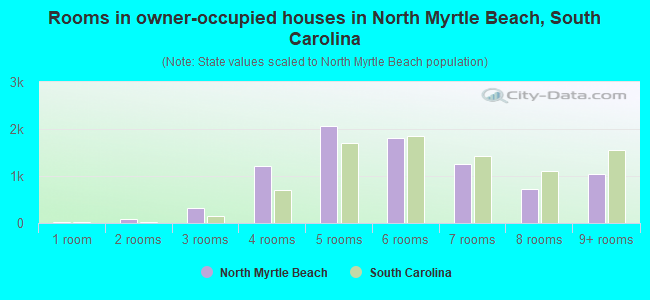
- Rooms in owner-occupied houses in North Myrtle Beach, South Carolina
- 301 room
- 872 rooms
- 3143 rooms
- 1,2154 rooms
- 2,0725 rooms
- 1,8116 rooms
- 1,2587 rooms
- 7288 rooms
- 1,0379+ rooms
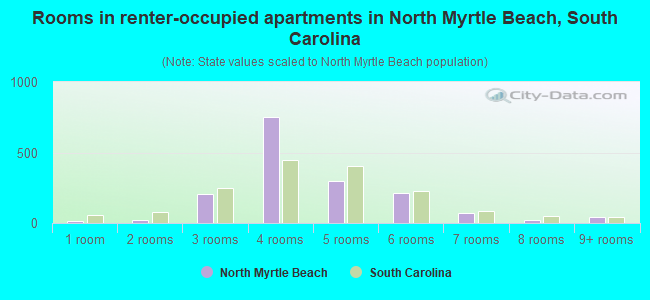
- Rooms in renter-occupied apartments in North Myrtle Beach, South Carolina
- 151 room
- 182 rooms
- 2033 rooms
- 7534 rooms
- 2985 rooms
- 2116 rooms
- 747 rooms
- 198 rooms
- 419+ rooms
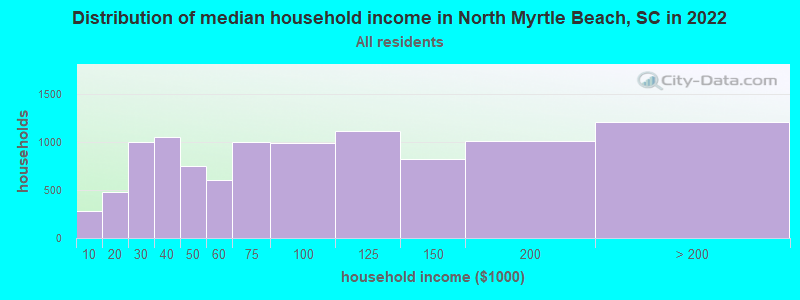
North Myrtle Beach, SC household income distribution

- 279Less than $10,000
- 482$10,000 to $19,999
- 1,001$20,000 to $29,999
- 1,049$30,000 to $39,999
- 746$40,000 to $49,999
- 602$50,000 to $59,999
- 1,001$60,000 to $74,999
- 994$75,000 to $99,999
- 1,111$100,000 to $124,999
- 826$125,000 to $149,999
- 1,015$150,000 to $199,999
- 1,208$200,000 or more
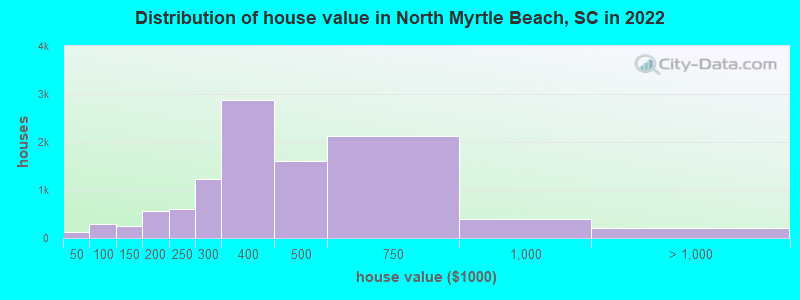
Home value of owner - occupied houses in 2022 in North Myrtle Beach, SC
-
- 9Less than $10,000
- 36$15,000 to $19,999
- 11$20,000 to $24,999
- 5$25,000 to $29,999
- 36$30,000 to $34,999
- 5$35,000 to $39,999
- 27$40,000 to $49,999
- 58$50,000 to $59,999
- 84$70,000 to $79,999
- 66$80,000 to $89,999
- 64$90,000 to $99,999
- 94$100,000 to $124,999
- 150$125,000 to $149,999
- 303$150,000 to $174,999
- 250$175,000 to $199,999
- 605$200,000 to $249,999
- 1,225$250,000 to $299,999
- 2,883$300,000 to $399,999
- 1,607$400,000 to $499,999
- 2,129$500,000 to $749,999
- 396$750,000 to $999,999
- 145$1,000,000 to $1,499,999
- 30$1,500,000 to $1,999,999
- 36$2,000,000 or more
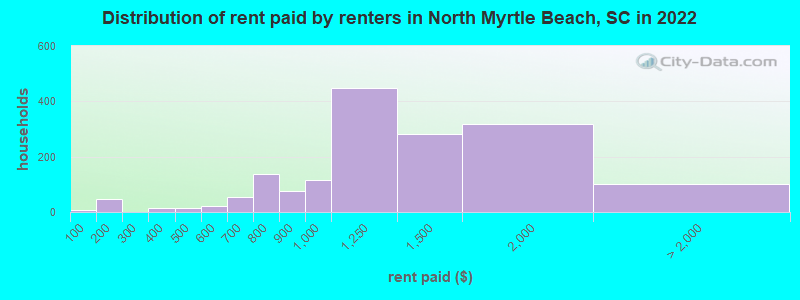
Rent paid by renters in 2022 in North Myrtle Beach, SC
-
- 8Less than $100
- 47$100 to $149
- 14$350 to $399
- 14$450 to $499
- 7$500 to $549
- 15$550 to $599
- 42$600 to $649
- 13$650 to $699
- 81$700 to $749
- 57$750 to $799
- 75$800 to $899
- 116$900 to $999
- 447$1,000 to $1,249
- 280$1,250 to $1,499
- 319$1,500 to $1,999
- 45$2,000 to $2,499
- 54No cash rent
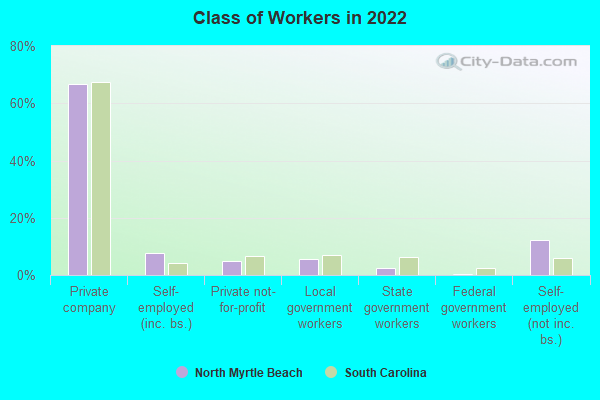
Percentage of workers working in this county: 90.3%
Number of people working at home: 1,620 (18.6% of all workers)
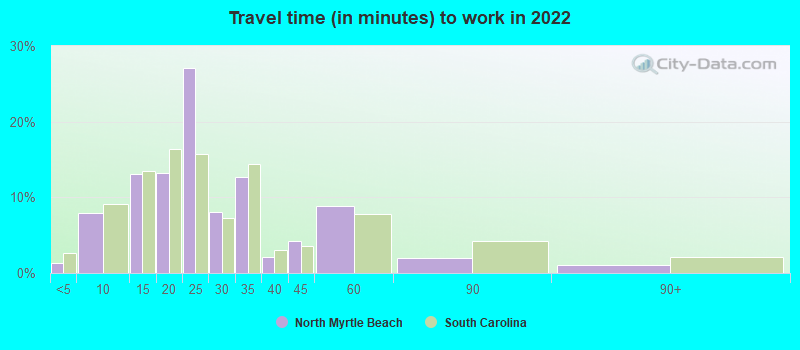
Travel time to work (commute)
- Less than 5 minutes: 119
- 5 to 9 minutes: 891
- 10 to 14 minutes: 1,124
- 15 to 19 minutes: 1,193
- 20 to 24 minutes: 1,582
- 25 to 29 minutes: 487
- 30 to 34 minutes: 730
- 35 to 39 minutes: 227
- 40 to 44 minutes: 175
- 45 to 59 minutes: 226
- 60 to 89 minutes: 134
- 90 or more minutes: 219
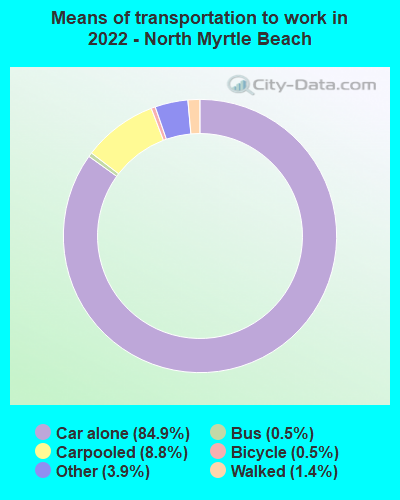
Means of transportation to work:
- Drove a car alone: 9,064 (71.7%)
- Carpooled: 1,155 (9.1%)
- Bus: 32 (0.3%)
- Taxi: 716 (5.7%)
- Bicycle: 61 (0.5%)
- Walked: 147 (1.2%)
- Worked at home: 1,620 (12.8%)
- Unemployment by race in 2022
- Unemployment rate for White non-Hispanic residents
- 3.1%Males
- 3.8%Females
- Unemployment rate for Asian residents
- 25.8%Females
- Unemployment rate for two or more race residents
- 1.3%Males
- 7.7%Females
- Unemployment rate for Hispanic or Latino residents
- 16.6%Females
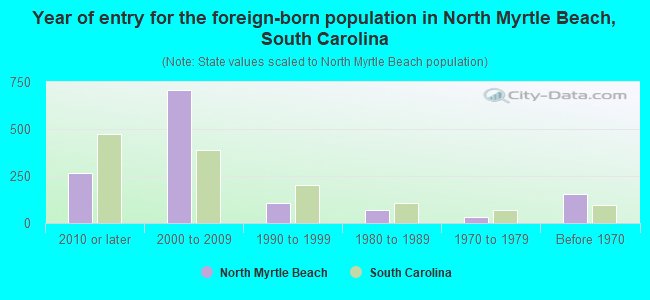
- Year of entry for the foreign-born population in North Myrtle Beach, South Carolina
- 2672010 or later
- 7082000 to 2009
- 1051990 to 1999
- 711980 to 1989
- 341970 to 1979
- 154Before 1970
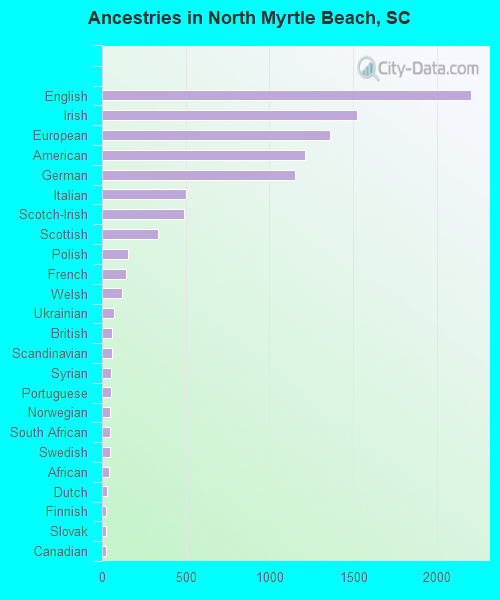
First ancestries reported:
- English: 2,201 (19.2%)
- Irish: 1,520 (13.3%)
- European: 1,362 (11.9%)
- American: 1,214 (10.6%)
- German: 1,150 (10.1%)
- Italian: 502 (4.4%)
- Scotch-Irish: 489 (4.3%)
- Scottish: 337 (2.9%)
- Polish: 156 (1.4%)
- French: 142 (1.2%)
- Welsh: 119 (1.0%)
- Ukrainian: 70 (0.6%)
- British: 61 (0.5%)
- Scandinavian: 59 (0.5%)
- Syrian: 54 (0.5%)
- Portuguese: 53 (0.5%)
- Norwegian: 50 (0.4%)
- South African: 50 (0.4%)
- Swedish: 48 (0.4%)
- African: 42 (0.4%)
- Dutch: 29 (0.3%)
- Finnish: 26 (0.2%)
- Slovak: 25 (0.2%)
- Canadian: 23 (0.2%)
- Eastern European: 18 (0.2%)
- Croatian: 17 (0.1%)
- Russian: 16 (0.1%)
- Armenian: 15 (0.1%)
- Hungarian: 15 (0.1%)
- Iranian: 13 (0.1%)
- Alsatian: 12 (0.1%)
- Lithuanian: 9 (0.08%)
- French Canadian: 8 (0.07%)
- Lebanese: 7 (0.06%)
- Northern European: 6 (0.05%)
- Slovene: 5 (0.04%)
Most common places of birth for foreign-born residents (%):
| North Myrtle Beach: | 21.5% (317) |
| South Carolina: | 22.5% (60,774) |
| North Myrtle Beach: | 12.1% (179) |
| South Carolina: | 3.4% (9,058) |
| North Myrtle Beach: | 8.9% (131) |
| South Carolina: | 0.4% (1,091) |
| North Myrtle Beach: | 8.1% (119) |
| South Carolina: | 6.8% (18,307) |
| North Myrtle Beach: | 7.7% (113) |
| South Carolina: | 3.0% (8,193) |
| North Myrtle Beach: | 6.2% (91) |
| South Carolina: | 3.2% (8,721) |
| North Myrtle Beach: | 5.8% (86) |
| South Carolina: | 4.8% (12,834) |
| North Myrtle Beach: | 4.5% (67) |
| South Carolina: | 1.2% (3,296) |
| North Myrtle Beach: | 2.3% (34) |
| South Carolina: | 2.3% (6,308) |
| North Myrtle Beach: | 2.1% (31) |
| South Carolina: | 3.7% (9,982) |
| North Myrtle Beach: | 2.1% (31) |
| South Carolina: | 1.5% (3,987) |
| North Myrtle Beach: | 2.0% (30) |
| South Carolina: | 2.0% (5,344) |
| North Myrtle Beach: | 2.0% (29) |
| South Carolina: | 1.1% (2,998) |
| North Myrtle Beach: | 1.7% (25) |
| South Carolina: | 0.9% (2,357) |
| North Myrtle Beach: | 1.6% (24) |
| South Carolina: | 0.3% (876) |
| North Myrtle Beach: | 1.6% (23) |
| South Carolina: | 1.4% (3,877) |
Place of birth for U.S.-born residents:
- This state: 3,484
- Other state: 15,062
- Northeast: 5,556
- Midwest: 2,025
- South: 6,713
- West: 647
84.6% of North Myrtle Beach residents lived in the same house 1 years ago.
Out of people who lived in different houses, 19.9% lived in this county.
Out of people who lived in different counties, 16.4% lived in South Carolina.
| North Myrtle Beach: | 84.6% |
| State average: | 86.5% |
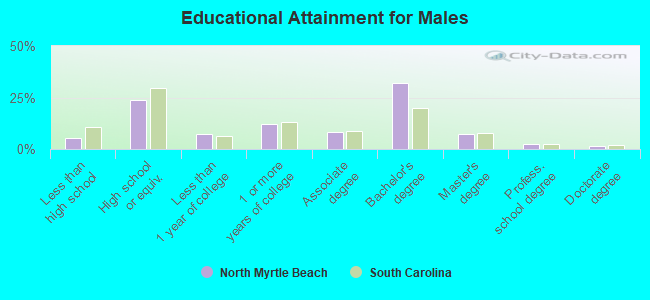
Education attainment for males 25 years and older:
- No schooling: 17
- Nursery to 4th grade: 3
- 5th and 6th grade: 0
- 7th and 8th grade: 74
- 9th grade: 42
- 10th grade: 84
- 11th grade: 92
- 12th grade, no diploma: 130
- High school graduate (or equivalency): 2,051
- Less than 1 year of college: 648
- Some college more than 1 year, no degree: 1,053
- Associate degree: 708
- Bachelor's degree: 2,777
- Master's degree: 650
- Professional school degree: 208
- Doctorate degree: 133
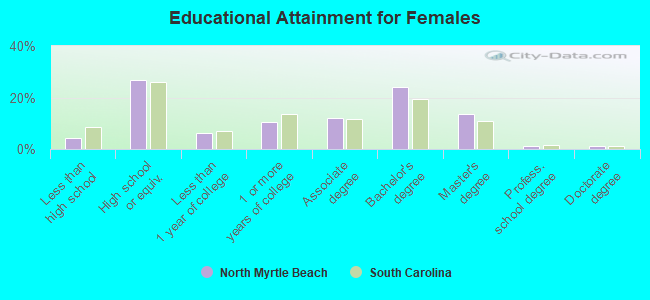
Education attainment for females 25 years and older:
- No schooling: 7
- Nursery to 4th grade: 0
- 5th and 6th grade: 0
- 7th and 8th grade: 46
- 9th grade: 87
- 10th grade: 99
- 11th grade: 47
- 12th grade, no diploma: 106
- High school graduate (or equivalency): 2,443
- Less than 1 year of college: 572
- Some college more than 1 year, no degree: 971
- Associate degree: 1,096
- Bachelor's degree: 2,193
- Master's degree: 1,248
- Professional school degree: 112
- Doctorate degree: 123
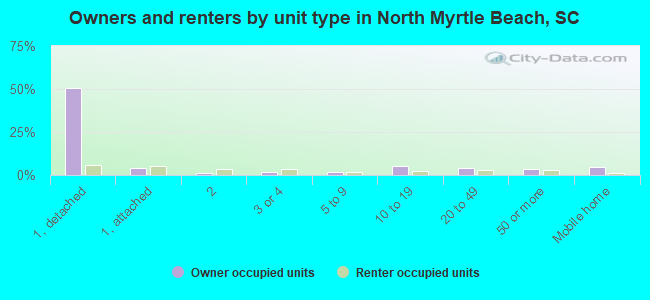
Housing units in structures:
- One, detached: 9,601
- One, attached: 1,140
- Two: 563
- 3 or 4: 960
- 5 to 9: 1,484
- 10 to 19: 2,883
- 20 to 49: 4,156
- 50 or more: 5,851
- Mobile homes: 1,313
- Boats, RVs, vans, etc.: 19
Median worth of mobile homes: $120,199
Housing units lacking complete kitchen facilities in 2022: 0.3%
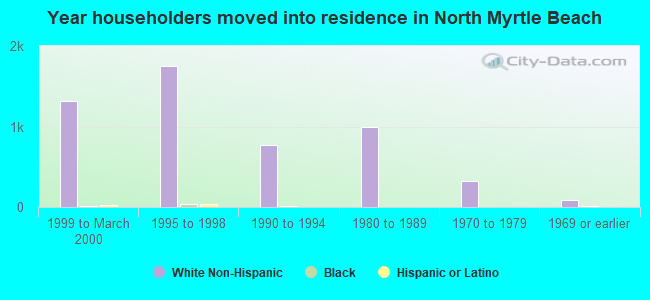
House/condo owner moved in on average 4 years ago
Renter moved in on average 4 years ago
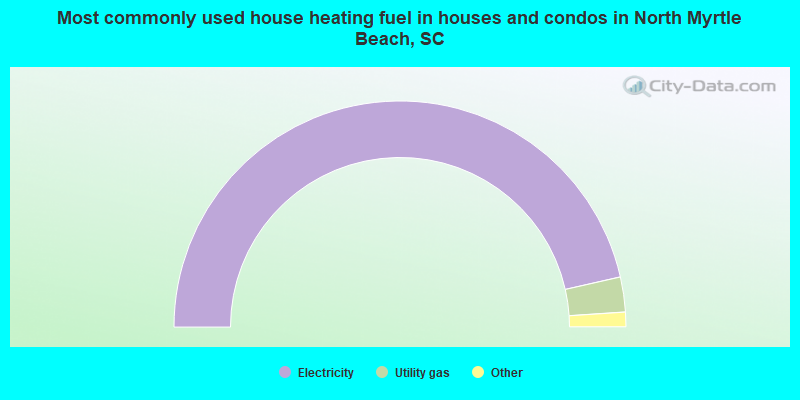
- 92.9%Electricity
- 5.0%Utility gas
- 1.8%Bottled, tank, or LP gas
- 0.3%No fuel used
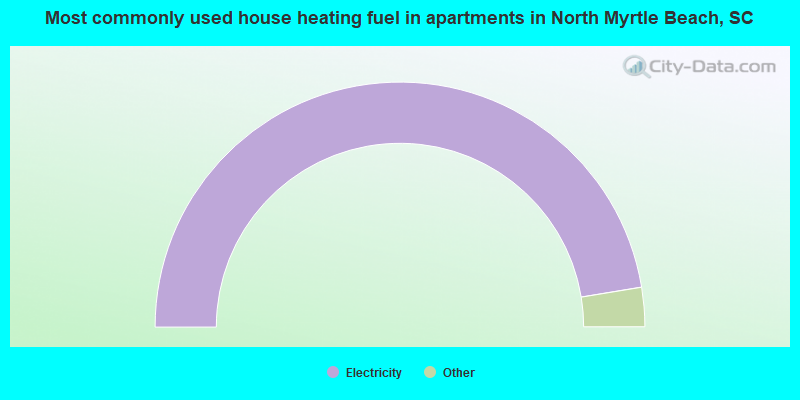
- 94.8%Electricity
- 3.2%Utility gas
- 0.8%Solar energy
- 0.6%Bottled, tank, or LP gas
- 0.6%Wood
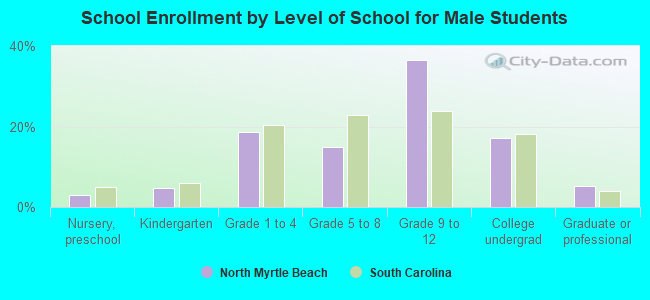
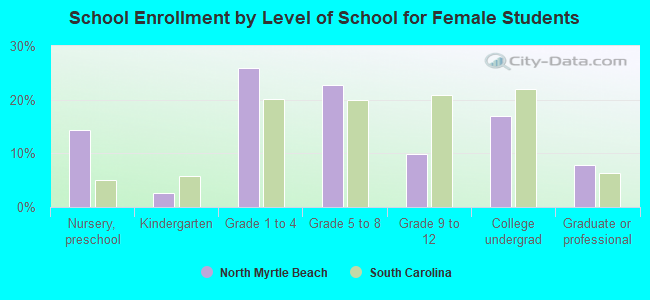
Private vs. public school enrollment:
| Here: | 23.2% |
| South Carolina: | 14.4% |
| Here: | 0.2% |
| South Carolina: | 11.1% |
| Here: | 2.4% |
| South Carolina: | 21.9% |