North Philipsburg, PA (Pennsylvania) Houses and Residents
| North Philipsburg: | $95,994 |
| Pennsylvania: | $245,500 |
Mean price in 2022:
Detached houses: $175,995
Here: $175,995 State: $317,202
Total population: 660 (All urban)
Houses: 341 (304 occupied: 155 owner occupied, 156 renter occupied)
| % of renters here: | 50% |
| State: | 31% |
Housing density: 463 houses/condos per square mile
Median price asked for vacant for-sale houses and condos in 2022 in this county: $312,647.
Median contract rent in 2022: $645 (lower quartile is $552, upper quartile is $843)
Median gross rent in North Philipsburg, PA in 2022: $770
Housing units in North Philipsburg with a mortgage: 111 (4 second mortgage, 0 home equity loan, 0 both second mortgage and home equity loan)
Houses without a mortgage: 0
Median household income for apartments without a mortgage: $52,177
Median monthly housing costs: $844
Compare current foreclosures near North Philipsburg, PA:
| Photo | Address | Area | Beds / Baths | Price | Details |
|---|---|---|---|---|---|

|
#1
N 4th St
Philipsburg, PA 16866
|
1,756 sq. feet
|
2 baths 3 beds |
$39,900
|
show details |

|
#2
4th St
Madera, PA 16661
|
1,294 sq. feet
|
1 baths 3 beds |
show details | |

|
#3
Gorton Rd
Moshannon, PA 16859
|
1,632 sq. feet
|
1 baths 2 beds |
show details | |

|
#4
Gillingham Rd
Frenchville, PA 16836
|
- sq. feet
|
2 baths 4 beds |
show details | |

|
#5
David St
Houtzdale, PA 16651
|
- sq. feet
|
1 baths 3 beds |
show details | |

|
#6
Sawmill Rd
Port Matilda, PA 16870
|
1,392 sq. feet
|
1 baths 3 beds |
show details | |

|
#7
Main St
Smithmill, PA 16680
|
- sq. feet
|
- baths - beds |
$29,900
|
show details |

|
#8
Charles St
Houtzdale, PA 16651
|
- sq. feet
|
2 baths 4 beds |
show details | |

|
#9
Morrisdale Allport H
Morrisdale, PA 16858
|
- sq. feet
|
2 baths 2 beds |
show details | |

|
#10
N 11th St
Philipsburg, PA 16866
|
999 sq. feet
|
1 baths 3 beds |
show details |
| Photo | Address | Area | Beds / Baths | Price | Details |
|---|---|---|---|---|---|

|
#11
Morrisdale Allport Hwy
Morrisdale, PA 16858
|
2 sq. feet
|
2 baths 4 beds |
show details | |

|
#12
Donna Cir
Port Matilda, PA 16870
|
1,828 sq. feet
|
2 baths 3 beds |
show details | |

|
#13
Skytop Mountain Rd
Port Matilda, PA 16870
|
2,880 sq. feet
|
3 baths 5 beds |
show details | |

|
#14
Woodpecker
Port Matilda, PA 16870
|
2,544 sq. feet
|
2 baths 4 beds |
show details | |

|
#15
Logan St
Philipsburg, PA 16866
|
980 sq. feet
|
- baths - beds |
show details | |

|
#16
Frenchville Rd
Frenchville, PA 16836
|
- sq. feet
|
- baths - beds |
show details | |

|
#17
Bigler Ave
Clearfield, PA 16830
|
- sq. feet
|
- baths - beds |
show details | |

|
#18
Montgomery Run Rd # 25
Clearfield, PA 16830
|
- sq. feet
|
- baths - beds |
show details | |

|
#19
Montgomery Run Rd
Clearfield, PA 16830
|
- sq. feet
|
- baths - beds |
show details | |

|
#20
Market St
Karthaus, PA 16845
|
- sq. feet
|
- baths - beds |
show details |
| Photo | Address | Area | Beds / Baths | Price | Details |
|---|---|---|---|---|---|

|
#21
Rolley Rd
Olanta, PA 16863
|
- sq. feet
|
- baths - beds |
show details | |

|
#22
Amblewood Way
State College, PA 16803
|
- sq. feet
|
- baths - beds |
show details | |

|
#23
W 5th Ave
Clearfield, PA 16830
|
- sq. feet
|
- baths - beds |
show details | |

|
#24
S Eagle Valley Rd
Tyrone, PA 16686
|
- sq. feet
|
- baths - beds |
show details | |

|
#25
Boyd Ln
Woodland, PA 16881
|
- sq. feet
|
- baths - beds |
show details | |

|
#26
Sportsmans Rd
Morrisdale, PA 16858
|
- sq. feet
|
- baths - beds |
show details | |

|
#27
Forest Rd
Morrisdale, PA 16858
|
- sq. feet
|
- baths - beds |
show details | |

|
#28
Morgan Run Rd
West Decatur, PA 16878
|
- sq. feet
|
- baths - beds |
show details | |

|
#29
S High St # 2
Port Matilda, PA 16870
|
- sq. feet
|
- baths - beds |
show details | |

|
#30
David St
Houtzdale, PA 16651
|
- sq. feet
|
- baths - beds |
show details |
| Photo | Address | Area | Beds / Baths | Price | Details |
|---|---|---|---|---|---|

|
#31
Morgan Run Rd
West Decatur, PA 16878
|
- sq. feet
|
- baths - beds |
show details | |

|
#32
Meadow Ln
Morrisdale, PA 16858
|
- sq. feet
|
- baths - beds |
show details | |

|
#33
Power Rd
Morrisdale, PA 16858
|
- sq. feet
|
- baths - beds |
show details | |

|
#34
Village Rd
Clearfield, PA 16830
|
- sq. feet
|
- baths - beds |
show details | |

|
#35
W 21st St
Tyrone, PA 16686
|
- sq. feet
|
- baths - beds |
show details | |

|
#36
Bowers St
Clearfield, PA 16830
|
- sq. feet
|
- baths - beds |
show details | |

|
#37
Columbia Ave
Tyrone, PA 16686
|
- sq. feet
|
- baths - beds |
show details | |

|
#38
Old Turnpike Rd
Allport, PA 16821
|
- sq. feet
|
- baths - beds |
show details | |

|
#39
Nichols St # 1
Clearfield, PA 16830
|
- sq. feet
|
- baths - beds |
show details | |

|
#40
Morrisdale Allport Hwy
Morrisdale, PA 16858
|
- sq. feet
|
- baths - beds |
show details |
| Photo | Address | Area | Beds / Baths | Price | Details |
|---|---|---|---|---|---|

|
#41
Adams Ave
Tyrone, PA 16686
|
- sq. feet
|
- baths - beds |
show details | |

|
#42
Bald Eagle Ave
Tyrone, PA 16686
|
- sq. feet
|
- baths - beds |
show details | |

|
#43
Cambria St
Fallentimber, PA 16639
|
- sq. feet
|
- baths - beds |
show details | |

|
#44
Lincoln Ave
Tyrone, PA 16686
|
- sq. feet
|
- baths - beds |
show details | |

|
#45
Old Route 322
Philipsburg, PA 16866
|
- sq. feet
|
- baths - beds |
show details | |

|
#46
W 5th Ave
Clearfield, PA 16830
|
- sq. feet
|
- baths - beds |
show details | |

|
#47
W 1st Ave
Clearfield, PA 16830
|
- sq. feet
|
- baths - beds |
show details | |

|
#48
Winburne Munson Rd
Morrisdale, PA 16858
|
- sq. feet
|
- baths - beds |
show details | |

|
#49
Spring St
Houtzdale, PA 16651
|
- sq. feet
|
- baths - beds |
show details | |

|
Check over 1 million property listings on Foreclosure.com!
|
browse all offers | |||


Median year apartment built: 1977
Household type by relationship:
Households: 691- Male householders: 95 (17 living alone), Female householders: 204 (138 living alone)
91 spouses (91 opposite-sex spouses), 39 unmarried partners, (39 opposite-sex unmarried partners), 116 children (116 natural, 0 adopted, 0 stepchildren), 0 grandchildren, 0 brothers or sisters, 0 parents, 0 foster children, 19 other relatives, 0 non-relatives
- In group quarters: 122
Size of family households: 54 2-persons, 38 3-persons, 30 4-persons.
Size of nonfamily households: 153 1-person, 33 2-persons.
45 married couples with children.
24 single-parent households (0 men, 24 women).
100.1% of residents of North Philipsburg speak English at home.
1.0% of residents speak other Indo-European language at home (100% speak English very well).
| Here: | 4.8 |
| State: | 6.8 |
| Here: | 3.4 |
| State: | 4.3 |

- Bedrooms in owner-occupied houses and condos in North Philipsburg, Pennsylvania
- 0no bedroom
- 711 bedroom
- 22 bedrooms
- 763 bedrooms
- 74 bedrooms
- 05+ bedrooms

- Bedrooms in renter-occupied apartments in North Philipsburg, Pennsylvania
- 0no bedroom
- 991 bedroom
- 352 bedrooms
- 233 bedrooms
- 04 bedrooms
- 05+ bedrooms

- Cars and other vehicles available in North Philipsburg in owner-occupied houses/condos
- 71no vehicle
- 221 vehicle
- 502 vehicles
- 133 vehicles
- 04 vehicles
- 05+ vehicles

- Cars and other vehicles available in North Philipsburg in renter-occupied apartments
- 49no vehicle
- 531 vehicle
- 432 vehicles
- 123 vehicles
- 04 vehicles
- 05+ vehicles

- Rooms in owner-occupied houses in North Philipsburg, Pennsylvania
- 01 room
- 02 rooms
- 713 rooms
- 04 rooms
- 225 rooms
- 206 rooms
- 297 rooms
- 68 rooms
- 89+ rooms

- Rooms in renter-occupied apartments in North Philipsburg, Pennsylvania
- 01 room
- 222 rooms
- 583 rooms
- 64 rooms
- 385 rooms
- 226 rooms
- 07 rooms
- 08 rooms
- 109+ rooms


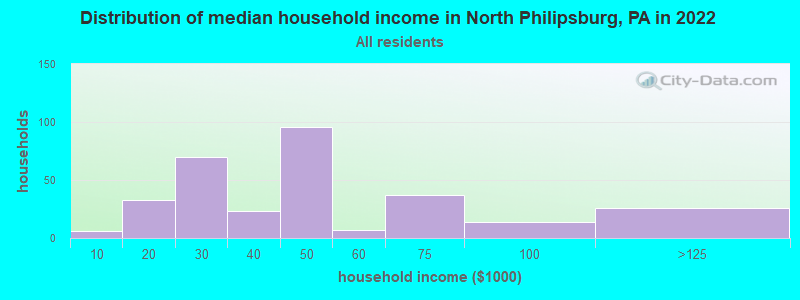
North Philipsburg, PA household income distribution

- 6Less than $10,000
- 33$10,000 to $19,999
- 70$20,000 to $29,999
- 23$30,000 to $39,999
- 96$40,000 to $49,999
- 7$50,000 to $59,999
- 37$60,000 to $74,999
- 14$75,000 to $99,999
- 26$100,000 to $124,999
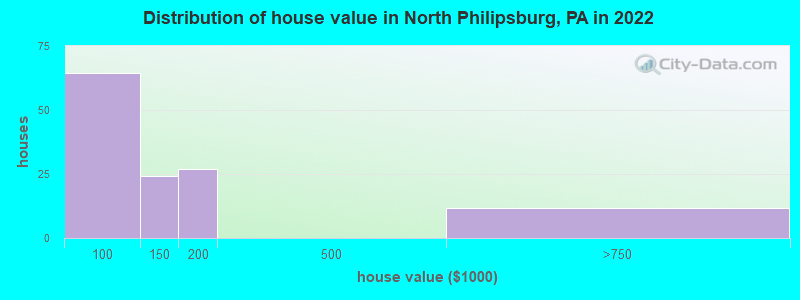
Home value of owner - occupied houses in 2022 in North Philipsburg, PA
-
- 7$50,000 to $59,999
- 48$80,000 to $89,999
- 7$90,000 to $99,999
- 21$100,000 to $124,999
- 2$125,000 to $149,999
- 22$150,000 to $174,999
- 4$175,000 to $199,999
- 11$500,000 to $749,999
Rent paid by renters in 2022 in North Philipsburg, PA
-
- 52$200 to $249
- 22$450 to $499
- 50$550 to $599
- 10$600 to $649
- 5$700 to $749
- 39$750 to $799
- 6$900 to $999
- 18$1,000 to $1,249
- 11$1,500 to $1,999
- 9No cash rent


Percentage of workers working in this county: 64.2%
Number of people working at home: 0 (0.0% of all workers)
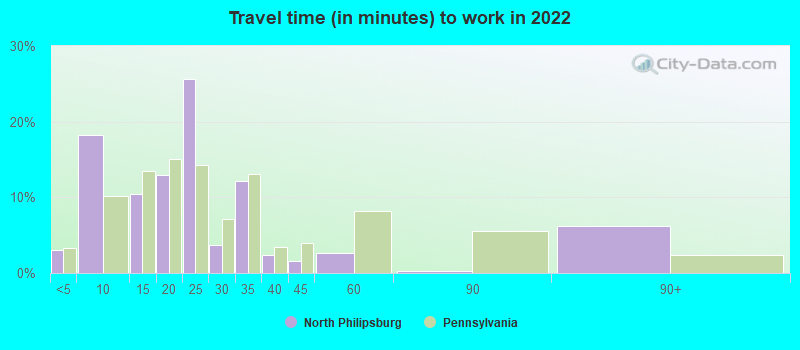
Travel time to work (commute)
- Less than 5 minutes: 13
- 5 to 9 minutes: 63
- 10 to 14 minutes: 0
- 15 to 19 minutes: 21
- 20 to 24 minutes: 6
- 25 to 29 minutes: 6
- 30 to 34 minutes: 36
- 35 to 39 minutes: 4
- 40 to 44 minutes: 0
- 45 to 59 minutes: 12
- 60 to 89 minutes: 0
- 90 or more minutes: 0
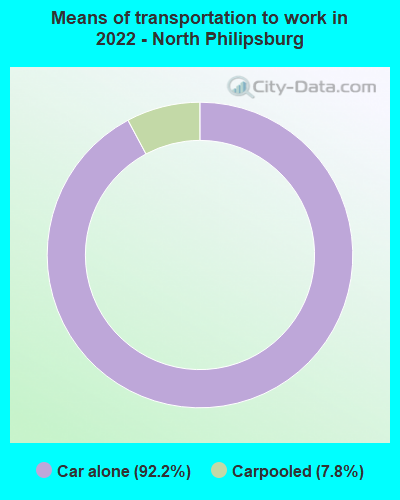
Means of transportation to work:
- Drove a car alone: 389 (91.7%)
- Carpooled: 29 (6.8%)

- Unemployment by race in 2022
- Unemployment rate for White non-Hispanic residents
- 35.1%Males
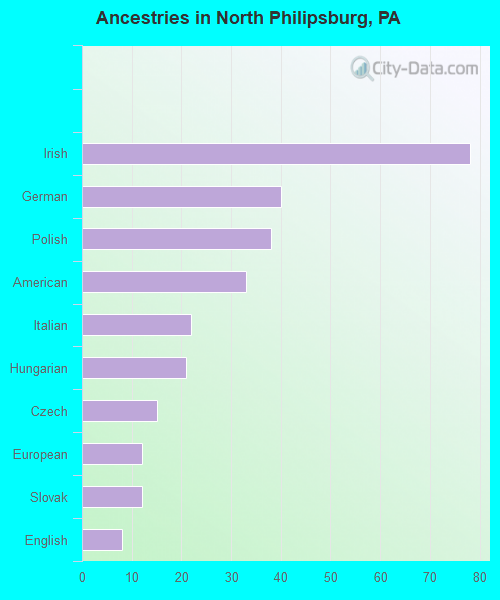
First ancestries reported:
- Irish: 78 (25.6%)
- German: 40 (13.1%)
- Polish: 38 (12.5%)
- American: 33 (10.8%)
- Italian: 22 (7.2%)
- Hungarian: 21 (6.9%)
- Czech: 15 (4.9%)
- European: 12 (3.9%)
- Slovak: 12 (3.9%)
- English: 8 (2.6%)
Place of birth for U.S.-born residents:
- This state: 605
- Other state: 74
- Northeast: 38
- Midwest: 14
- South: 20
- West: 0
82.1% of North Philipsburg residents lived in the same house 1 years ago.
Out of people who lived in different houses, 34.3% lived in this county.
Out of people who lived in different counties, 100.0% lived in Pennsylvania.
| North Philipsburg: | 82.1% |
| State average: | 89.3% |
Education attainment for males 25 years and older:
- No schooling: 0
- Nursery to 4th grade: 0
- 5th and 6th grade: 0
- 7th and 8th grade: 6
- 9th grade: 0
- 10th grade: 0
- 11th grade: 0
- 12th grade, no diploma: 19
- High school graduate (or equivalency): 83
- Less than 1 year of college: 14
- Some college more than 1 year, no degree: 11
- Associate degree: 27
- Bachelor's degree: 37
- Master's degree: 0
- Professional school degree: 0
- Doctorate degree: 0

Education attainment for females 25 years and older:
- No schooling: 0
- Nursery to 4th grade: 0
- 5th and 6th grade: 0
- 7th and 8th grade: 4
- 9th grade: 0
- 10th grade: 0
- 11th grade: 0
- 12th grade, no diploma: 21
- High school graduate (or equivalency): 209
- Less than 1 year of college: 6
- Some college more than 1 year, no degree: 36
- Associate degree: 30
- Bachelor's degree: 94
- Master's degree: 12
- Professional school degree: 0
- Doctorate degree: 0


Housing units in structures:
- One, detached: 212
- 10 to 19: 31
- 20 to 49: 57
- 50 or more: 6
- Mobile homes: 34
Housing units lacking complete kitchen facilities in 2022: 6.2%
House/condo owner moved in on average 32 years ago
Renter moved in on average 4 years ago

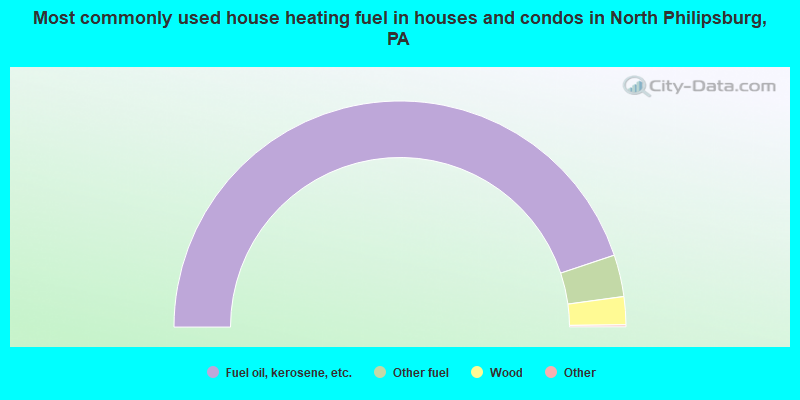
- 90.0%Fuel oil, kerosene, etc.
- 6.0%Other fuel
- 4.0%Wood
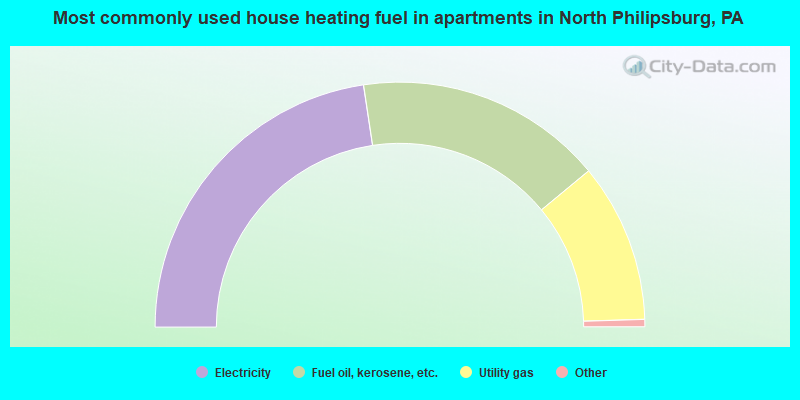
- 45.7%Electricity
- 33.1%Fuel oil, kerosene, etc.
- 21.2%Utility gas
| Here: | 0.0% |
| Pennsylvania: | 13.4% |
| Here: | 0.0% |
| Pennsylvania: | 39.8% |


