Median price asked for vacant for-sale houses and condos in 2022 in this county: $406,754.
Median contract rent in 2022: over $2,000 (lower quartile is $1,354, upper quartile is over $2,000)
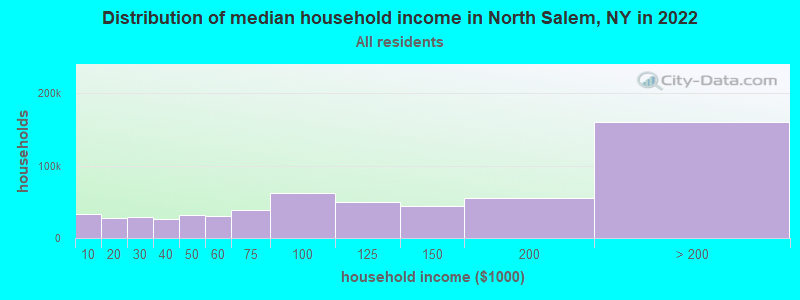
Median gross rent in North Salem, NY in 2022: over $2,000
Housing units in North Salem with a mortgage: 971 (68 second mortgage, 195 home equity loan, 0 both second mortgage and home equity loan) Houses without a mortgage: 362
Compare current foreclosures near North Salem, NY:
In family households: 787,571 (154,325 male householders, 82,094 female householders)
177,077 spouses, 289,201 children (277,229 natural, 5,836 adopted, 6,136 stepchildren), 13,465 grandchildren, 12,621 brothers or sisters, 11,677 parents, foster children, 16,923 other relatives, 23,097 non-relatives
In nonfamily households: 132,838 (45,065 male householders (36,259 living alone)), 65,748 female householders (58,355 living alone)), 22,025 nonrelatives
In group quarters: 28,704 (13,258 institutionalized population)
167,242 married couples with children.
43,170 single-parent households (7,022 men, 36,148 women).
87.1% of residents of North Salem speak English at home.
3.4% of residents speak Spanish at home (71% speak English very well, 14% speak English well, 14% speak English not well, 2% don't speak English at all).
6.6% of residents speak other Indo-European language at home (72% speak English very well, 16% speak English well, 10% speak English not well, 2% don't speak English at all).
2.2% of residents speak Asian or Pacific Island language at home (16% speak English very well, 74% speak English well, 10% speak English not well).
0.7% of residents speak other language at home (100% speak English very well).
Foreign born population: 646 (11.6%)
(68.0% of them are naturalized citizens)
Year of entry for the foreign-born population in North Salem, New York
481995 to March 2000
651990 to 1994
781985 to 1989
711980 to 1984
451975 to 1979
801970 to 1974
311965 to 1969
103Before 1965
First ancestries reported:
Irish: 1,385 (21.5%)
Italian: 1,300 (20.2%)
Other: 1,015 (15.8%)
German: 842 (13.1%)
English: 454 (7.1%)
French: 171 (2.7%)
Russian: 160 (2.5%)
Polish: 155 (2.4%)
Scottish: 152 (2.4%)
United States: 108 (1.7%)
Dutch: 79 (1.2%)
Ukrainian: 66 (1.0%)
French Canadian: 58 (0.9%)
Hungarian: 56 (0.9%)
Swedish: 56 (0.9%)
Swiss: 48 (0.7%)
Norwegian: 47 (0.7%)
Slovak: 47 (0.7%)
Scotch-Irish: 46 (0.7%)
Welsh: 42 (0.7%)
Arab: 34 (0.5%)
West Indian: 32 (0.5%)
Czech: 24 (0.4%)
Portuguese: 24 (0.4%)
Lithuanian: 14 (0.2%)
Greek: 12 (0.2%)
Most common places of birth for foreign-born residents (%):
United Kingdom
North Salem:
14.4% (75)
New York:
1.6% (62,237)
Ireland
North Salem:
10.6% (55)
New York:
1.1% (41,934)
Italy
North Salem:
6.7% (35)
New York:
3.8% (147,729)
India
North Salem:
5.0% (26)
New York:
3.0% (117,238)
Colombia
North Salem:
4.6% (24)
New York:
2.9% (111,727)
Guatemala
North Salem:
4.4% (23)
New York:
0.9% (33,208)
Other Eastern Europe
North Salem:
4.2% (22)
New York:
1.4% (53,825)
Canada
North Salem:
4.2% (22)
New York:
1.4% (54,876)
Japan
North Salem:
3.8% (20)
New York:
0.8% (32,034)
Germany
North Salem:
3.6% (19)
New York:
1.8% (69,327)
Jamaica
North Salem:
3.6% (19)
New York:
5.9% (226,470)
Spain
North Salem:
3.5% (18)
New York:
0.3% (11,866)
Australia
North Salem:
3.5% (18)
New York:
0.2% (5,813)
Peru
North Salem:
2.7% (14)
New York:
1.1% (43,753)
Iraq
North Salem:
2.3% (12)
New York:
0.1% (2,721)
Sweden
North Salem:
2.1% (11)
New York:
0.1% (4,305)
Other Northern Europe
North Salem:
2.1% (11)
New York:
0.2% (7,839)
Netherlands
North Salem:
1.9% (10)
New York:
0.2% (6,545)
China, excluding Hong Kong and Taiwan
North Salem:
1.9% (10)
New York:
6.0% (233,766)
Philippines
North Salem:
1.7% (9)
New York:
1.9% (72,408)
Dominican Republic
North Salem:
1.5% (8)
New York:
10.5% (408,086)
Place of birth for U.S.-born residents:
This state: 3,709
Other state: 911
Northeast: 544
Midwest: 220
South: 75
West: 72
59% of North Salem residents lived in the same house 5 years ago. Out of people who lived in different houses, 54% lived in this county. Out of people who lived in different counties, 74% lived in New York.
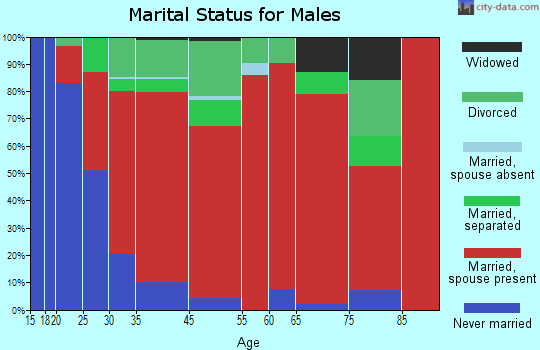
Education attainment for males 25 years and older:
No schooling: 5
Nursery to 4th grade: 0
5th and 6th grade: 0
7th and 8th grade: 41
9th grade: 5
10th grade: 5
11th grade: 9
12th grade, no diploma: 48
High school graduate (or equivalency): 268
Less than 1 year of college: 66
Some college more than 1 year, no degree: 214
Associate degree: 134
Bachelor's degree: 477
Master's degree: 228
Professional school degree: 135
Doctorate degree: 65
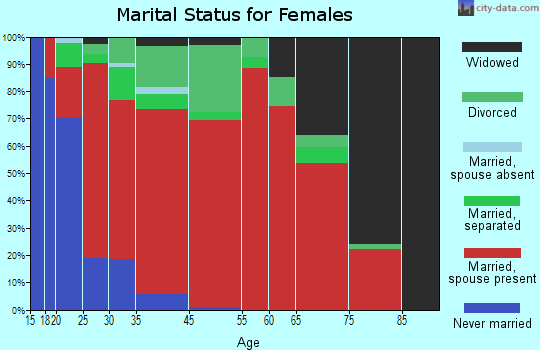
Education attainment for females 25 years and older:
No schooling: 28
Nursery to 4th grade: 0
5th and 6th grade: 19
7th and 8th grade: 32
9th grade: 27
10th grade: 11
11th grade: 6
12th grade, no diploma: 14
High school graduate (or equivalency): 421
Less than 1 year of college: 119
Some college more than 1 year, no degree: 271
Associate degree: 121
Bachelor's degree: 471
Master's degree: 294
Professional school degree: 55
Doctorate degree: 31
Housing units in structures:
One, detached: 1,836
One, attached: 30
Two: 95
3 or 4: 10
5 to 9: 8
Housing units lacking complete plumbing facilities: 1.0%
Housing units lacking complete kitchen facilities: 0.6%