Median price asked for vacant for-sale houses and condos in 2022 in this county: $350,177.
Median contract rent in 2022: $1,435 (lower quartile is $1,117, upper quartile is $1,798)
Median rent asked for vacant for-rent units in 2022: $1,385
Median gross rent in North Valleys, NV in 2022: $1,599
Housing units in North Valleys with a mortgage: 6,012 (930 second mortgage, 677 home equity loan, 35 both second mortgage and home equity loan) Houses without a mortgage: 522
Compare current foreclosures near North Valleys, NV:
In family households: 333,280 (72,131 male householders, 30,637 female householders)
74,494 spouses, 114,518 children (105,670 natural, 2,626 adopted, 6,222 stepchildren), 8,423 grandchildren, 5,233 brothers or sisters, 4,625 parents, foster children, 6,388 other relatives, 13,408 non-relatives
In nonfamily households: 82,855 (32,101 male householders (22,736 living alone)), 28,576 female householders (21,733 living alone)), 22,178 nonrelatives
In group quarters: 5,272 (2,106 institutionalized population)
55,429 married couples with children.
20,124 single-parent households (5,984 men, 14,140 women).
86.8% of residents of North Valleys speak English at home.
8.4% of residents speak Spanish at home (59% speak English very well, 23% speak English well, 14% speak English not well, 4% don't speak English at all).
1.8% of residents speak other Indo-European language at home (67% speak English very well, 24% speak English well, 7% speak English not well, 2% don't speak English at all).
2.6% of residents speak Asian or Pacific Island language at home (58% speak English very well, 33% speak English well, 9% speak English not well).
0.4% of residents speak other language at home (95% speak English very well, 5% speak English well).
Foreign born population: 3,741 (7.5%)
(50.6% of them are naturalized citizens)
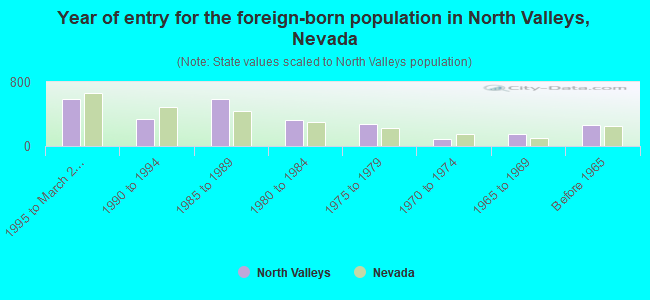
Year of entry for the foreign-born population in North Valleys, Nevada
5821995 to March 2000
3341990 to 1994
5881985 to 1989
3201980 to 1984
2811975 to 1979
921970 to 1974
1441965 to 1969
267Before 1965
Most common places of birth for foreign-born residents (%):
Mexico
North Valleys:
39.8% (1,037)
Nevada:
48.6% (153,946)
Philippines
North Valleys:
18.6% (486)
Nevada:
9.9% (31,491)
El Salvador
North Valleys:
6.0% (157)
Nevada:
3.8% (12,080)
Canada
North Valleys:
4.5% (117)
Nevada:
3.4% (10,690)
Germany
North Valleys:
2.6% (69)
Nevada:
2.1% (6,621)
Iran
North Valleys:
2.2% (58)
Nevada:
0.7% (2,148)
China, excluding Hong Kong and Taiwan
North Valleys:
2.2% (58)
Nevada:
1.6% (5,210)
Micronesia
North Valleys:
1.8% (48)
Nevada:
0.1% (243)
Korea
North Valleys:
1.6% (42)
Nevada:
1.9% (6,071)
Bangladesh
North Valleys:
1.6% (42)
Nevada:
0.1% (245)
Place of birth for U.S.-born residents:
This state: 9,657
Other state: 21,366
Northeast: 2,140
Midwest: 3,547
South: 2,788
West: 12,891
46% of North Valleys residents lived in the same house 5 years ago. Out of people who lived in different houses, 62% lived in this county. Out of people who lived in different counties, 15% lived in Nevada.
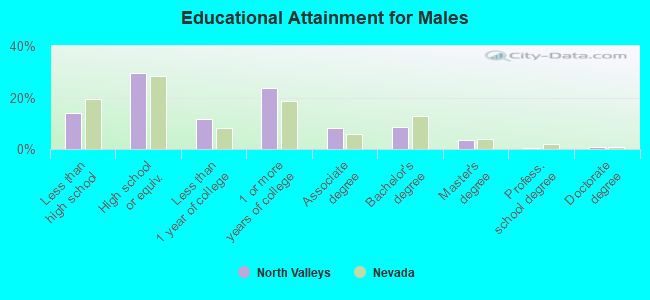
Education attainment for males 25 years and older:
No schooling: 83
Nursery to 4th grade: 8
5th and 6th grade: 125
7th and 8th grade: 98
9th grade: 212
10th grade: 217
11th grade: 295
12th grade, no diploma: 483
High school graduate (or equivalency): 3,207
Less than 1 year of college: 1,259
Some college more than 1 year, no degree: 2,601
Associate degree: 901
Bachelor's degree: 930
Master's degree: 377
Professional school degree: 22
Doctorate degree: 81
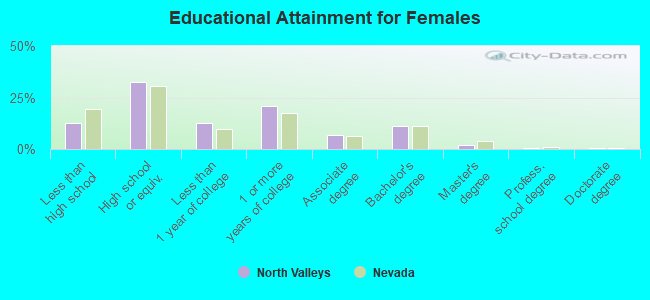
Education attainment for females 25 years and older:
No schooling: 44
Nursery to 4th grade: 0
5th and 6th grade: 78
7th and 8th grade: 135
9th grade: 177
10th grade: 166
11th grade: 308
12th grade, no diploma: 419
High school graduate (or equivalency): 3,398
Less than 1 year of college: 1,322
Some college more than 1 year, no degree: 2,164
Associate degree: 725
Bachelor's degree: 1,147
Master's degree: 205
Professional school degree: 70
Doctorate degree: 75
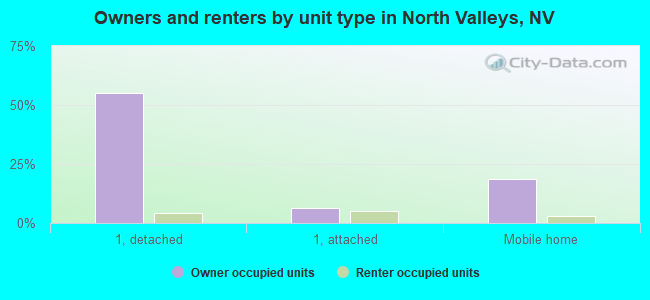
Housing units in structures:
One, detached: 7,108
One, attached: 1,344
Two: 295
3 or 4: 106
5 to 9: 254
10 to 19: 52
20 to 49: 43
50 or more: 114
Mobile homes: 2,768
Boats, RVs, vans, etc.: 43
Median worth of mobile homes: $133,539
Housing units lacking complete plumbing facilities: 0.4%
Housing units lacking complete kitchen facilities: 0.4%