Oak Lawn, IL (Illinois) Houses and Residents
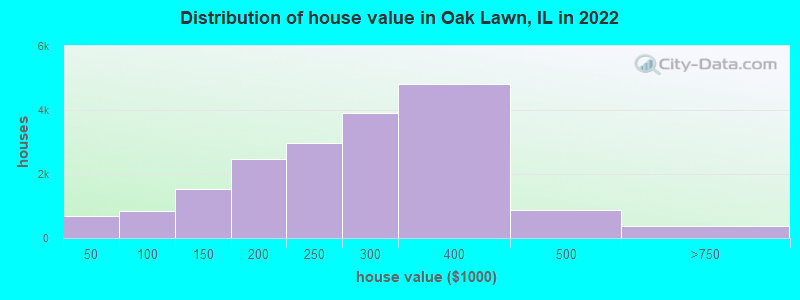
Estimated median house or condo value in 2022: $257,478 (it was $147,600 in 2000 )
Oak Lawn:
$257,478Illinois:
$251,600
Lower value quartile - upper value quartile: $179,367 - $324,548Mean price in 2022: Detached houses: $279,867 Here:
$279,867State:
$310,164
Townhouses or other attached units: $203,847 Here:
$203,847State:
$286,230
In 2-unit structures: $177,866 Here:
$177,866State:
$299,638
In 3-to-4-unit structures: $152,508 Here:
$152,508State:
$330,907
In 5-or-more-unit structures: $108,596 Here:
$108,596State:
$318,887
Mobile homes: $33,095 Here:
$33,095State:
$78,855
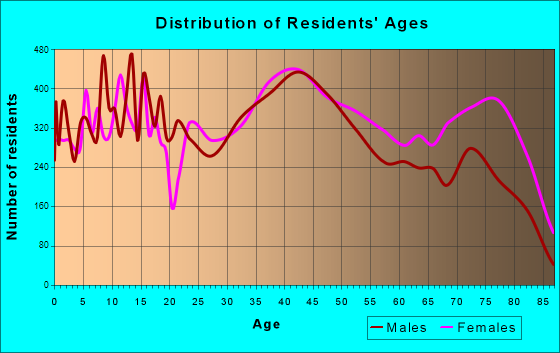
Total population: 57,034 (Urban population: 55,391, Rural population: 0)
Houses: 23,305 (22,077 occupied: 18,379 owner occupied, 4,075 renter occupied )
% of renters here:
18%State:
33%
Housing density: 2,711 houses/condos per square mile
Median price asked for vacant for-sale houses and condos in 2022: $126,679.
Median contract rent in 2022: $1,158 (lower quartile is $1,001, upper quartile is $1,436)
Median rent asked for vacant for-rent units in 2022: $1,217
Median gross rent in Oak Lawn, IL in 2022: $1,279
Housing units in Oak Lawn with a mortgage: 10,732 (962 second mortgage, 25 home equity loan, 526 both second mortgage and home equity loan )Houses without a mortgage: 289
Median household income for houses/condos with a mortgage: $93,398
Median household income for apartments without a mortgage: $68,286
Median monthly housing costs: $1,285
Data:
Median house or condo value ($)
Median house or condo value ($ change since 2000)
Median house or condo value ($) - White
Median house or condo value ($) - Black or African American
Median house or condo value ($) - Asian
Median house or condo value ($) - Hispanic or Latino
Median house or condo value ($) - American Indian and Alaska Native
Median house or condo value ($) - Multirace
Median house or condo value ($) - Other Race
Median price asked for mobile homes ($)
Household density (households per square mile)
Mean house or condo value by units in structure - 1, detached ($)
Mean house or condo value by units in structure - 1, attached ($)
Mean house or condo value by units in structure - 2 ($)
Mean house or condo value by units in structure by units in structure - 3 or 4 ($)
Mean house or condo value by units in structure - 5 or more ($)
Mean house or condo value by units in structure - Boat, RV, van, etc. ($)
Mean house or condo value by units in structure - Mobile home ($)
Median contract rent ($)
Median contract rent - Lower quartile ($)
Median contract rent - Upper quartile ($)
Median gross rent ($)
Urban houses (%)
Rural houses (%)
Houses occupied (%)
Houses occupied (% change since 2000)
Houses owner occupied (%)
Houses owner occupied (% change since 2000)
Houses renter occupied (%)
Houses renter occupied (% change since 2000)
Vacant housing units - For rent (%)
Vacant housing units - For rent (% change since 2000)
Vacant housing units - For sale only (%)
Vacant housing units - For sale only (% change since 2000)
Vacant housing units - Rented or sold, not occupied (%)
Vacant housing units - Rented or sold, not occupied (% change since 2000)
Vacant housing units - For seasonal, recreational, or occasional use (%)
Vacant housing units - For seasonal, recreational, or occasional use (% change since 2000)
Vacant housing units - For migrant workers (%)
Vacant housing units - For migrant workers (% change since 2000)
Vacant housing units - Other vacant (%)
Vacant housing units - Other vacant (% change since 2000)
Median monthly housing costs ($)
Median household income for houses/condos with a mortgage ($)
Median household income for houses/condos without a mortgage ($)
Median household income ($)
Median household income ($) - White
Median household income ($) - Black or African American
Median household income ($) - Asian
Median household income ($) - Hispanic or Latino
Median household income ($) - American Indian and Alaska Native
Median household income ($) - Multirace
Median household income ($) - Other Race
Mortgage status - with mortgage (%)
Mortgage status - with second mortgage (%)
Mortgage status - with home equity loan (%)
Mortgage status - with both second mortgage and home equity loan (%)
Mortgage status - without a mortgage (%)
Median year house/condo built
Median year apartment built
Household type by relationship - Male householder living alone (%)
Household type by relationship - Male householder not living alone (%)
Household type by relationship - Female householder living alone (%)
Household type by relationship - Female householder not living alone (%)
Household type by relationship - Opposite-Sex spouse (%)
Household type by relationship - Same-Sex spouse (%)
Household type by relationship - Opposite-Sex unmarried partner (%)
Household type by relationship - Same-Sex unmarried partner (%)
Household type by relationship - In group quarters (%)
Size of family households - 2-person household (%)
Size of family households - 3-person household (%)
Size of family households - 4-person household (%)
Size of family households - 5-person household (%)
Size of family households - 6-person household (%)
Size of family households - 7-or-more-person household (%)
Size of nonfamily households - 1-person household (%)
Size of nonfamily households - 2-person household (%)
Size of nonfamily households - 3-person household (%)
Size of nonfamily households - 4-person household (%)
Size of nonfamily households - 5-person household (%)
Size of nonfamily households - 6-person household (%)
Size of nonfamily households - 7-or-moreperson household (%)
Year house built - Built 2010 or later (%)
Year house built - Built 2000 to 2009 (%)
Year house built - Built 1990 to 1999 (%)
Year house built - Built 1980 to 1989 (%)
Year house built - Built 1970 to 1979 (%)
Year house built - Built 1960 to 1969 (%)
Year house built - Built 1950 to 1959 (%)
Year house built - Built 1940 to 1949 (%)
Year house built - Built 1939 or earlier (%)
Median number of rooms in houses and condos
Median number of rooms in apartments
Median number of bedrooms in owner occupied houses
Mean number of bedrooms in owner occupied houses
Median number of bedrooms in renter occupied houses
Mean number of bedrooms in renter occupied houses
Median number of vehichles in owner occupied houses
Mean number of vehichles in owner occupied houses
Median number of vehichles in renter occupied houses
Mean number of vehichles in renter occupied houses
Rooms in owner-occupied houses - 1 room (%)
Rooms in owner-occupied houses - 2 rooms (%)
Rooms in owner-occupied houses - 3 rooms (%)
Rooms in owner-occupied houses - 4 rooms (%)
Rooms in owner-occupied houses - 5 rooms (%)
Rooms in owner-occupied houses - 6 rooms (%)
Rooms in owner-occupied houses - 7 rooms (%)
Rooms in owner-occupied houses - 8 rooms (%)
Rooms in owner-occupied houses - 9+ rooms (%)
Rooms in renter-occupied houses - 1 room (%)
Rooms in renter-occupied houses - 2 rooms (%)
Rooms in renter-occupied houses - 3 rooms (%)
Rooms in renter-occupied houses - 4 rooms (%)
Rooms in renter-occupied houses - 5 rooms (%)
Rooms in renter-occupied houses - 6 rooms (%)
Rooms in renter-occupied houses - 7 rooms (%)
Rooms in renter-occupied houses - 8 rooms (%)
Rooms in renter-occupied houses - 9+ rooms (%)
Bedrooms in owner-occupied houses - no bedrooms (%)
Bedrooms in owner-occupied houses - 1 bedroom (%)
Bedrooms in owner-occupied houses - 2 bedrooms (%)
Bedrooms in owner-occupied houses - 3 bedrooms (%)
Bedrooms in owner-occupied houses - 4 bedrooms (%)
Bedrooms in owner-occupied houses - 5+ bedrooms (%)
Bedrooms in renter-occupied houses - no bedrooms (%)
Bedrooms in renter-occupied houses - 1 bedroom (%)
Bedrooms in renter-occupied houses - 2 bedrooms (%)
Bedrooms in renter-occupied houses - 3 bedrooms (%)
Bedrooms in renter-occupied houses - 4 bedrooms (%)
Bedrooms in renter-occupied houses - 5+ bedrooms (%)
Vehicles available in owner-occupied houses - no vehicle available (%)
Vehicles available in owner-occupied houses - 1 vehicle available(%)
Vehicles available in owner-occupied houses - 2 Vehicles available (%)
Vehicles available in owner-occupied houses - 3 Vehicles available (%)
Vehicles available in owner-occupied houses - 4 Vehicles available (%)
Vehicles available in owner-occupied houses - 5+ Vehicles available (%)
Vehicles available in renter-occupied houses - no vehicle available (%)
Vehicles available in renter-occupied houses - 1 vehicle available (%)
Vehicles available in renter-occupied houses - 2 Vehicles available (%)
Vehicles available in renter-occupied houses - 3 Vehicles available (%)
Vehicles available in renter-occupied houses - 4 Vehicles available (%)
Vehicles available in renter-occupied houses - 5+ Vehicles available (%)
Housing units in structures - 1, detached (%)
Housing units in structures - 1, attached (%)
Housing units in structures - 2 (%)
Housing units in structures - 3 or 4 (%)
Housing units in structures - 5 to 9 (%)
Housing units in structures - 10 to 19 (%)
Housing units in structures - 20 to 49 (%)
Housing units in structures - 50 or more (%)
Housing units in structures - Mobile home (%)
Housing units in structures - Boat, RV, van, etc. (%)
Housing units in structures - Owners - 1, detached (%)
Housing units in structures - Owners - 1, attached (%)
Housing units in structures - Owners - 2 (%)
Housing units in structures - Owners - 3 or 4 (%)
Housing units in structures - Owners - 5 to 9 (%)
Housing units in structures - Owners - 10 to 19 (%)
Housing units in structures - Owners - 20 to 49 (%)
Housing units in structures - Owners - 50 or more (%)
Housing units in structures - Owners - Mobile home (%)
Housing units in structures - Owners - Boat, RV, van, etc. (%)
Housing units in structures - Renters - 1, detached (%)
Housing units in structures - Renters - 1, attached (%)
Housing units in structures - Renters - 2 (%)
Housing units in structures - Renters - 3 or 4 (%)
Housing units in structures - Renters - 5 to 9 (%)
Housing units in structures - Renters - 10 to 19 (%)
Housing units in structures - Renters - 20 to 49 (%)
Housing units in structures - Renters - 50 or more (%)
Housing units in structures - Renters - Mobile home (%)
Housing units in structures - Renters - Boat, RV, van, etc. (%)
House/condo owner moved in on average (years ago)
Renter moved in on average (years ago)
Year householder moved into unit - Moved in 1999 to March 2000 (%)
Year householder moved into unit - Moved in 1999 to March 2000 (%) - White
Year householder moved into unit - Moved in 1999 to March 2000 (%) - Black or African American
Year householder moved into unit - Moved in 1999 to March 2000 (%) - Asian
Year householder moved into unit - Moved in 1999 to March 2000 (%) - Hispanic or Latino
Year householder moved into unit - Moved in 1999 to March 2000 (%) - American Indian and Alaska Native
Year householder moved into unit - Moved in 1999 to March 2000 (%) - Multirace
Year householder moved into unit - Moved in 1999 to March 2000 (%) - Other Race
Year householder moved into unit - Moved in 1995 to 1998 (%)
Year householder moved into unit - Moved in 1995 to 1998 (%) - White
Year householder moved into unit - Moved in 1995 to 1998 (%) - Black or African American
Year householder moved into unit - Moved in 1995 to 1998 (%) - Asian
Year householder moved into unit - Moved in 1995 to 1998 (%) - Hispanic or Latino
Year householder moved into unit - Moved in 1995 to 1998 (%) - American Indian and Alaska Native
Year householder moved into unit - Moved in 1995 to 1998 (%) - Multirace
Year householder moved into unit - Moved in 1995 to 1998 (%) - Other Race
Year householder moved into unit - Moved in 1990 to 1994 (%)
Year householder moved into unit - Moved in 1990 to 1994 (%) - White
Year householder moved into unit - Moved in 1990 to 1994 (%) - Black or African American
Year householder moved into unit - Moved in 1990 to 1994 (%) - Asian
Year householder moved into unit - Moved in 1990 to 1994 (%) - Hispanic or Latino
Year householder moved into unit - Moved in 1990 to 1994 (%) - American Indian and Alaska Native
Year householder moved into unit - Moved in 1990 to 1994 (%) - Multirace
Year householder moved into unit - Moved in 1990 to 1994 (%) - Other Race
Year householder moved into unit - Moved in 1980 to 1989 (%)
Year householder moved into unit - Moved in 1980 to 1989 (%) - White
Year householder moved into unit - Moved in 1980 to 1989 (%) - Black or African American
Year householder moved into unit - Moved in 1980 to 1989 (%) - Asian
Year householder moved into unit - Moved in 1980 to 1989 (%) - Hispanic or Latino
Year householder moved into unit - Moved in 1980 to 1989 (%) - American Indian and Alaska Native
Year householder moved into unit - Moved in 1980 to 1989 (%) - Multirace
Year householder moved into unit - Moved in 1980 to 1989 (%) - Other Race
Year householder moved into unit - Moved in 1970 to 1979 (%)
Year householder moved into unit - Moved in 1970 to 1979 (%) - White
Year householder moved into unit - Moved in 1970 to 1979 (%) - Black or African American
Year householder moved into unit - Moved in 1970 to 1979 (%) - Asian
Year householder moved into unit - Moved in 1970 to 1979 (%) - Hispanic or Latino
Year householder moved into unit - Moved in 1970 to 1979 (%) - American Indian and Alaska Native
Year householder moved into unit - Moved in 1970 to 1979 (%) - Multirace
Year householder moved into unit - Moved in 1970 to 1979 (%) - Other Race
Year householder moved into unit - Moved in 1969 or earlier (%)
Year householder moved into unit - Moved in 1969 or earlier (%) - White
Year householder moved into unit - Moved in 1969 or earlier (%) - Black or African American
Year householder moved into unit - Moved in 1969 or earlier (%) - Asian
Year householder moved into unit - Moved in 1969 or earlier (%) - Hispanic or Latino
Year householder moved into unit - Moved in 1969 or earlier (%) - American Indian and Alaska Native
Year householder moved into unit - Moved in 1969 or earlier (%) - Multirace
Year householder moved into unit - Moved in 1969 or earlier (%) - Other Race
Housing units lacking complete plumbing facilities (%)
Housing units lacking complete kitchen facilities (%)
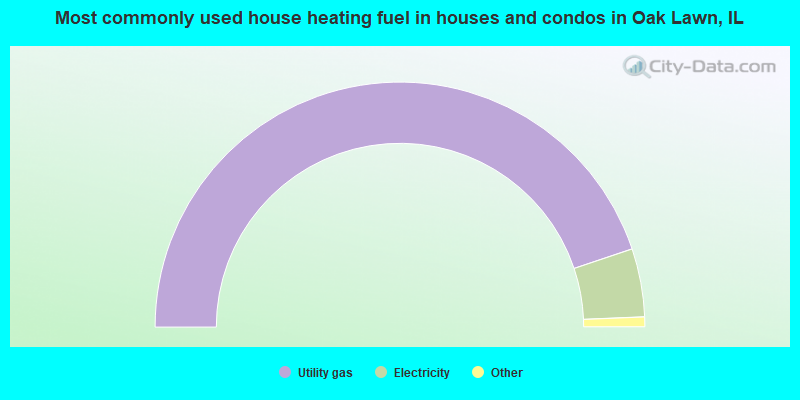
House heating fuel used in houses and condos - Utility gas (%)
House heating fuel used in houses and condos - Bottled, tank, or LP gas (%)
House heating fuel used in houses and condos - Electricity (%)
House heating fuel used in houses and condos - Fuel oil, kerosene, etc. (%)
House heating fuel used in houses and condos - Coal or coke (%)
House heating fuel used in houses and condos - Wood (%)
House heating fuel used in houses and condos - Solar energy (%)
House heating fuel used in houses and condos - Other fuel (%)
House heating fuel used in houses and condos - No fuel used (%)
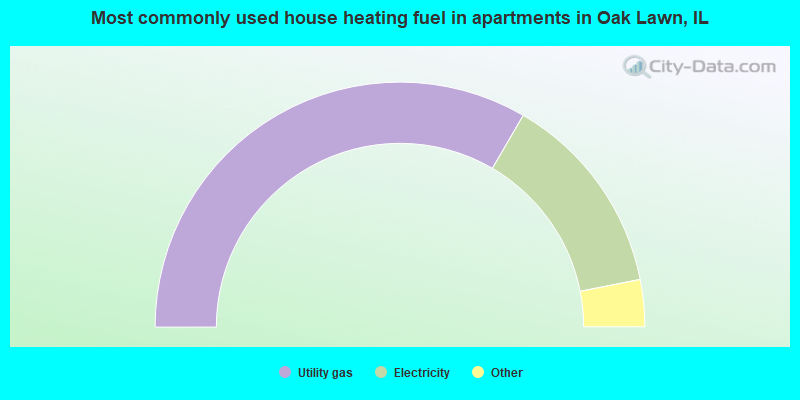
House heating fuel used in apartments - Utility gas (%)
House heating fuel used in apartments - Bottled, tank, or LP gas (%)
House heating fuel used in apartments - Electricity (%)
House heating fuel used in apartments - Fuel oil, kerosene, etc. (%)
House heating fuel used in apartments - Coal or coke (%)
House heating fuel used in apartments - Wood (%)
House heating fuel used in apartments - Solar energy (%)
House heating fuel used in apartments - Other fuel (%)
House heating fuel used in apartments - No fuel used (%)
Median year house/condo built: 1966Median year apartment built: 1976Household type by relationship:
Households: 56,384
Male householders: 10,627 (3,046 living alone ), Female householders: 10,868 (3,739 living alone )10,103 spouses (10,058 opposite-sex spouses ), 1,046 unmarried partners , (1,031 opposite-sex unmarried partners ), 17,890 children (17,047 natural , 396 adopted , 446 stepchildren ), 1,588 grandchildren , 948 brothers or sisters , 1,016 parents , 19 foster children , 712 other relatives , 1,114 non-relatives In group quarters: 446
Size of family households: 5,416 2-persons , 3,633 3-persons , 2,578 4-persons , 1,619 5-persons , 521 6-persons , 427 7-or-more-persons .
Size of nonfamily households: 7,289 1-person , 801 2-persons , 21 3-persons , 8 4-persons , 9 5-persons .
8,332 married couples with children. single-parent households (672 men , 1,381 women ).
70.5% of residents of Oak Lawn speak English at home. of residents speak Spanish at home (69% speak English very well , 14% speak English well , 14% speak English not well , 3% don't speak English at all ).of residents speak other Indo-European language at home (51% speak English very well , 23% speak English well , 22% speak English not well , 4% don't speak English at all ).of residents speak Asian or Pacific Island language at home (65% speak English very well , 19% speak English well , 16% speak English not well ).of residents speak other language at home (59% speak English very well , 27% speak English well , 9% speak English not well , 4% don't speak English at all ).
Foreign born population: 9,407 (16.7%)of them are naturalized citizens )
Median number of rooms in houses and condos:
Median number of rooms in apartments
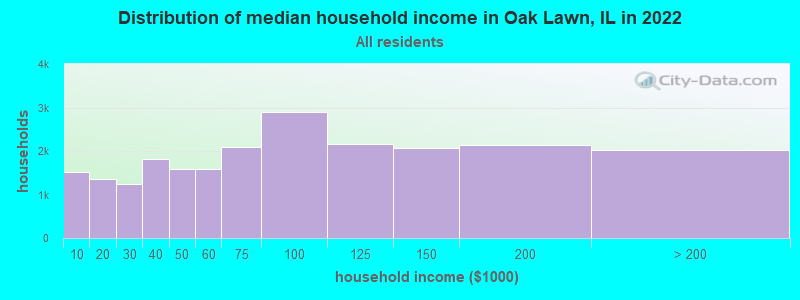
Oak Lawn, IL household income distribution 1,509 Less than $10,0001,354 $10,000 to $19,9991,244 $20,000 to $29,9991,808 $30,000 to $39,9991,582 $40,000 to $49,9991,582 $50,000 to $59,9992,082 $60,000 to $74,9992,886 $75,000 to $99,9992,169 $100,000 to $124,9992,064 $125,000 to $149,9992,139 $150,000 to $199,9992,029 $200,000 or more
Home value of owner - occupied houses in 2022 in Oak Lawn, IL 155 Less than $10,00047 $10,000 to $14,999131 $15,000 to $19,999107 $20,000 to $24,999124 $25,000 to $29,99944 $30,000 to $34,99925 $35,000 to $39,99942 $40,000 to $49,99937 $50,000 to $59,999190 $60,000 to $69,999152 $70,000 to $79,999131 $80,000 to $89,999303 $90,000 to $99,9991,113 $100,000 to $124,999414 $125,000 to $149,9991,477 $150,000 to $174,999995 $175,000 to $199,9992,958 $200,000 to $249,9993,908 $250,000 to $299,9994,808 $300,000 to $399,999863 $400,000 to $499,999336 $500,000 to $749,99916 $750,000 to $999,99930 $1,000,000 to $1,499,9994 $1,500,000 to $1,999,999Rent paid by renters in 2022 in Oak Lawn, IL 55 Less than $10011 $250 to $29918 $350 to $39914 $450 to $499122 $500 to $54932 $600 to $64995 $650 to $69920 $750 to $799195 $800 to $899391 $900 to $9991,575 $1,000 to $1,249600 $1,250 to $1,499510 $1,500 to $1,999322 $2,000 to $2,499114 No cash rent
Percentage of workers working in this county: 89.1%Number of people working at home: 2,704 (10.4% of all workers )
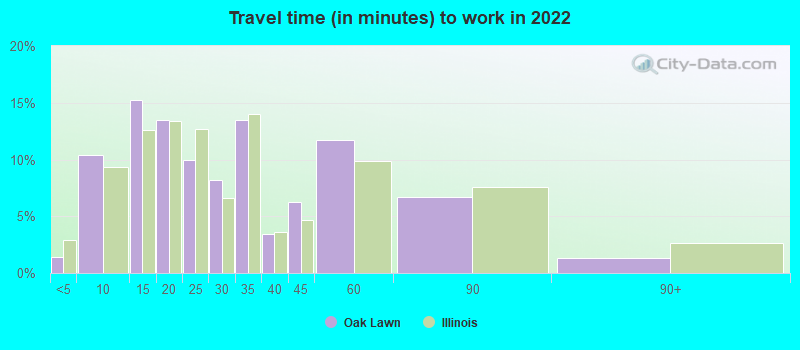
Travel time to work (commute)
Less than 5 minutes: 3435 to 9 minutes: 2,03810 to 14 minutes: 2,81915 to 19 minutes: 2,33420 to 24 minutes: 2,56325 to 29 minutes: 1,16930 to 34 minutes: 3,36035 to 39 minutes: 61040 to 44 minutes: 1,18345 to 59 minutes: 3,36160 to 89 minutes: 2,25090 or more minutes: 763
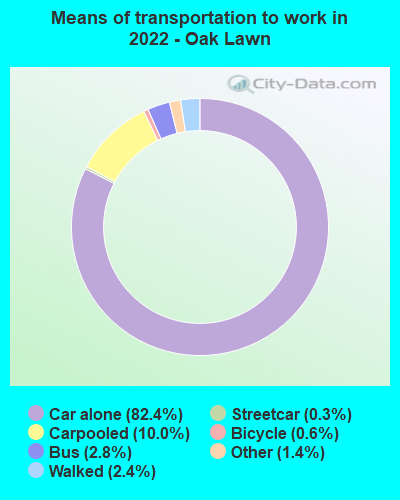
Means of transportation to work:
Drove a car alone: 16,905 (72.9%)Carpooled: 2,191 (9.5%)Bus : 537 (2.3%)Subway or elevated rail : 50 (0.2%)Long-distance train or commuter rail : 12 (0.1%)Taxi: 284 (1.2%)Bicycle: 130 (0.6%)Walked: 504 (2.2%)Worked at home: 2,704 (11.7%)
Unemployment by race in 2022
Unemployment rate for White non-Hispanic residents 2.8% Males6.2% FemalesUnemployment rate for Black residents 7.6% Males4.0% FemalesUnemployment rate for Asian residents 11.6% Males2.3% FemalesUnemployment rate for other race residents 13.4% FemalesUnemployment rate for two or more race residents 2.2% Males2.2% FemalesUnemployment rate for Hispanic or Latino residents 4.2% Males4.2% Females
Year of entry for the foreign-born population in Oak Lawn, Illinois
2,476 2010 or later 1,393 2000 to 2009 2,117 1990 to 1999 1,173 1980 to 1989 843 1970 to 1979 2,520 Before 1970
First ancestries reported:
Irish: 3,947 (13.1%)
Polish: 3,777 (12.6%)
German: 1,382 (4.6%)
Italian: 1,295 (4.3%)
American: 1,152 (3.8%)
Palestinian: 1,061 (3.5%)
Arab: 890 (3.0%)
Lithuanian: 612 (2.0%)
Greek: 367 (1.2%)
Syrian: 353 (1.2%)
English: 303 (1.0%)
Jordanian: 294 (1.0%)
Croatian: 192 (0.6%)
Dutch: 187 (0.6%)
Nigerian: 167 (0.6%)
Swedish: 163 (0.5%)
Norwegian: 117 (0.4%)
European: 105 (0.3%)
Ukrainian: 100 (0.3%)
Albanian: 95 (0.3%)
Jamaican: 88 (0.3%)
Egyptian: 87 (0.3%)
Eastern European: 87 (0.3%)
Romanian: 75 (0.2%)
Haitian: 68 (0.2%)
Austrian: 63 (0.2%)
Czech: 63 (0.2%)
African: 50 (0.2%)
Russian: 49 (0.2%)
Slovak: 45 (0.1%)
Scotch-Irish: 42 (0.1%)
Czechoslovakian: 32 (0.1%)
Yugoslavian: 26 (0.09%)
Hungarian: 24 (0.08%)
Moroccan: 22 (0.07%)
Bulgarian: 21 (0.07%)
French: 20 (0.07%)
Portuguese: 16 (0.05%)
Macedonian: 14 (0.05%)
Scottish: 12 (0.04%)
French Canadian: 10 (0.03%)
Serbian: 10 (0.03%)
Swiss: 9 (0.03%)
Slavic: 7 (0.02%)
British: 6 (0.02%)
Canadian: 6 (0.02%)
Danish: 3 (0.01%)
Armenian: 2 (0.01%)
Most common places of birth for foreign-born residents (%): Mexico Oak Lawn:
26.6% (2,503)Illinois:
34.7% (626,958)
Poland Oak Lawn:
17.5% (1,644)Illinois:
6.9% (124,474)
Asia, n.e.c. Oak Lawn:
10.8% (1,019)Illinois:
0.4% (7,117)
Philippines Oak Lawn:
4.8% (448)Illinois:
5.2% (93,003)
India Oak Lawn:
4.2% (399)Illinois:
9.2% (166,409)
Jordan Oak Lawn:
3.2% (303)Illinois:
0.5% (8,827)
Greece Oak Lawn:
3.1% (287)Illinois:
0.6% (10,720)
Ireland Oak Lawn:
2.7% (257)Illinois:
0.4% (6,611)
Syria Oak Lawn:
2.7% (255)Illinois:
0.4% (6,781)
Yemen Oak Lawn:
2.2% (210)Illinois:
0.1% (1,771)
Nigeria Oak Lawn:
2.1% (196)Illinois:
1.2% (21,186)
Venezuela Oak Lawn:
1.8% (170)Illinois:
0.5% (9,688)
Lithuania Oak Lawn:
1.8% (167)Illinois:
0.6% (10,249)
Kuwait Oak Lawn:
1.6% (148)Illinois:
0.1% (1,630)
Italy Oak Lawn:
1.6% (147)Illinois:
0.9% (15,679)
Place of birth for U.S.-born residents:
This state: 41,505Other state: 4,339Northeast: 637Midwest: 1,977South: 1,021West: 716 93.1% of Oak Lawn residents lived in the same house 1 years ago.
Out of people who lived in different houses, 47.3% lived in this county.
Out of people who lived in different counties, 51.5% lived in Illinois.
Oak Lawn:
93.1%State average:
88.3%
Education attainment for males 25 years and older:
No schooling: 792Nursery to 4th grade: 435th and 6th grade: 1067th and 8th grade: 2579th grade: 14010th grade: 26211th grade: 7812th grade, no diploma: 556High school graduate (or equivalency): 5,430Less than 1 year of college: 1,149Some college more than 1 year, no degree: 3,242Associate degree: 1,826Bachelor's degree: 3,549Master's degree: 1,248Professional school degree: 248Doctorate degree: 118
Education attainment for females 25 years and older:
No schooling: 601Nursery to 4th grade: 545th and 6th grade: 1717th and 8th grade: 3189th grade: 7510th grade: 12311th grade: 15112th grade, no diploma: 529High school graduate (or equivalency): 5,833Less than 1 year of college: 1,134Some college more than 1 year, no degree: 2,824Associate degree: 2,290Bachelor's degree: 4,493Master's degree: 1,982Professional school degree: 245Doctorate degree: 227
Housing units in structures:
One, detached: 15,516One, attached: 397Two: 5023 or 4: 1,1335 to 9: 1,82710 to 19: 2,03920 to 49: 1,22650 or more: 435Mobile homes: 225Housing units lacking complete plumbing facilities in 2022: 0.9%Housing units lacking complete kitchen facilities in 2022: 1.9%House/condo owner moved in on average 16 years ago
Renter moved in on average 5 years ago
Private vs. public school enrollment:
Students in private schools in grades 1 to 8 (elementary and middle school): 867 Students in private schools in grades 9 to 12 (high school): 949 Students in private undergraduate colleges: 841