Opal Cliffs, CA (California) Houses and Residents
| Opal Cliffs: | $950,190 |
| California: | $715,900 |
Total population: 5,846 (All urban)
Houses: 3,136 (2,823 occupied: 1,493 owner occupied, 1,330 renter occupied)
| % of renters here: | 47% |
| State: | 44% |
Housing density: 4,057 houses/condos per square mile
Median price asked for vacant for-sale houses and condos in 2022 in this county: $1,182,827.
Median contract rent in 2022: over $2,000 (lower quartile is $1,357, upper quartile is over $2,000)
Median rent asked for vacant for-rent units in 2022: $1,908
Median gross rent in Opal Cliffs, CA in 2022: over $2,000
Housing units in Opal Cliffs with a mortgage: 710 (114 second mortgage, 88 home equity loan, 4 both second mortgage and home equity loan)
Houses without a mortgage: 193
Compare current foreclosures near Opal Cliffs, CA:
| Photo | Address | Area | Beds / Baths | Price | Details |
|---|---|---|---|---|---|

|
#1
Migues Mountain Ln
Aptos, CA 95003
|
4,500 sq. feet
|
2 baths 3 beds |
show details | |

|
#2
Sutphen St
Santa Cruz, CA 95060
|
1,147 sq. feet
|
2 baths 3 beds |
show details | |

|
#3
Hall Ranch Rd
Santa Cruz, CA 95065
|
1,534 sq. feet
|
2 baths 2 beds |
show details | |

|
#4
Enos Ln
Watsonville, CA 95076
|
2,179 sq. feet
|
2 baths 3 beds |
show details | |

|
#5
Alisa Cir
Watsonville, CA 95076
|
1,026 sq. feet
|
1 baths 2 beds |
show details | |

|
#6
Empire Grade
Santa Cruz, CA 95060
|
1,461 sq. feet
|
2 baths 2 beds |
show details | |

|
#7
Western Avenue
Boulder Creek, CA 95006
|
1,468 sq. feet
|
2 baths 2 beds |
show details | |

|
#8
Chanticleer Ave
Santa Cruz, CA 95062
|
856 sq. feet
|
1 baths 2 beds |
show details | |

|
#9
Loma Prieta Ave
Los Gatos, CA 95033
|
4,167 sq. feet
|
4 baths 4 beds |
show details | |

|
#10
Gregory Rd
Watsonville, CA 95076
|
1,619 sq. feet
|
2 baths 4 beds |
show details |
| Photo | Address | Area | Beds / Baths | Price | Details |
|---|---|---|---|---|---|

|
#11
Johnson Rd
Watsonville, CA 95076
|
1,852 sq. feet
|
3 baths 6 beds |
show details | |

|
#12
Summit Rd
Los Gatos, CA 95033
|
1,135 sq. feet
|
1 baths 2 beds |
show details | |

|
#13
Osborn Rd
Watsonville, CA 95076
|
1,228 sq. feet
|
1 baths 3 beds |
show details | |

|
#14
Las Lomas Dr
Watsonville, CA 95076
|
1,259 sq. feet
|
2 baths 3 beds |
show details | |

|
#15
Gregory Rd
Watsonville, CA 95076
|
1,619 sq. feet
|
2 baths 4 beds |
show details | |

|
#16
Fruitland Ave
Watsonville, CA 95076
|
2,345 sq. feet
|
2 baths 2 beds |
show details | |

|
#17
Loma Prieta Ave
Los Gatos, CA 95033
|
4,167 sq. feet
|
4 baths 4 beds |
show details | |

|
#18
Willow Rd
Watsonville, CA 95076
|
1,976 sq. feet
|
1 baths 4 beds |
show details | |

|
#19
Las Lomas Dr
Watsonville, CA 95076
|
1,120 sq. feet
|
1 baths 3 beds |
show details | |

|
#20
Fresco St
Felton, CA 95018
|
- sq. feet
|
1 baths 1 beds |
show details |
| Photo | Address | Area | Beds / Baths | Price | Details |
|---|---|---|---|---|---|

|
#21
Migues Mountain Ln
Aptos, CA 95003
|
2,106 sq. feet
|
2 baths 3 beds |
show details | |

|
#22
California Dr
Ben Lomond, CA 95005
|
- sq. feet
|
1 baths 2 beds |
show details | |

|
#23
W 5th St # A
Watsonville, CA 95076
|
- sq. feet
|
1 baths 3 beds |
show details | |

|
#24
Brackney Rd
Ben Lomond, CA 95005
|
- sq. feet
|
1 baths 3 beds |
show details | |

|
#25
Eureka Canyon Rd
Watsonville, CA 95076
|
- sq. feet
|
1 baths 2 beds |
show details | |

|
#26
Bean Creek Rd Unit 146
Scotts Valley, CA 95066
|
- sq. feet
|
2 baths 2 beds |
show details | |

|
#27
Quail Ridge Rd
Scotts Valley, CA 95066
|
- sq. feet
|
3 baths 4 beds |
show details | |

|
#28
Highway 9
Felton, CA 95018
|
- sq. feet
|
2 baths 4 beds |
show details | |

|
#29
Hoover Rd
Soquel, CA 95073
|
- sq. feet
|
3 baths 3 beds |
show details | |

|
#30
Packard Ln
Watsonville, CA 95076
|
- sq. feet
|
2 baths 3 beds |
show details |
| Photo | Address | Area | Beds / Baths | Price | Details |
|---|---|---|---|---|---|

|
#31
Morehouse Dr
Watsonville, CA 95076
|
- sq. feet
|
2 baths 5 beds |
show details | |

|
#32
Rodriguez St
Watsonville, CA 95076
|
- sq. feet
|
1 baths 1 beds |
show details | |

|
#33
Mcdonald Rd
Aptos, CA 95003
|
- sq. feet
|
1 baths 2 beds |
show details | |

|
#34
E High St
Watsonville, CA 95076
|
- sq. feet
|
2 baths 3 beds |
show details | |

|
#35
Shults Ln
Felton, CA 95018
|
- sq. feet
|
1 baths 2 beds |
show details | |

|
#36
Rainbow Ln
Watsonville, CA 95076
|
- sq. feet
|
2 baths 4 beds |
show details | |

|
#37
Lynbrook Ct
Watsonville, CA 95076
|
- sq. feet
|
2 baths 2 beds |
show details | |

|
#38
Oakridge Ct
Watsonville, CA 95076
|
- sq. feet
|
2 baths 3 beds |
show details | |

|
#39
Green Valley Rd
Watsonville, CA 95076
|
- sq. feet
|
1 baths 2 beds |
show details | |

|
#40
Vista Verde Cir
Watsonville, CA 95076
|
- sq. feet
|
4 baths 4 beds |
show details |
| Photo | Address | Area | Beds / Baths | Price | Details |
|---|---|---|---|---|---|

|
#41
Clifford Ave
Watsonville, CA 95076
|
- sq. feet
|
2 baths 3 beds |
show details | |

|
#42
Fresco St
Felton, CA 95018
|
- sq. feet
|
1 baths 1 beds |
show details | |

|
#43
Rosewood Dr
Watsonville, CA 95076
|
- sq. feet
|
2 baths 3 beds |
show details | |

|
#44
Pajaro Cir
Freedom, CA 95019
|
- sq. feet
|
4 baths 4 beds |
show details | |

|
#45
Bright View Ln
Watsonville, CA 95076
|
- sq. feet
|
2 baths 3 beds |
show details | |

|
#46
Kipling Ave
Ben Lomond, CA 95005
|
- sq. feet
|
2 baths 2 beds |
show details | |

|
#47
Rialto Dr
Watsonville, CA 95076
|
- sq. feet
|
2 baths 3 beds |
show details | |

|
#48
Eleana Dr
Ben Lomond, CA 95005
|
- sq. feet
|
2 baths 3 beds |
show details | |

|
#49
Jared Way
Freedom, CA 95019
|
- sq. feet
|
4 baths 3 beds |
show details | |

|
Check over 1 million property listings on Foreclosure.com!
|
browse all offers | |||

 | Santa Rosa vs Santa Cruz (29 replies) |
| Where's my dream California city? (27 replies) |
Household type by relationship:
Households: 251,413- In family households: 196,185 (38,808 male householders, 18,962 female householders)
43,334 spouses, 67,329 children (63,444 natural, 1,638 adopted, 2,247 stepchildren), 4,926 grandchildren, 3,118 brothers or sisters, 2,193 parents, foster children, 5,097 other relatives, 10,032 non-relatives
- In nonfamily households: 55,228 (17,211 male householders (11,156 living alone)), 19,374 female householders (13,770 living alone)), 18,643 nonrelatives
- In group quarters: 10,969 (1,166 institutionalized population)
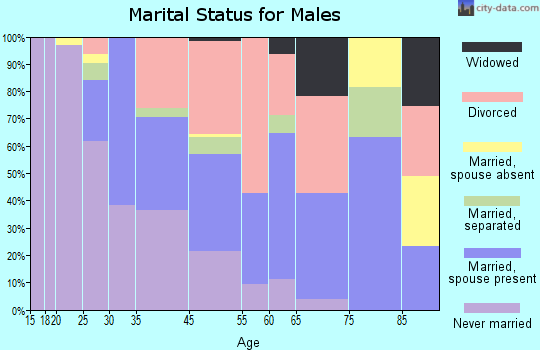
40,832 married couples with children.
12,801 single-parent households (3,564 men, 9,237 women).
87.4% of residents of Opal Cliffs speak English at home.
9.8% of residents speak Spanish at home (59% speak English very well, 23% speak English well, 10% speak English not well, 8% don't speak English at all).
2.2% of residents speak other Indo-European language at home (88% speak English very well, 7% speak English well, 5% speak English not well).
0.6% of residents speak Asian or Pacific Island language at home (29% speak English very well, 32% speak English well, 38% don't speak English at all).
Foreign born population: 528 (7.9%)
(40.0% of them are naturalized citizens)
| Here: | 4.6 |
| State: | 6.0 |
| Here: | 3.9 |
| State: | 3.9 |

- Bedrooms in owner-occupied houses and condos in Opal Cliffs, California
- 0no bedroom
- 1921 bedroom
- 7502 bedrooms
- 4453 bedrooms
- 1064 bedrooms
- 05+ bedrooms

- Bedrooms in renter-occupied apartments in Opal Cliffs, California
- 117no bedroom
- 4131 bedroom
- 5712 bedrooms
- 2223 bedrooms
- 74 bedrooms
- 05+ bedrooms

- Cars and other vehicles available in Opal Cliffs in owner-occupied houses/condos
- 78no vehicle
- 5131 vehicle
- 5872 vehicles
- 2443 vehicles
- 524 vehicles
- 195+ vehicles

- Cars and other vehicles available in Opal Cliffs in renter-occupied apartments
- 145no vehicle
- 5421 vehicle
- 4692 vehicles
- 1523 vehicles
- 224 vehicles
- 05+ vehicles

- Rooms in owner-occupied houses in Opal Cliffs, California
- 01 room
- 522 rooms
- 2053 rooms
- 4054 rooms
- 3885 rooms
- 2886 rooms
- 967 rooms
- 358 rooms
- 249+ rooms

- Rooms in renter-occupied apartments in Opal Cliffs, California
- 1171 room
- 2192 rooms
- 2283 rooms
- 4394 rooms
- 2225 rooms
- 726 rooms
- 177 rooms
- 78 rooms
- 99+ rooms


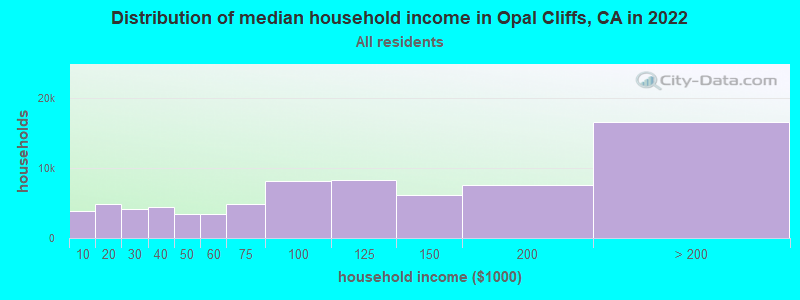
Opal Cliffs, CA household income distribution

- 3,841Less than $10,000
- 4,799$10,000 to $19,999
- 4,138$20,000 to $29,999
- 4,483$30,000 to $39,999
- 3,449$40,000 to $49,999
- 3,473$50,000 to $59,999
- 4,916$60,000 to $74,999
- 8,137$75,000 to $99,999
- 8,297$100,000 to $124,999
- 6,117$125,000 to $149,999
- 7,640$150,000 to $199,999
- 16,588$200,000 or more
Percentage of workers working in this county: 88.3%
Number of people working at home: 721 (19.9% of all workers)
Travel time to work (commute)
- Less than 5 minutes: 91
- 5 to 9 minutes: 345
- 10 to 14 minutes: 569
- 15 to 19 minutes: 651
- 20 to 24 minutes: 464
- 25 to 29 minutes: 133
- 30 to 34 minutes: 262
- 35 to 39 minutes: 53
- 40 to 44 minutes: 62
- 45 to 59 minutes: 206
- 60 to 89 minutes: 339
- 90 or more minutes: 77
Means of transportation to work:
- Drove a car alone: 2,365 (65.7%)
- Carpooled: 542 (15.1%)
- Bus or trolley bus: 54 (1.5%)
- Ferryboat: 11 (0.3%)
- Motorcycle: 17 (0.5%)
- Bicycle: 155 (4.3%)
- Walked: 95 (2.6%)
- Other means: 13 (0.4%)
- Worked at home: 349 (9.7%)


- Year of entry for the foreign-born population in Opal Cliffs, California
- 1161995 to March 2000
- 711990 to 1994
- 811985 to 1989
- 371980 to 1984
- 621975 to 1979
- 401970 to 1974
- 01965 to 1969
- 106Before 1965
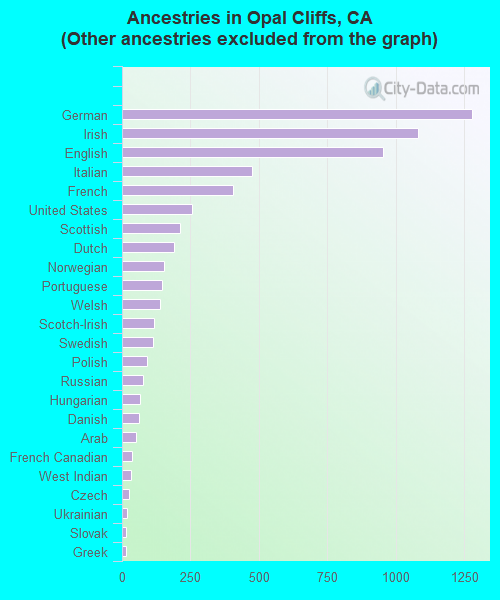
First ancestries reported:
- Other: 1,863 (23.6%)
- German: 1,276 (16.2%)
- Irish: 1,080 (13.7%)
- English: 953 (12.1%)
- Italian: 476 (6.0%)
- French: 406 (5.1%)
- United States: 257 (3.3%)
- Scottish: 211 (2.7%)
- Dutch: 191 (2.4%)
- Norwegian: 155 (2.0%)
- Portuguese: 145 (1.8%)
- Welsh: 137 (1.7%)
- Scotch-Irish: 117 (1.5%)
- Swedish: 113 (1.4%)
- Polish: 93 (1.2%)
- Russian: 78 (1.0%)
- Hungarian: 65 (0.8%)
- Danish: 62 (0.8%)
- Arab: 50 (0.6%)
- French Canadian: 37 (0.5%)
- West Indian: 33 (0.4%)
- Czech: 25 (0.3%)
- Ukrainian: 19 (0.2%)
- Slovak: 16 (0.2%)
- Greek: 15 (0.2%)
- Lithuanian: 8 (0.1%)
- Swiss: 8 (0.1%)
Most common places of birth for foreign-born residents (%):
| Opal Cliffs: | 43.7% (224) |
| California: | 44.3% (3,928,701) |
| Opal Cliffs: | 9.6% (49) |
| California: | 1.5% (133,090) |
| Opal Cliffs: | 9.4% (48) |
| California: | 0.3% (22,931) |
| Opal Cliffs: | 6.6% (34) |
| California: | 1.6% (141,181) |
| Opal Cliffs: | 5.5% (28) |
| California: | 4.1% (359,673) |
| Opal Cliffs: | 4.9% (25) |
| California: | 1.1% (98,160) |
| Opal Cliffs: | 3.1% (16) |
| California: | 2.4% (211,458) |
| Opal Cliffs: | 2.7% (14) |
| California: | 0.1% (9,641) |
| Opal Cliffs: | 2.5% (13) |
| California: | 3.0% (268,452) |
| Opal Cliffs: | 2.1% (11) |
| California: | 0.2% (18,679) |
| Opal Cliffs: | 1.8% (9) |
| California: | 0.2% (18,478) |
| Opal Cliffs: | 1.8% (9) |
| California: | 0.5% (44,953) |
| Opal Cliffs: | 1.6% (8) |
| California: | 0.2% (14,359) |
Place of birth for U.S.-born residents:
- This state: 4,112
- Other state: 1,735
- Northeast: 441
- Midwest: 640
- South: 358
- West: 296
50% of Opal Cliffs residents lived in the same house 5 years ago.
Out of people who lived in different houses, 60% lived in this county.
Out of people who lived in different counties, 67% lived in California.
Education attainment for males 25 years and older:
- No schooling: 41
- Nursery to 4th grade: 9
- 5th and 6th grade: 14
- 7th and 8th grade: 22
- 9th grade: 25
- 10th grade: 57
- 11th grade: 20
- 12th grade, no diploma: 92
- High school graduate (or equivalency): 331
- Less than 1 year of college: 147
- Some college more than 1 year, no degree: 562
- Associate degree: 192
- Bachelor's degree: 549
- Master's degree: 137
- Professional school degree: 83
- Doctorate degree: 33

Education attainment for females 25 years and older:
- No schooling: 32
- Nursery to 4th grade: 0
- 5th and 6th grade: 17
- 7th and 8th grade: 50
- 9th grade: 32
- 10th grade: 42
- 11th grade: 25
- 12th grade, no diploma: 38
- High school graduate (or equivalency): 547
- Less than 1 year of college: 155
- Some college more than 1 year, no degree: 561
- Associate degree: 148
- Bachelor's degree: 460
- Master's degree: 81
- Professional school degree: 105
- Doctorate degree: 10

Housing units in structures:
- One, detached: 1,637
- One, attached: 285
- Two: 157
- 3 or 4: 144
- 5 to 9: 83
- 10 to 19: 64
- 20 to 49: 35
- 50 or more: 17
- Mobile homes: 714
Median worth of mobile homes: $208,733
Housing units lacking complete kitchen facilities: 0.7%

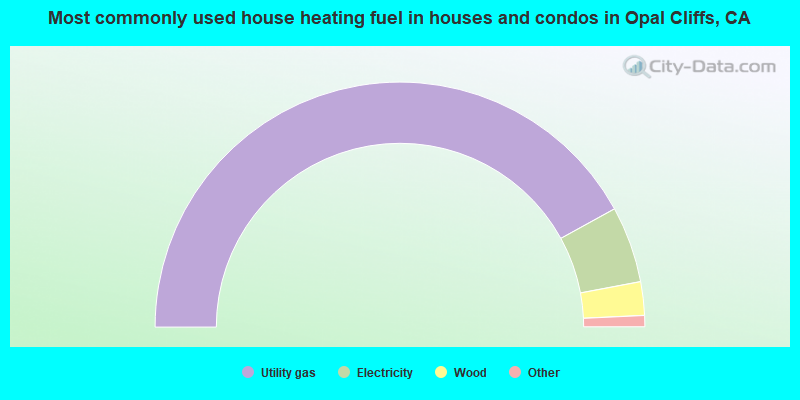
- 83.9%Utility gas
- 10.1%Electricity
- 4.4%Wood
- 1.0%Bottled, tank, or LP gas
- 0.5%No fuel used
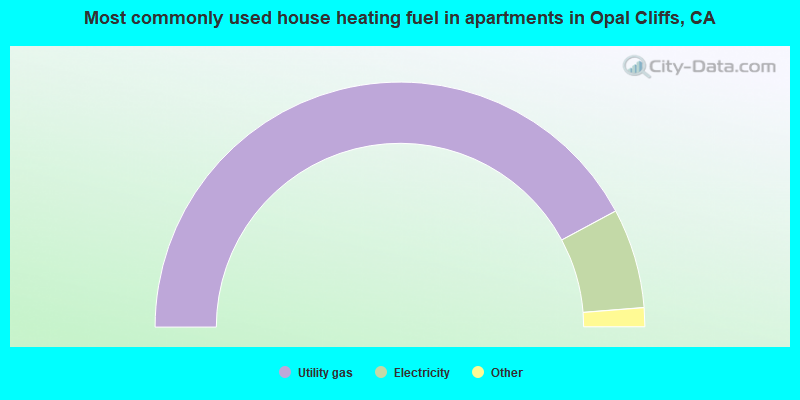
- 84.3%Utility gas
- 13.2%Electricity
- 1.3%Bottled, tank, or LP gas
- 1.2%Wood
Private vs. public school enrollment:
| Here: | 12.3% |
| California: | 9.9% |
| Here: | 0.0% |
| California: | 7.8% |
| Here: | 6.8% |
| California: | 15.4% |


