Orem, UT (Utah) Houses and Residents
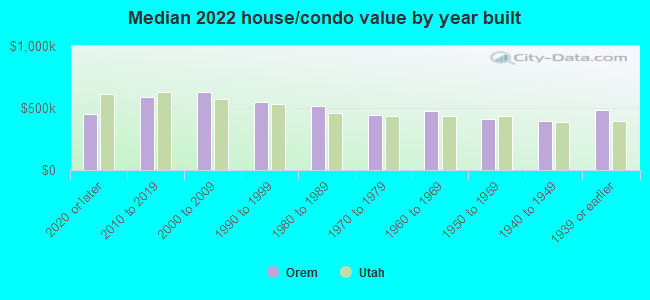
| Orem: | $485,100 |
| Utah: | $499,500 |
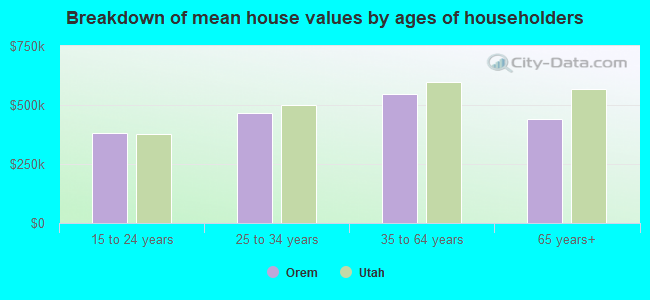
Mean price in 2022:
Detached houses: $541,674
Here: $541,674 State: $607,750 Townhouses or other attached units: $387,422
Here: $387,422 State: $444,505 In 2-unit structures: $313,812
Here: $313,812 State: $433,540 In 3-to-4-unit structures: $269,853
Here: $269,853 State: $362,850 In 5-or-more-unit structures: $254,225
Here: $254,225 State: $412,810 Mobile homes: $128,666
Here: $128,666 State: $113,475
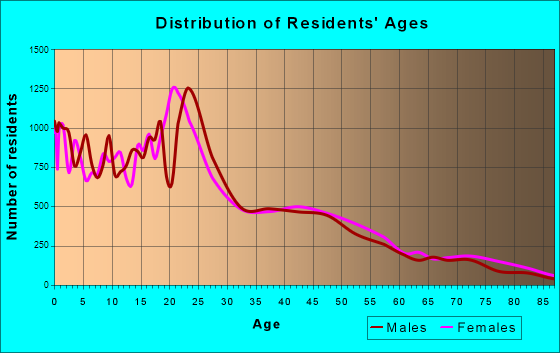
Total population: 91,781 (Urban population: 83,933, Rural population: 400 (all nonfarm))
Houses: 32,762 (30,904 occupied: 17,440 owner occupied, 13,464 renter occupied)
| % of renters here: | 44% |
| State: | 29% |
Housing density: 1,777 houses/condos per square mile
Median price asked for vacant for-sale houses and condos in 2022: $1,565,929.
Median contract rent in 2022: $1,270 (lower quartile is $986, upper quartile is $1,686)
Median rent asked for vacant for-rent units in 2022: $1,671
Median gross rent in Orem, UT in 2022: $1,428
Housing units in Orem with a mortgage: 11,906 (1,673 second mortgage, 0 home equity loan, 1,366 both second mortgage and home equity loan)
Houses without a mortgage: 346
Median household income for houses/condos with a mortgage: $105,539
Median household income for apartments without a mortgage: $77,211
Median monthly housing costs: $1,412
Compare current foreclosures in Orem, UT:
| Photo | Address | Area | Beds / Baths | Price | Details |
|---|---|---|---|---|---|

|
#1
500 N
Orem, UT 84059
|
2,635 sq. feet
|
2 baths 4 beds |
show details | |

|
#2
W 180 S
Orem, UT 84058
|
1,392 sq. feet
|
4 baths 4 beds |
show details | |

|
#3
E 300 N
Orem, UT 84057
|
1,538 sq. feet
|
1 baths 4 beds |
show details | |

|
#4
N 750 W
Orem, UT 84057
|
2,677 sq. feet
|
5 baths 3 beds |
show details | |

|
#5
W 100 S
Orem, UT 84058
|
2,009 sq. feet
|
3 baths 3 beds |
show details | |

|
#6
N 80 W
Orem, UT 84057
|
2,052 sq. feet
|
2 baths 3 beds |
show details | |

|
#7
N 700 E
Orem, UT 84097
|
2,585 sq. feet
|
4 baths 5 beds |
show details | |

|
#8
S 240 E
Orem, UT 84058
|
2,650 sq. feet
|
3 baths 5 beds |
show details | |

|
#9
S 150 E
Orem, UT 84058
|
1,750 sq. feet
|
2 baths 3 beds |
show details | |

|
#10
Heather Rd
Orem, UT 84097
|
3,446 sq. feet
|
4 baths 3 beds |
show details |
| Photo | Address | Area | Beds / Baths | Price | Details |
|---|---|---|---|---|---|

|
#11
N Garden Dr
Orem, UT 84057
|
1,605 sq. feet
|
1 baths 3 beds |
show details | |

|
#12
W 1300 N
Orem, UT 84057
|
2,348 sq. feet
|
1 baths 3 beds |
show details | |

|
#13
N 950 W
Orem, UT 84057
|
1,428 sq. feet
|
1 baths 2 beds |
show details | |

|
#14
N 980 W
Orem, UT 84057
|
1,383 sq. feet
|
2 baths 3 beds |
show details | |

|
#15
S 400 E
Orem, UT 84097
|
2,950 sq. feet
|
4 baths 6 beds |
show details | |

|
#16
N 800 W
Orem, UT 84057
|
1,575 sq. feet
|
3 baths 3 beds |
show details | |

|
#17
Cherapple Dr
Orem, UT 84097
|
4,349 sq. feet
|
3 baths 4 beds |
show details | |

|
#18
N 435 E
Orem, UT 84097
|
2,466 sq. feet
|
3 baths 5 beds |
show details | |

|
#19
S 400 W
Orem, UT 84058
|
2,652 sq. feet
|
2 baths 2 beds |
show details | |

|
#20
N 350 E
Orem, UT 84057
|
1,414 sq. feet
|
2 baths 4 beds |
show details |
| Photo | Address | Area | Beds / Baths | Price | Details |
|---|---|---|---|---|---|

|
#21
W 220 S
Orem, UT 84058
|
1,092 sq. feet
|
1 baths 3 beds |
show details | |

|
#22
Hanover Dr
Orem, UT 84058
|
1,002 sq. feet
|
1 baths 2 beds |
show details | |

|
#23
W 690 S
Orem, UT 84058
|
1,451 sq. feet
|
2 baths 3 beds |
show details | |

|
#24
N 1200 W
Orem, UT 84057
|
1,512 sq. feet
|
3 baths 3 beds |
show details | |

|
#25
N 685 W
Orem, UT 84057
|
2,059 sq. feet
|
2 baths 4 beds |
show details | |

|
#26
W 400 N
Orem, UT 84057
|
830 sq. feet
|
1 baths 2 beds |
show details | |

|
#27
E 1650 S
Orem, UT 84097
|
1,474 sq. feet
|
2 baths 3 beds |
show details | |

|
#28
E 400 S
Orem, UT 84097
|
2,568 sq. feet
|
2 baths 3 beds |
show details | |

|
#29
N 470 W
Orem, UT 84057
|
2,012 sq. feet
|
2 baths 3 beds |
show details | |

|
#30
Beverly Ave
Orem, UT 84057
|
1,368 sq. feet
|
1 baths 2 beds |
show details |
| Photo | Address | Area | Beds / Baths | Price | Details |
|---|---|---|---|---|---|

|
#31
S 610 E
Orem, UT 84097
|
2,361 sq. feet
|
1 baths 2 beds |
show details | |

|
#32
S 1200 W
Orem, UT 84058
|
1,453 sq. feet
|
1 baths 2 beds |
show details | |

|
#33
W 220 S
Orem, UT 84058
|
1,208 sq. feet
|
2 baths 3 beds |
show details | |

|
#34
S 320 W
Orem, UT 84058
|
3,840 sq. feet
|
2 baths 3 beds |
show details | |

|
#35
N 1130 W
Orem, UT 84057
|
2,448 sq. feet
|
2 baths 6 beds |
show details | |

|
#36
Glendell Dr
Orem, UT 84058
|
5,570 sq. feet
|
5 baths 6 beds |
show details | |

|
#37
W 1400 N
Orem, UT 84057
|
1,078 sq. feet
|
1 baths 2 beds |
show details | |

|
#38
E 680 N
Orem, UT 84097
|
2,806 sq. feet
|
3 baths 4 beds |
show details | |

|
#39
N 1180 E
Orem, UT 84097
|
3,692 sq. feet
|
5 baths 3 beds |
show details | |

|
#40
W 575 S
Orem, UT 84058
|
1,896 sq. feet
|
2 baths 3 beds |
show details |
| Photo | Address | Area | Beds / Baths | Price | Details |
|---|---|---|---|---|---|

|
#41
Westwood Dr
Orem, UT 84097
|
2,288 sq. feet
|
3 baths 5 beds |
show details | |

|
#42
S 50 E
Orem, UT 84058
|
2,851 sq. feet
|
4 baths 6 beds |
show details | |

|
#43
N 80 E
Orem, UT 84057
|
3,646 sq. feet
|
4 baths 4 beds |
show details | |

|
#44
E 1838 S
Orem, UT 84058
|
2,038 sq. feet
|
2 baths 4 beds |
show details | |

|
#45
N 800 W
Orem, UT 84057
|
2,906 sq. feet
|
3 baths 4 beds |
show details | |

|
#46
N State St, Trlr 75
Orem, UT 84057
|
- sq. feet
|
- baths - beds |
show details | |

|
#47
Hanover Dr
Orem, UT 84058
|
- sq. feet
|
- baths - beds |
show details | |

|
#48
E 1550 S
Orem, UT 84097
|
- sq. feet
|
- baths - beds |
show details | |

|
#49
W Seasons Dr
Orem, UT 84059
|
- sq. feet
|
- baths - beds |
show details | |

|
Check over 1 million property listings on Foreclosure.com!
|
browse all offers | |||

Latest news about housing in Orem, UT collected exclusively by city-data.com from local newspapers, TV, and radio stations

 | Nicest areas with apartments for a young professional? (10 replies) |
| New Provo / Orem thread - thinking of moving there... (8 replies) |
| Good areas with new construction homes? (10 replies) |
| Rental house in orem, 2 or 3 bdrm (0 replies) |
| Housing in SLC Area (7 replies) |
| Where Are Non-community Houses For Rent Near Lehi (2 replies) |
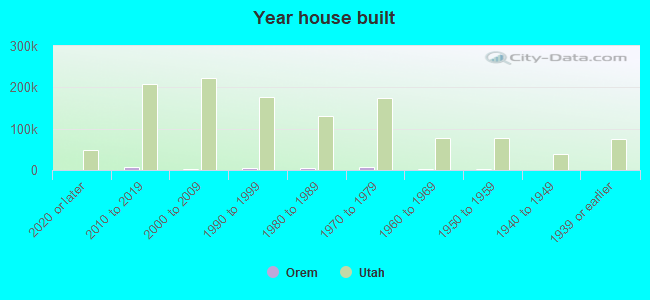
Median year apartment built: 1997
Household type by relationship:
Households: 95,918- Male householders: 15,909 (2,577 living alone), Female householders: 14,995 (2,826 living alone)
19,042 spouses (18,922 opposite-sex spouses), 1,238 unmarried partners, (976 opposite-sex unmarried partners), 31,023 children (29,967 natural, 478 adopted, 578 stepchildren), 2,599 grandchildren, 927 brothers or sisters, 1,109 parents, 0 foster children, 2,046 other relatives, 4,446 non-relatives
- In group quarters: 2,584
Size of family households: 8,799 2-persons, 4,670 3-persons, 3,501 4-persons, 3,230 5-persons, 1,057 6-persons, 1,547 7-or-more-persons.
Size of nonfamily households: 5,403 1-person, 1,620 2-persons, 668 3-persons, 256 4-persons, 153 6-persons.
19,490 married couples with children.
2,682 single-parent households (592 men, 2,090 women).
78.8% of residents of Orem speak English at home.
16.3% of residents speak Spanish at home (55% speak English very well, 24% speak English well, 14% speak English not well, 7% don't speak English at all).
2.8% of residents speak other Indo-European language at home (82% speak English very well, 11% speak English well, 7% speak English not well).
2.6% of residents speak Asian or Pacific Island language at home (72% speak English very well, 13% speak English well, 15% speak English not well).
0.4% of residents speak other language at home (76% speak English very well, 15% speak English well, 9% speak English not well).
Foreign born population: 11,653 (12.1%)
(32.7% of them are naturalized citizens)
| Here: | 8.3 |
| State: | 7.6 |
| Here: | 4.1 |
| State: | 4.3 |
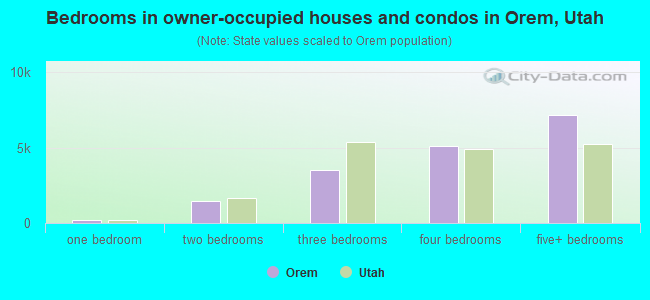
- Bedrooms in owner-occupied houses and condos in Orem, Utah
- 0no bedroom
- 1731 bedroom
- 1,4352 bedrooms
- 3,5423 bedrooms
- 5,1254 bedrooms
- 7,1655+ bedrooms
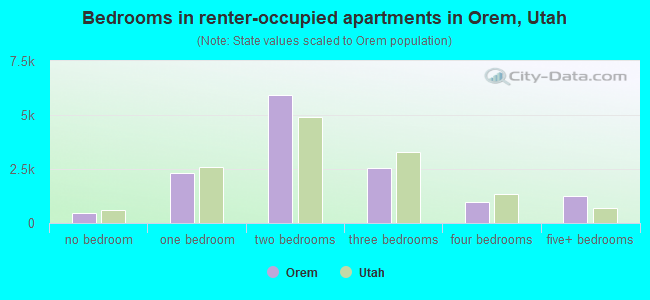
- Bedrooms in renter-occupied apartments in Orem, Utah
- 486no bedroom
- 2,3181 bedroom
- 5,9262 bedrooms
- 2,5263 bedrooms
- 9614 bedrooms
- 1,2475+ bedrooms
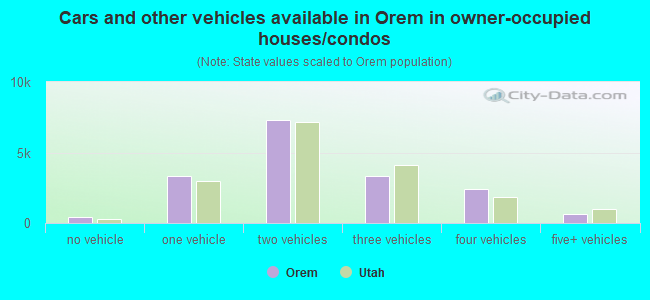
- Cars and other vehicles available in Orem in owner-occupied houses/condos
- 392no vehicle
- 3,3331 vehicle
- 7,3272 vehicles
- 3,3443 vehicles
- 2,4254 vehicles
- 6195+ vehicles
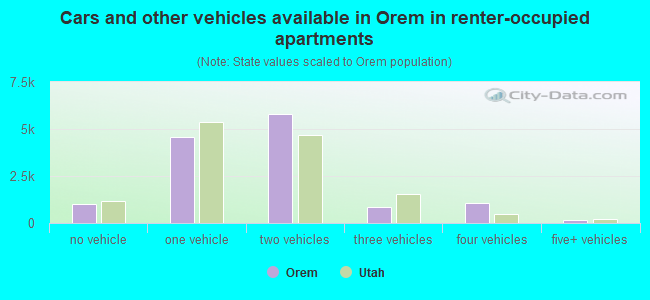
- Cars and other vehicles available in Orem in renter-occupied apartments
- 1,008no vehicle
- 4,5571 vehicle
- 5,7932 vehicles
- 8553 vehicles
- 1,0834 vehicles
- 1685+ vehicles
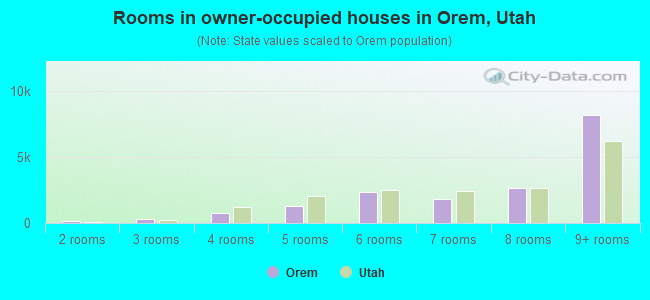
- Rooms in owner-occupied houses in Orem, Utah
- 01 room
- 1322 rooms
- 3043 rooms
- 7574 rooms
- 1,2635 rooms
- 2,3696 rooms
- 1,8237 rooms
- 2,6168 rooms
- 8,1769+ rooms
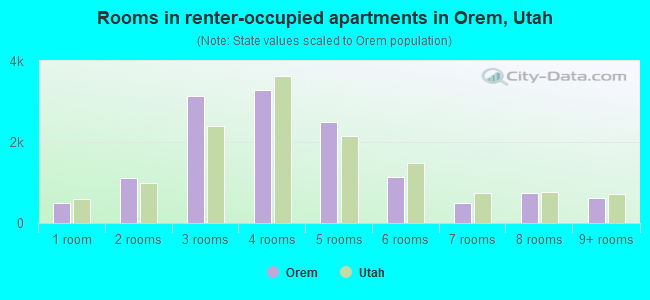
- Rooms in renter-occupied apartments in Orem, Utah
- 4861 room
- 1,1012 rooms
- 3,1273 rooms
- 3,2814 rooms
- 2,4855 rooms
- 1,1326 rooms
- 5017 rooms
- 7318 rooms
- 6209+ rooms
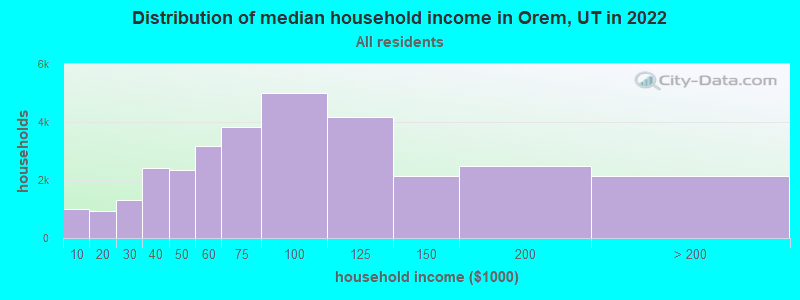
Orem, UT household income distribution

- 997Less than $10,000
- 915$10,000 to $19,999
- 1,323$20,000 to $29,999
- 2,403$30,000 to $39,999
- 2,333$40,000 to $49,999
- 3,164$50,000 to $59,999
- 3,836$60,000 to $74,999
- 5,008$75,000 to $99,999
- 4,178$100,000 to $124,999
- 2,151$125,000 to $149,999
- 2,469$150,000 to $199,999
- 2,127$200,000 or more
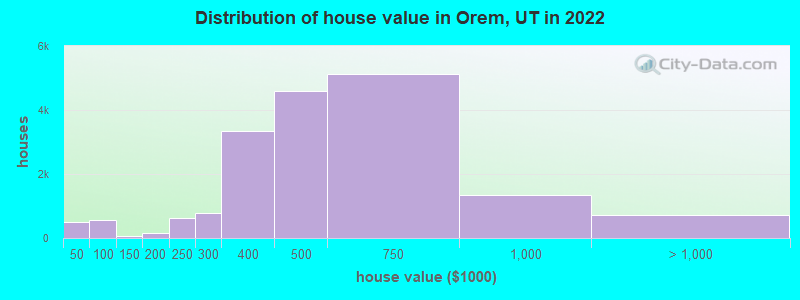
Home value of owner - occupied houses in 2022 in Orem, UT
-
- 154Less than $10,000
- 28$15,000 to $19,999
- 18$20,000 to $24,999
- 61$25,000 to $29,999
- 80$30,000 to $34,999
- 31$35,000 to $39,999
- 126$40,000 to $49,999
- 112$50,000 to $59,999
- 43$60,000 to $69,999
- 195$70,000 to $79,999
- 97$80,000 to $89,999
- 31$100,000 to $124,999
- 31$125,000 to $149,999
- 80$150,000 to $174,999
- 87$175,000 to $199,999
- 610$200,000 to $249,999
- 781$250,000 to $299,999
- 3,328$300,000 to $399,999
- 4,586$400,000 to $499,999
- 5,116$500,000 to $749,999
- 1,359$750,000 to $999,999
- 539$1,000,000 to $1,499,999
- 48$1,500,000 to $1,999,999
- 139$2,000,000 or more
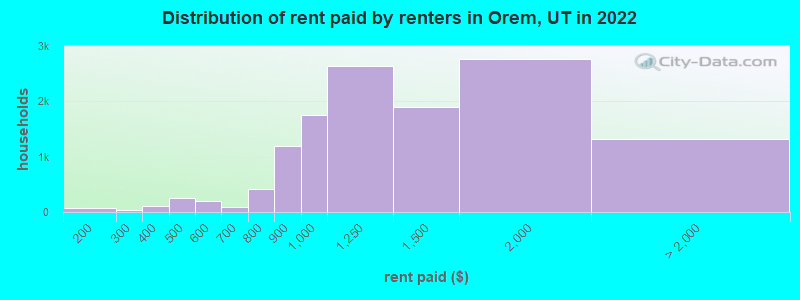
Rent paid by renters in 2022 in Orem, UT
-
- 66$150 to $199
- 41$250 to $299
- 28$300 to $349
- 72$350 to $399
- 26$400 to $449
- 217$450 to $499
- 152$500 to $549
- 38$550 to $599
- 48$600 to $649
- 48$650 to $699
- 117$700 to $749
- 293$750 to $799
- 1,198$800 to $899
- 1,747$900 to $999
- 2,645$1,000 to $1,249
- 1,890$1,250 to $1,499
- 2,771$1,500 to $1,999
- 555$2,000 to $2,499
- 173$2,500 to $2,999
- 64$3,500 or more
- 527No cash rent
Percentage of workers working in this county: 88.9%
Number of people working at home: 8,594 (17.3% of all workers)
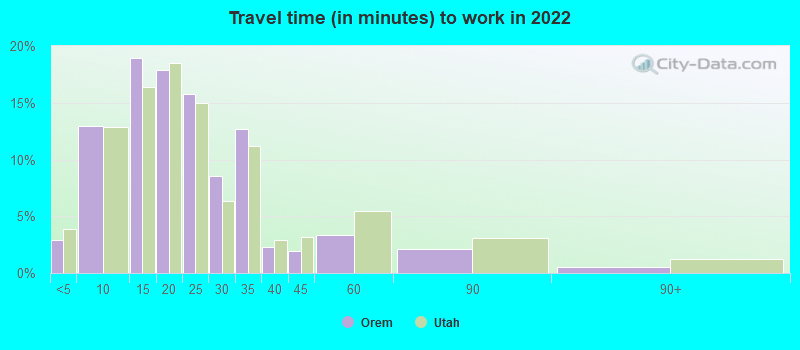
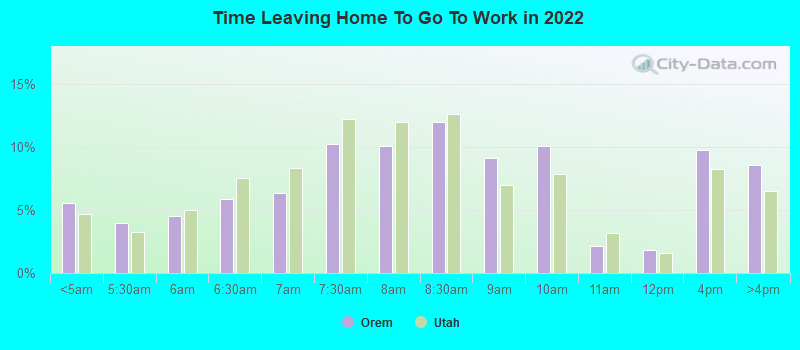
Travel time to work (commute)
- Less than 5 minutes: 988
- 5 to 9 minutes: 6,254
- 10 to 14 minutes: 8,205
- 15 to 19 minutes: 10,082
- 20 to 24 minutes: 4,850
- 25 to 29 minutes: 1,867
- 30 to 34 minutes: 3,952
- 35 to 39 minutes: 351
- 40 to 44 minutes: 882
- 45 to 59 minutes: 1,895
- 60 to 89 minutes: 1,585
- 90 or more minutes: 307
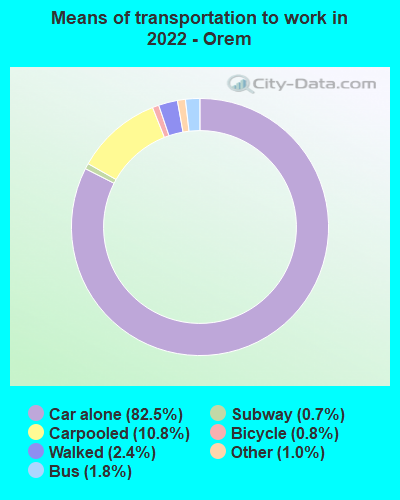
Means of transportation to work:
- Drove a car alone: 38,021 (68.6%)
- Carpooled: 4,924 (8.9%)
- Bus: 863 (1.6%)
- Subway or elevated rail: 7 (0.0%)
- Long-distance train or commuter rail: 158 (0.3%)
- Light rail, streetcar or trolley: 16 (0.0%)
- Taxi: 521 (0.9%)
- Bicycle: 377 (0.7%)
- Walked: 814 (1.5%)
- Worked at home: 9,361 (16.9%)
- Unemployment by race in 2022
- Unemployment rate for White non-Hispanic residents
- 2.9%Males
- 3.5%Females
- Unemployment rate for Black residents
- 5.2%Females
- Unemployment rate for American Indian and Alaska Native residents
- 5.6%Males
- Unemployment rate for Asian residents
- 4.6%Males
- 1.2%Females
- Unemployment rate for other race residents
- 1.5%Males
- 2.9%Females
- Unemployment rate for two or more race residents
- 5.2%Males
- 6.0%Females
- Unemployment rate for Hispanic or Latino residents
- 9.0%Males
- 6.8%Females
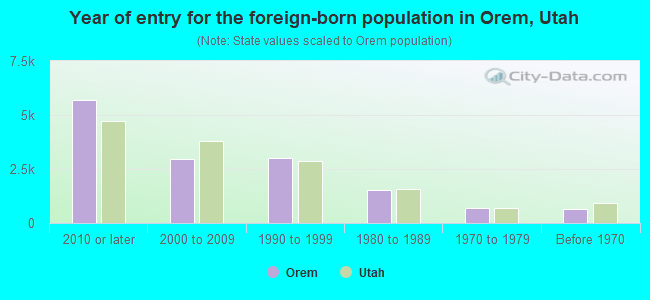
- Year of entry for the foreign-born population in Orem, Utah
- 5,6842010 or later
- 2,9782000 to 2009
- 3,0011990 to 1999
- 1,5121980 to 1989
- 7171970 to 1979
- 653Before 1970

First ancestries reported:
- English: 13,043 (27.3%)
- European: 3,404 (7.1%)
- American: 2,847 (6.0%)
- German: 2,074 (4.3%)
- Italian: 1,024 (2.1%)
- Scottish: 796 (1.7%)
- Danish: 698 (1.5%)
- Irish: 625 (1.3%)
- Welsh: 604 (1.3%)
- Norwegian: 591 (1.2%)
- Scandinavian: 497 (1.0%)
- Swedish: 457 (1.0%)
- British: 438 (0.9%)
- Dutch: 357 (0.7%)
- Swiss: 308 (0.6%)
- Polish: 268 (0.6%)
- Brazilian: 252 (0.5%)
- Northern European: 214 (0.4%)
- French: 171 (0.4%)
- Nigerian: 165 (0.3%)
- Canadian: 150 (0.3%)
- Scotch-Irish: 146 (0.3%)
- Haitian: 130 (0.3%)
- African: 129 (0.3%)
- Arab: 124 (0.3%)
- Cape Verdean: 108 (0.2%)
- Ukrainian: 92 (0.2%)
- Finnish: 80 (0.2%)
- Russian: 78 (0.2%)
- Greek: 72 (0.2%)
- French Canadian: 61 (0.1%)
- Austrian: 59 (0.1%)
- Armenian: 59 (0.1%)
- Portuguese: 51 (0.1%)
- Iranian: 49 (0.1%)
- Slovak: 26 (0.05%)
- Czech: 22 (0.05%)
- Lithuanian: 17 (0.04%)
- Ethiopian: 17 (0.04%)
- Ghanaian: 17 (0.04%)
- South African: 17 (0.04%)
- Belizean: 11 (0.02%)
- Celtic: 10 (0.02%)
- Latvian: 9 (0.02%)
- Hungarian: 8 (0.02%)
- Croatian: 6 (0.01%)
- Palestinian: 5 (0.01%)
Most common places of birth for foreign-born residents (%):
| Orem: | 38.4% (4,758) |
| Utah: | 36.1% (99,740) |
| Orem: | 9.2% (1,138) |
| Utah: | 2.9% (7,901) |
| Orem: | 5.6% (696) |
| Utah: | 2.8% (7,644) |
| Orem: | 5.4% (664) |
| Utah: | 1.3% (3,479) |
| Orem: | 4.8% (600) |
| Utah: | 3.2% (8,804) |
| Orem: | 3.4% (416) |
| Utah: | 3.0% (8,341) |
| Orem: | 2.0% (250) |
| Utah: | 1.6% (4,524) |
| Orem: | 1.7% (211) |
| Utah: | 2.9% (8,017) |
| Orem: | 1.7% (206) |
| Utah: | 0.1% (257) |
| Orem: | 1.6% (202) |
| Utah: | 2.1% (5,902) |
| Orem: | 1.6% (198) |
| Utah: | 2.0% (5,555) |
| Orem: | 1.5% (188) |
| Utah: | 0.7% (1,957) |
Place of birth for U.S.-born residents:
- This state: 53,942
- Other state: 29,311
- Northeast: 1,850
- Midwest: 3,901
- South: 4,675
- West: 18,885
77.8% of Orem residents lived in the same house 1 years ago.
Out of people who lived in different houses, 40.9% lived in this county.
Out of people who lived in different counties, 51.9% lived in Utah.
| Orem: | 77.8% |
| State average: | 85.7% |
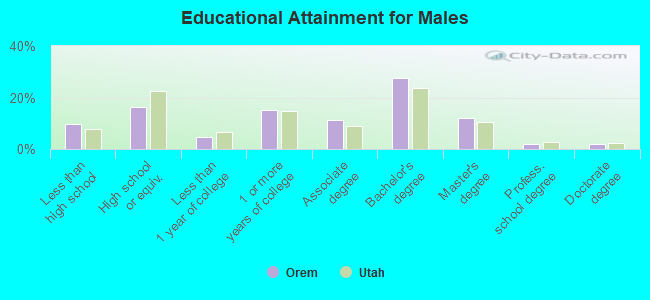
Education attainment for males 25 years and older:
- No schooling: 295
- Nursery to 4th grade: 145
- 5th and 6th grade: 242
- 7th and 8th grade: 246
- 9th grade: 49
- 10th grade: 34
- 11th grade: 290
- 12th grade, no diploma: 1,313
- High school graduate (or equivalency): 4,397
- Less than 1 year of college: 1,221
- Some college more than 1 year, no degree: 4,108
- Associate degree: 3,097
- Bachelor's degree: 7,419
- Master's degree: 3,233
- Professional school degree: 487
- Doctorate degree: 523
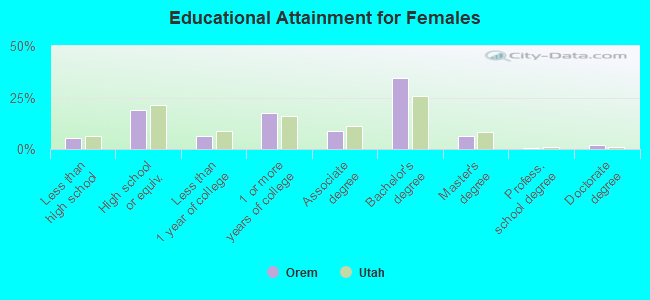
Education attainment for females 25 years and older:
- No schooling: 135
- Nursery to 4th grade: 0
- 5th and 6th grade: 129
- 7th and 8th grade: 300
- 9th grade: 45
- 10th grade: 65
- 11th grade: 132
- 12th grade, no diploma: 605
- High school graduate (or equivalency): 5,107
- Less than 1 year of college: 1,744
- Some college more than 1 year, no degree: 4,612
- Associate degree: 2,370
- Bachelor's degree: 9,262
- Master's degree: 1,630
- Professional school degree: 89
- Doctorate degree: 502
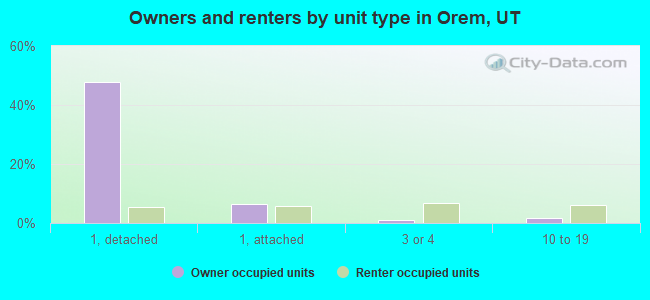
Housing units in structures:
- One, detached: 17,206
- One, attached: 3,354
- Two: 899
- 3 or 4: 3,006
- 5 to 9: 1,221
- 10 to 19: 2,462
- 20 to 49: 390
- 50 or more: 3,708
- Mobile homes: 516
Median worth of mobile homes: $65,700
Housing units lacking complete kitchen facilities in 2022: 1.4%
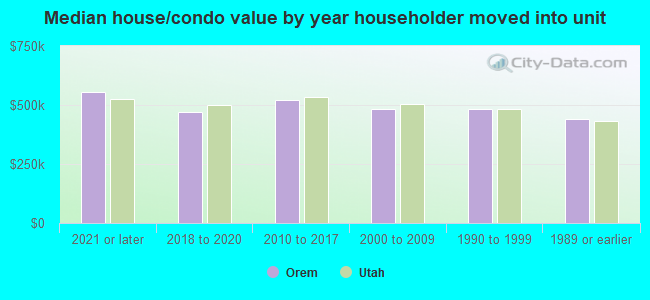
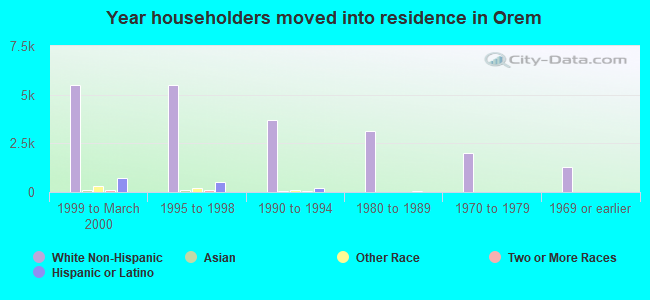
House/condo owner moved in on average 10 years ago
Renter moved in on average 0 years ago
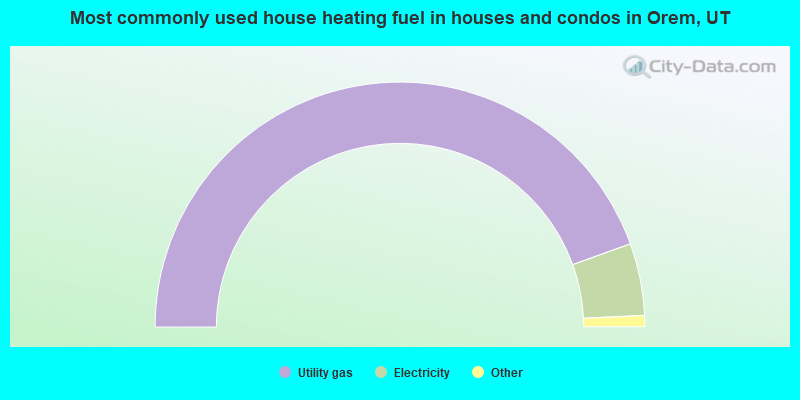
- 89.0%Utility gas
- 9.5%Electricity
- 0.8%Bottled, tank, or LP gas
- 0.4%Solar energy
- 0.2%Wood
- 0.1%Other fuel
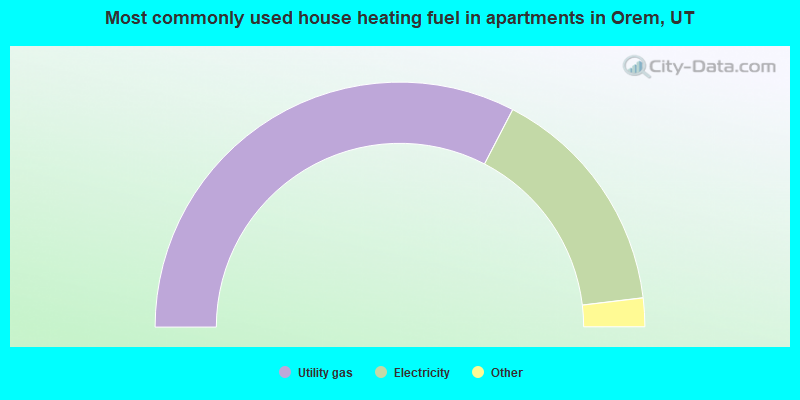
- 65.3%Utility gas
- 31.0%Electricity
- 3.0%Bottled, tank, or LP gas
- 0.4%No fuel used
- 0.2%Coal or coke
- 0.2%Other fuel
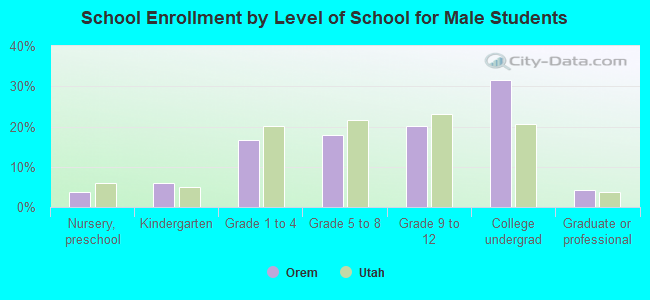
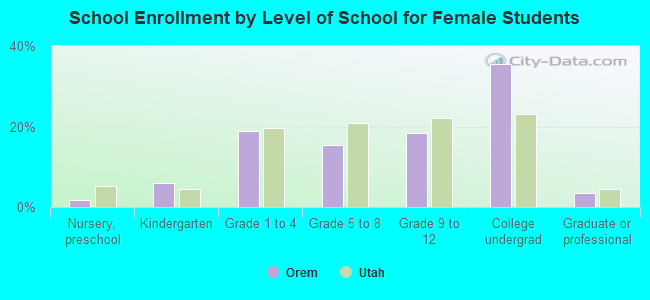
Private vs. public school enrollment:
| Here: | 16.6% |
| Utah: | 7.2% |
| Here: | 5.8% |
| Utah: | 5.3% |
| Here: | 26.2% |
| Utah: | 26.7% |