Osborne, PA (Pennsylvania) Houses and Residents
| Osborne: | $545,090 |
| Pennsylvania: | $245,500 |
Total population: 539 (All urban)
Houses: 228 (220 occupied: 206 owner occupied, 14 renter occupied)
| % of renters here: | 6% |
| State: | 31% |
Housing density: 509 houses/condos per square mile
Median price asked for vacant for-sale houses and condos in 2022 in this county: $195,117.
Median contract rent in 2022: $1,397 (lower quartile is $594, upper quartile is over $2,000)
Median gross rent in Osborne, PA in 2022: $1,747
Housing units in Osborne with a mortgage: 117 (16 second mortgage, 27 home equity loan, 0 both second mortgage and home equity loan)
Houses without a mortgage: 78


Latest news about housing in Osborne, PA collected exclusively by city-data.com from local newspapers, TV, and radio stations

 | Moving from Boston, Help us Pick an Area (23 replies) |
| Moving to Area, Looking at Meyers Ridge TownHomes (14 replies) |
| Moving to Pittsburgh area from Rockville, Md. Any similar areas? (34 replies) |
| Relocating North Pittsburgh (14 replies) |
| Suburb of the week: Sewickley (22 replies) |
| Relocating to Moon Township area (14 replies) |
Household type by relationship:
Households: 1,188,294- In family households: 913,516 (208,635 male householders, 99,374 female householders)
222,332 spouses, 315,393 children (298,168 natural, 7,619 adopted, 9,606 stepchildren), 18,457 grandchildren, 9,985 brothers or sisters, 8,652 parents, foster children, 7,846 other relatives, 18,452 non-relatives
- In nonfamily households: 274,778 (100,758 male householders (79,382 living alone)), 125,193 female householders (107,576 living alone)), 48,827 nonrelatives
- In group quarters: 35,054 (13,287 institutionalized population)
186,963 married couples with children.
71,829 single-parent households (11,403 men, 60,426 women).
97.9% of residents of Osborne speak English at home.
0.4% of residents speak Spanish at home (100% speak English very well).
1.7% of residents speak other Indo-European language at home (78% speak English very well, 22% speak English well).
Foreign born population: 29 (5.3%)
(55.2% of them are naturalized citizens)
| Here: | 7.8 |
| State: | 6.8 |
| Here: | 6.1 |
| State: | 4.3 |
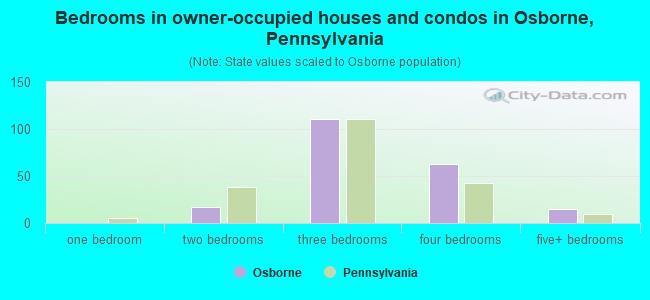
- Bedrooms in owner-occupied houses and condos in Osborne, Pennsylvania
- 0no bedroom
- 01 bedroom
- 172 bedrooms
- 1113 bedrooms
- 634 bedrooms
- 155+ bedrooms
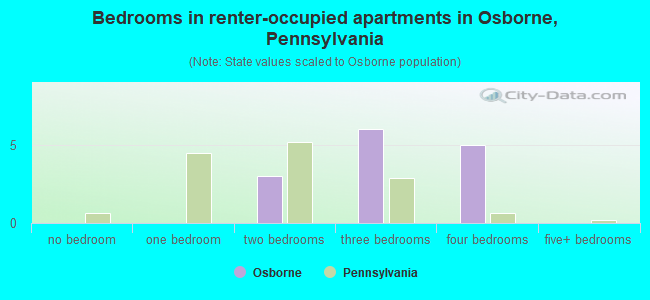
- Bedrooms in renter-occupied apartments in Osborne, Pennsylvania
- 0no bedroom
- 01 bedroom
- 32 bedrooms
- 63 bedrooms
- 54 bedrooms
- 05+ bedrooms
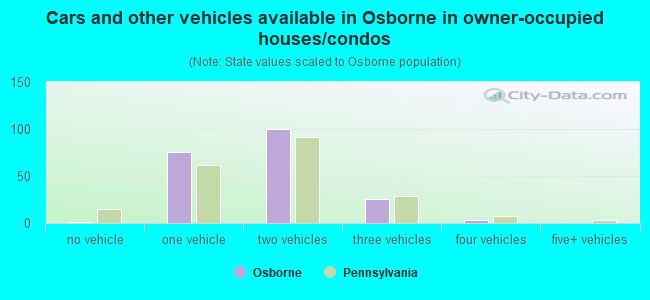
- Cars and other vehicles available in Osborne in owner-occupied houses/condos
- 1no vehicle
- 761 vehicle
- 1002 vehicles
- 263 vehicles
- 34 vehicles
- 05+ vehicles
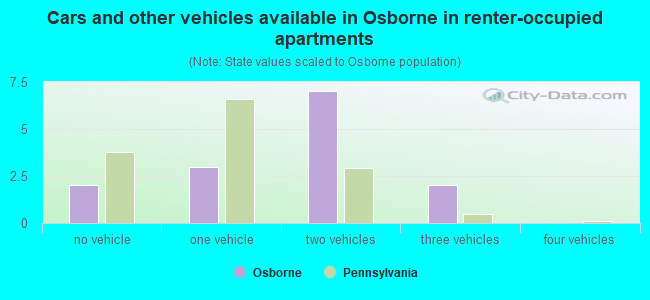
- Cars and other vehicles available in Osborne in renter-occupied apartments
- 2no vehicle
- 31 vehicle
- 72 vehicles
- 23 vehicles
- 04 vehicles
- 05+ vehicles
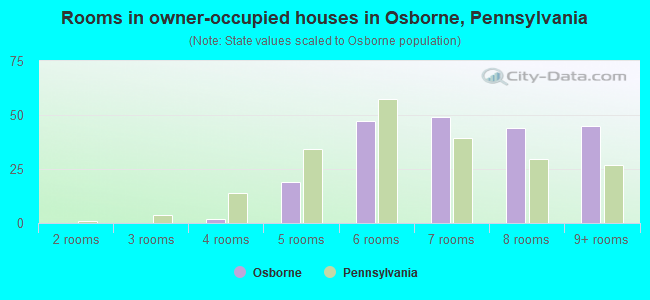
- Rooms in owner-occupied houses in Osborne, Pennsylvania
- 01 room
- 02 rooms
- 03 rooms
- 24 rooms
- 195 rooms
- 476 rooms
- 497 rooms
- 448 rooms
- 459+ rooms
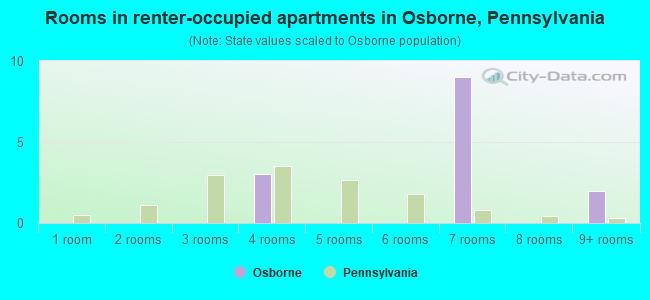
- Rooms in renter-occupied apartments in Osborne, Pennsylvania
- 01 room
- 02 rooms
- 03 rooms
- 34 rooms
- 05 rooms
- 06 rooms
- 97 rooms
- 08 rooms
- 29+ rooms
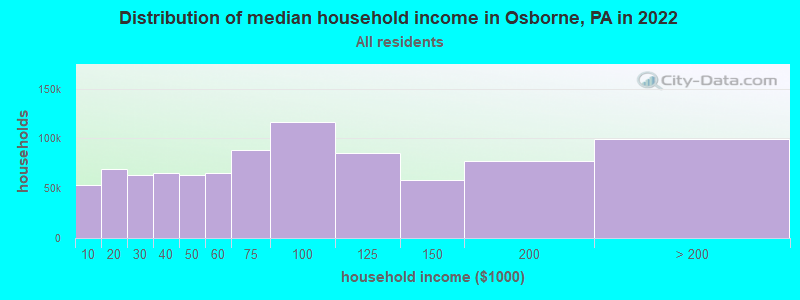
Osborne, PA household income distribution

- 53,122Less than $10,000
- 69,709$10,000 to $19,999
- 63,425$20,000 to $29,999
- 65,648$30,000 to $39,999
- 63,098$40,000 to $49,999
- 65,250$50,000 to $59,999
- 88,352$60,000 to $74,999
- 116,504$75,000 to $99,999
- 85,020$100,000 to $124,999
- 58,322$125,000 to $149,999
- 77,674$150,000 to $199,999
- 99,146$200,000 or more
Percentage of workers working in this county: 89.1%
Number of people working at home: 59 (20.7% of all workers)
Travel time to work (commute)
- Less than 5 minutes: 4
- 5 to 9 minutes: 29
- 10 to 14 minutes: 16
- 15 to 19 minutes: 36
- 20 to 24 minutes: 38
- 25 to 29 minutes: 29
- 30 to 34 minutes: 49
- 35 to 39 minutes: 13
- 40 to 44 minutes: 12
- 45 to 59 minutes: 12
- 60 to 89 minutes: 8
- 90 or more minutes: 2
Means of transportation to work:
- Drove a car alone: 227 (85.7%)
- Carpooled: 5 (1.9%)
- Bus or trolley bus: 11 (4.2%)
- Walked: 5 (1.9%)
- Worked at home: 17 (6.4%)
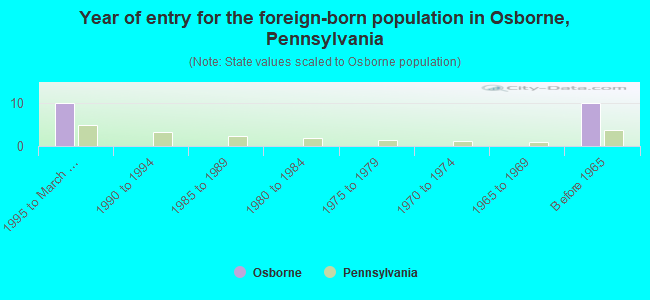
- Year of entry for the foreign-born population in Osborne, Pennsylvania
- 101995 to March 2000
- 01990 to 1994
- 01985 to 1989
- 01980 to 1984
- 01975 to 1979
- 01970 to 1974
- 01965 to 1969
- 10Before 1965
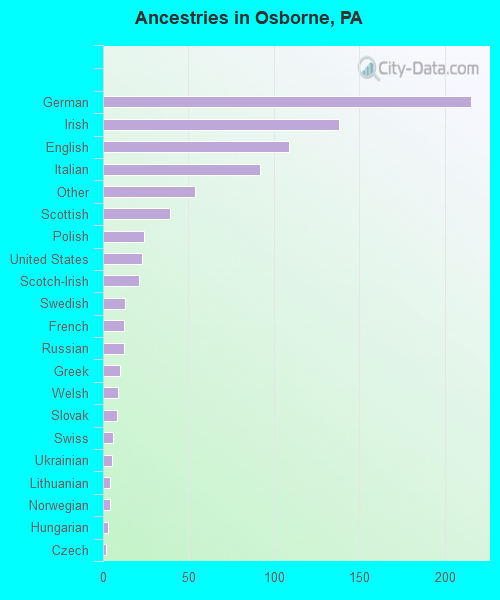
First ancestries reported:
- German: 215 (26.8%)
- Irish: 138 (17.2%)
- English: 109 (13.6%)
- Italian: 92 (11.5%)
- Other: 54 (6.7%)
- Scottish: 39 (4.9%)
- Polish: 24 (3.0%)
- United States: 23 (2.9%)
- Scotch-Irish: 21 (2.6%)
- Swedish: 13 (1.6%)
- French: 12 (1.5%)
- Russian: 12 (1.5%)
- Greek: 10 (1.2%)
- Welsh: 9 (1.1%)
- Slovak: 8 (1.0%)
- Swiss: 6 (0.7%)
- Ukrainian: 5 (0.6%)
- Lithuanian: 4 (0.5%)
- Norwegian: 4 (0.5%)
- Hungarian: 3 (0.4%)
- Czech: 2 (0.2%)
Most common places of birth for foreign-born residents (%):
| Osborne: | 40.0% (8) |
| Pennsylvania: | 4.6% (23,171) |
| Osborne: | 25.0% (5) |
| Pennsylvania: | 2.7% (13,885) |
| Osborne: | 25.0% (5) |
| Pennsylvania: | 3.0% (15,200) |
| Osborne: | 10.0% (2) |
| Pennsylvania: | 6.0% (30,559) |
Place of birth for U.S.-born residents:
- This state: 402
- Other state: 145
- Northeast: 38
- Midwest: 55
- South: 52
- West: 0
66% of Osborne residents lived in the same house 5 years ago.
Out of people who lived in different houses, 70% lived in this county.
Out of people who lived in different counties, 63% lived in Pennsylvania.
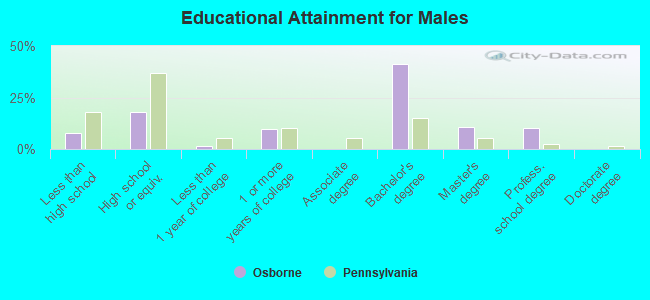
Education attainment for males 25 years and older:
- No schooling: 0
- Nursery to 4th grade: 0
- 5th and 6th grade: 0
- 7th and 8th grade: 2
- 9th grade: 0
- 10th grade: 2
- 11th grade: 11
- 12th grade, no diploma: 0
- High school graduate (or equivalency): 35
- Less than 1 year of college: 3
- Some college more than 1 year, no degree: 19
- Associate degree: 0
- Bachelor's degree: 80
- Master's degree: 21
- Professional school degree: 20
- Doctorate degree: 0
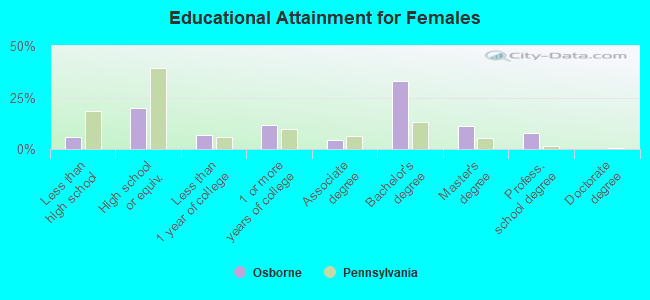
Education attainment for females 25 years and older:
- No schooling: 5
- Nursery to 4th grade: 0
- 5th and 6th grade: 0
- 7th and 8th grade: 2
- 9th grade: 0
- 10th grade: 1
- 11th grade: 4
- 12th grade, no diploma: 0
- High school graduate (or equivalency): 41
- Less than 1 year of college: 14
- Some college more than 1 year, no degree: 24
- Associate degree: 9
- Bachelor's degree: 68
- Master's degree: 23
- Professional school degree: 16
- Doctorate degree: 0
Housing units in structures:
- One, detached: 218
- One, attached: 8
- 3 or 4: 2
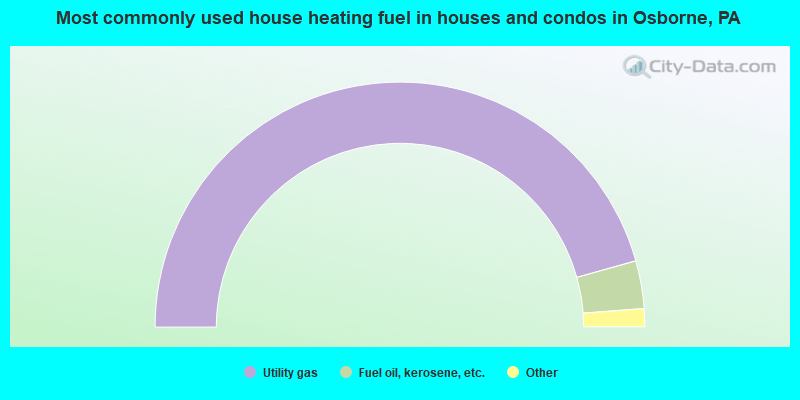
- 91.3%Utility gas
- 6.3%Fuel oil, kerosene, etc.
- 1.5%Bottled, tank, or LP gas
- 1.0%Electricity
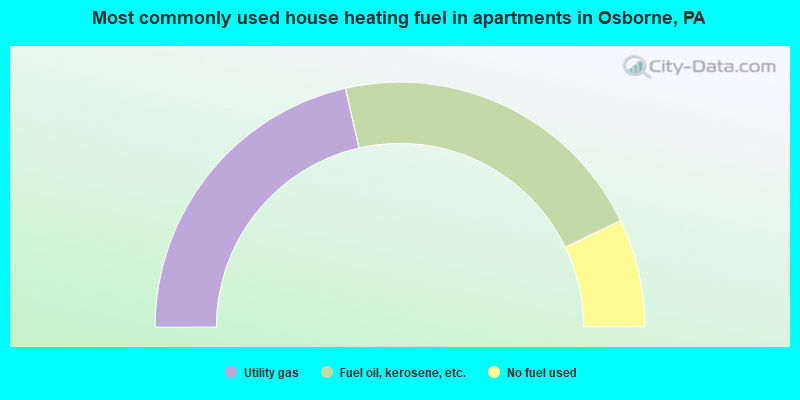
- 42.9%Utility gas
- 42.9%Fuel oil, kerosene, etc.
- 14.3%No fuel used
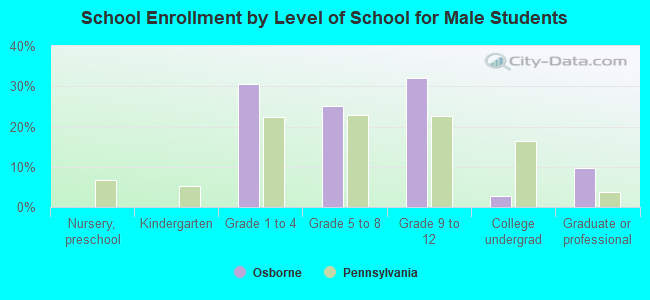
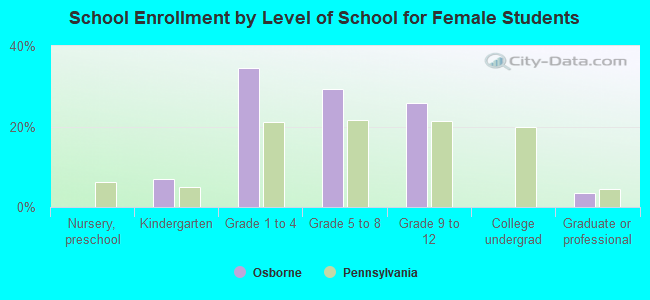
Private vs. public school enrollment:
| Here: | 9.1% |
| Pennsylvania: | 16.0% |
| Here: | 7.9% |
| Pennsylvania: | 13.1% |
| Here: | 0.0% |
| Pennsylvania: | 37.3% |