Palmyra, PA (Pennsylvania) Houses and Residents
Estimated median house or condo value in 2022: $208,669 (it was $93,200 in 2000 )
Palmyra:
$208,669Pennsylvania:
$245,500
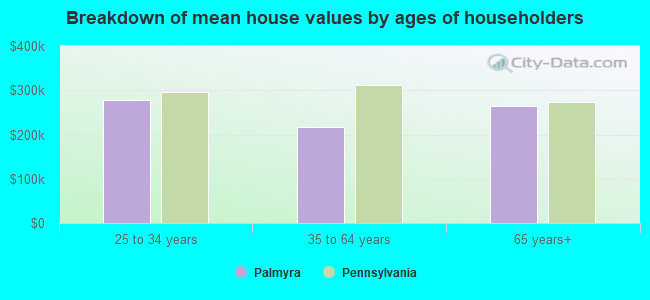
Lower value quartile - upper value quartile: $158,610 - $282,841Mean price in 2022: Detached houses: $236,355 Here:
$236,355State:
$317,202
Townhouses or other attached units: $191,534 Here:
$191,534State:
$254,369
In 2-unit structures: $270,243 Here:
$270,243State:
$249,182
Mobile homes: $103,087 Here:
$103,087State:
$92,414
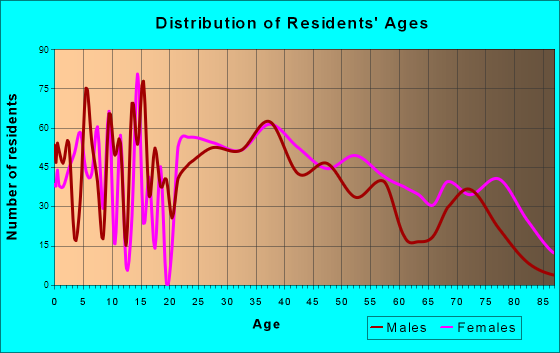
Total population: 7,436 (Urban population: 7,096, Rural population: 0)
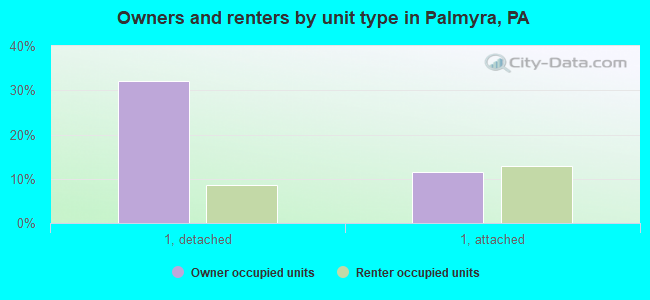
Houses: 3,152 (3,019 occupied: 1,535 owner occupied, 1,443 renter occupied )
% of renters here:
48%State:
31%
Housing density: 1,694 houses/condos per square mile
Median price asked for vacant for-sale houses and condos in 2022: $258,356.
Median contract rent in 2022: $933 (lower quartile is $711, upper quartile is $1,209)
Median rent asked for vacant for-rent units in 2022: $3,701
Median gross rent in Palmyra, PA in 2022: $1,049
Housing units in Palmyra with a mortgage: 1,049 (97 second mortgage, 0 home equity loan, 83 both second mortgage and home equity loan )Houses without a mortgage: 22
Median household income for houses/condos with a mortgage: $94,595
Median household income for apartments without a mortgage: $55,477
Median monthly housing costs: $1,115
Data:
Median house or condo value ($)
Median house or condo value ($ change since 2000)
Median house or condo value ($) - White
Median house or condo value ($) - Black or African American
Median house or condo value ($) - Asian
Median house or condo value ($) - Hispanic or Latino
Median house or condo value ($) - American Indian and Alaska Native
Median house or condo value ($) - Multirace
Median house or condo value ($) - Other Race
Median price asked for mobile homes ($)
Household density (households per square mile)
Mean house or condo value by units in structure - 1, detached ($)
Mean house or condo value by units in structure - 1, attached ($)
Mean house or condo value by units in structure - 2 ($)
Mean house or condo value by units in structure by units in structure - 3 or 4 ($)
Mean house or condo value by units in structure - 5 or more ($)
Mean house or condo value by units in structure - Boat, RV, van, etc. ($)
Mean house or condo value by units in structure - Mobile home ($)
Median contract rent ($)
Median contract rent - Lower quartile ($)
Median contract rent - Upper quartile ($)
Median gross rent ($)
Urban houses (%)
Rural houses (%)
Houses occupied (%)
Houses occupied (% change since 2000)
Houses owner occupied (%)
Houses owner occupied (% change since 2000)
Houses renter occupied (%)
Houses renter occupied (% change since 2000)
Vacant housing units - For rent (%)
Vacant housing units - For rent (% change since 2000)
Vacant housing units - For sale only (%)
Vacant housing units - For sale only (% change since 2000)
Vacant housing units - Rented or sold, not occupied (%)
Vacant housing units - Rented or sold, not occupied (% change since 2000)
Vacant housing units - For seasonal, recreational, or occasional use (%)
Vacant housing units - For seasonal, recreational, or occasional use (% change since 2000)
Vacant housing units - For migrant workers (%)
Vacant housing units - For migrant workers (% change since 2000)
Vacant housing units - Other vacant (%)
Vacant housing units - Other vacant (% change since 2000)
Median monthly housing costs ($)
Median household income for houses/condos with a mortgage ($)
Median household income for houses/condos without a mortgage ($)
Median household income ($)
Median household income ($) - White
Median household income ($) - Black or African American
Median household income ($) - Asian
Median household income ($) - Hispanic or Latino
Median household income ($) - American Indian and Alaska Native
Median household income ($) - Multirace
Median household income ($) - Other Race
Mortgage status - with mortgage (%)
Mortgage status - with second mortgage (%)
Mortgage status - with home equity loan (%)
Mortgage status - with both second mortgage and home equity loan (%)
Mortgage status - without a mortgage (%)
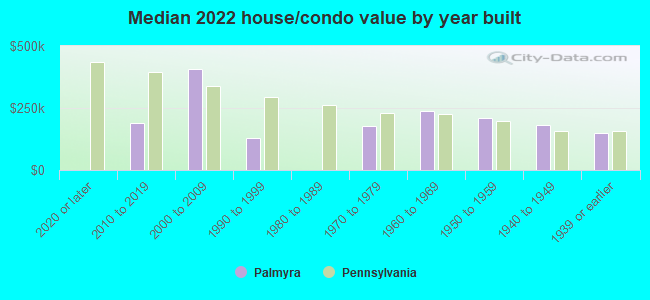
Median year house/condo built
Median year apartment built
Household type by relationship - Male householder living alone (%)
Household type by relationship - Male householder not living alone (%)
Household type by relationship - Female householder living alone (%)
Household type by relationship - Female householder not living alone (%)
Household type by relationship - Opposite-Sex spouse (%)
Household type by relationship - Same-Sex spouse (%)
Household type by relationship - Opposite-Sex unmarried partner (%)
Household type by relationship - Same-Sex unmarried partner (%)
Household type by relationship - In group quarters (%)
Size of family households - 2-person household (%)
Size of family households - 3-person household (%)
Size of family households - 4-person household (%)
Size of family households - 5-person household (%)
Size of family households - 6-person household (%)
Size of family households - 7-or-more-person household (%)
Size of nonfamily households - 1-person household (%)
Size of nonfamily households - 2-person household (%)
Size of nonfamily households - 3-person household (%)
Size of nonfamily households - 4-person household (%)
Size of nonfamily households - 5-person household (%)
Size of nonfamily households - 6-person household (%)
Size of nonfamily households - 7-or-moreperson household (%)
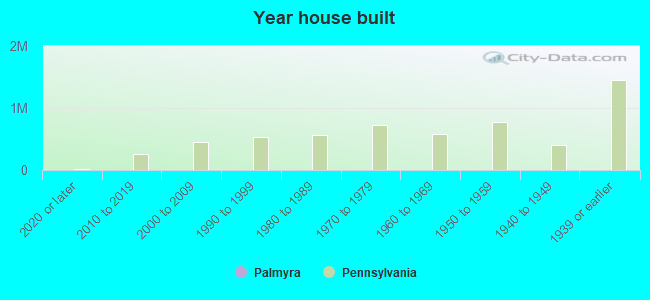
Year house built - Built 2010 or later (%)
Year house built - Built 2000 to 2009 (%)
Year house built - Built 1990 to 1999 (%)
Year house built - Built 1980 to 1989 (%)
Year house built - Built 1970 to 1979 (%)
Year house built - Built 1960 to 1969 (%)
Year house built - Built 1950 to 1959 (%)
Year house built - Built 1940 to 1949 (%)
Year house built - Built 1939 or earlier (%)
Median number of rooms in houses and condos
Median number of rooms in apartments
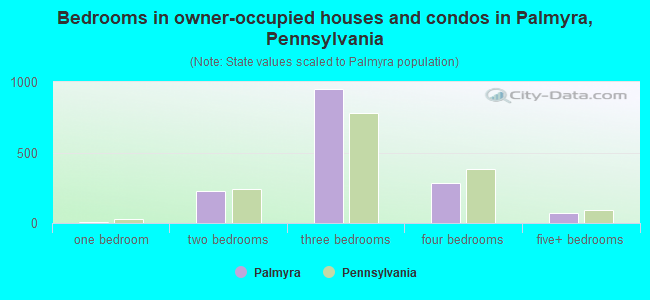
Median number of bedrooms in owner occupied houses
Mean number of bedrooms in owner occupied houses
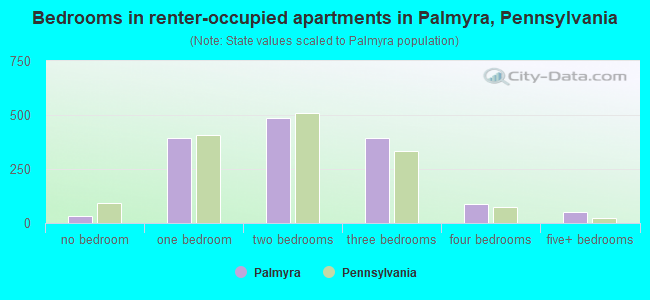
Median number of bedrooms in renter occupied houses
Mean number of bedrooms in renter occupied houses
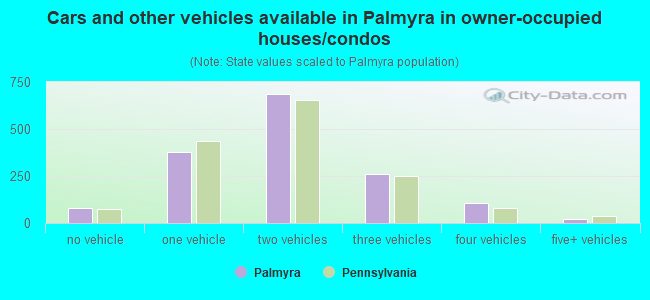
Median number of vehichles in owner occupied houses
Mean number of vehichles in owner occupied houses
Median number of vehichles in renter occupied houses
Mean number of vehichles in renter occupied houses
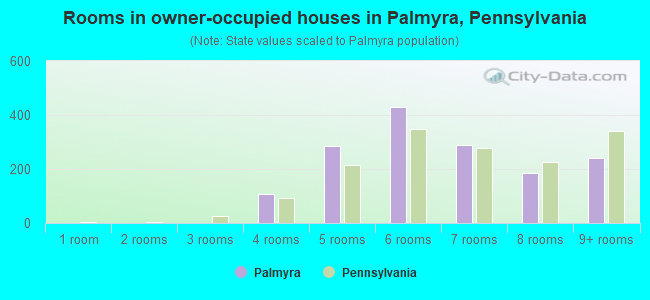
Rooms in owner-occupied houses - 1 room (%)
Rooms in owner-occupied houses - 2 rooms (%)
Rooms in owner-occupied houses - 3 rooms (%)
Rooms in owner-occupied houses - 4 rooms (%)
Rooms in owner-occupied houses - 5 rooms (%)
Rooms in owner-occupied houses - 6 rooms (%)
Rooms in owner-occupied houses - 7 rooms (%)
Rooms in owner-occupied houses - 8 rooms (%)
Rooms in owner-occupied houses - 9+ rooms (%)
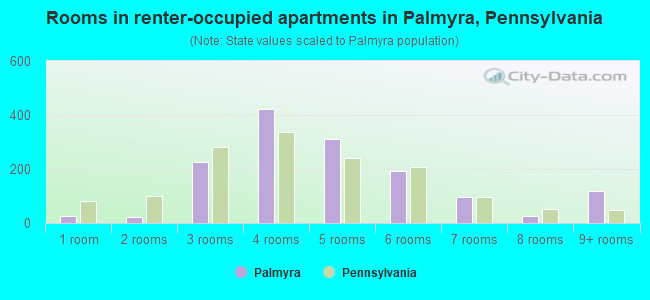
Rooms in renter-occupied houses - 1 room (%)
Rooms in renter-occupied houses - 2 rooms (%)
Rooms in renter-occupied houses - 3 rooms (%)
Rooms in renter-occupied houses - 4 rooms (%)
Rooms in renter-occupied houses - 5 rooms (%)
Rooms in renter-occupied houses - 6 rooms (%)
Rooms in renter-occupied houses - 7 rooms (%)
Rooms in renter-occupied houses - 8 rooms (%)
Rooms in renter-occupied houses - 9+ rooms (%)
Bedrooms in owner-occupied houses - no bedrooms (%)
Bedrooms in owner-occupied houses - 1 bedroom (%)
Bedrooms in owner-occupied houses - 2 bedrooms (%)
Bedrooms in owner-occupied houses - 3 bedrooms (%)
Bedrooms in owner-occupied houses - 4 bedrooms (%)
Bedrooms in owner-occupied houses - 5+ bedrooms (%)
Bedrooms in renter-occupied houses - no bedrooms (%)
Bedrooms in renter-occupied houses - 1 bedroom (%)
Bedrooms in renter-occupied houses - 2 bedrooms (%)
Bedrooms in renter-occupied houses - 3 bedrooms (%)
Bedrooms in renter-occupied houses - 4 bedrooms (%)
Bedrooms in renter-occupied houses - 5+ bedrooms (%)
Vehicles available in owner-occupied houses - no vehicle available (%)
Vehicles available in owner-occupied houses - 1 vehicle available(%)
Vehicles available in owner-occupied houses - 2 Vehicles available (%)
Vehicles available in owner-occupied houses - 3 Vehicles available (%)
Vehicles available in owner-occupied houses - 4 Vehicles available (%)
Vehicles available in owner-occupied houses - 5+ Vehicles available (%)
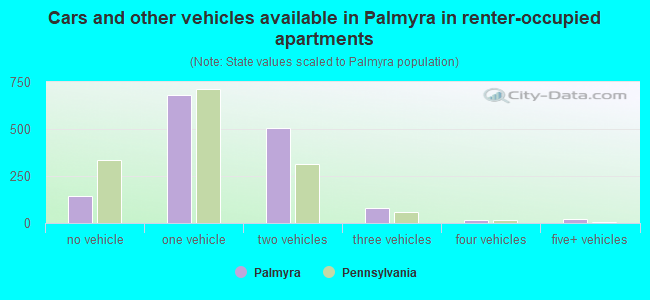
Vehicles available in renter-occupied houses - no vehicle available (%)
Vehicles available in renter-occupied houses - 1 vehicle available (%)
Vehicles available in renter-occupied houses - 2 Vehicles available (%)
Vehicles available in renter-occupied houses - 3 Vehicles available (%)
Vehicles available in renter-occupied houses - 4 Vehicles available (%)
Vehicles available in renter-occupied houses - 5+ Vehicles available (%)
Housing units in structures - 1, detached (%)
Housing units in structures - 1, attached (%)
Housing units in structures - 2 (%)
Housing units in structures - 3 or 4 (%)
Housing units in structures - 5 to 9 (%)
Housing units in structures - 10 to 19 (%)
Housing units in structures - 20 to 49 (%)
Housing units in structures - 50 or more (%)
Housing units in structures - Mobile home (%)
Housing units in structures - Boat, RV, van, etc. (%)
Housing units in structures - Owners - 1, detached (%)
Housing units in structures - Owners - 1, attached (%)
Housing units in structures - Owners - 2 (%)
Housing units in structures - Owners - 3 or 4 (%)
Housing units in structures - Owners - 5 to 9 (%)
Housing units in structures - Owners - 10 to 19 (%)
Housing units in structures - Owners - 20 to 49 (%)
Housing units in structures - Owners - 50 or more (%)
Housing units in structures - Owners - Mobile home (%)
Housing units in structures - Owners - Boat, RV, van, etc. (%)
Housing units in structures - Renters - 1, detached (%)
Housing units in structures - Renters - 1, attached (%)
Housing units in structures - Renters - 2 (%)
Housing units in structures - Renters - 3 or 4 (%)
Housing units in structures - Renters - 5 to 9 (%)
Housing units in structures - Renters - 10 to 19 (%)
Housing units in structures - Renters - 20 to 49 (%)
Housing units in structures - Renters - 50 or more (%)
Housing units in structures - Renters - Mobile home (%)
Housing units in structures - Renters - Boat, RV, van, etc. (%)
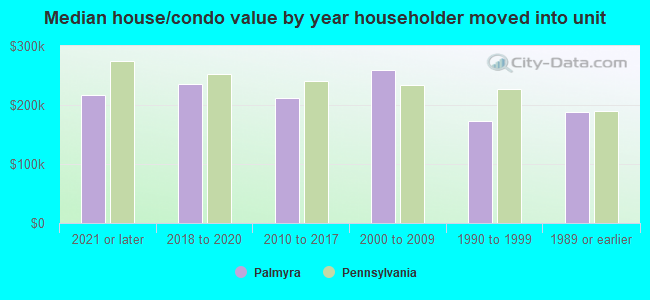
House/condo owner moved in on average (years ago)
Renter moved in on average (years ago)
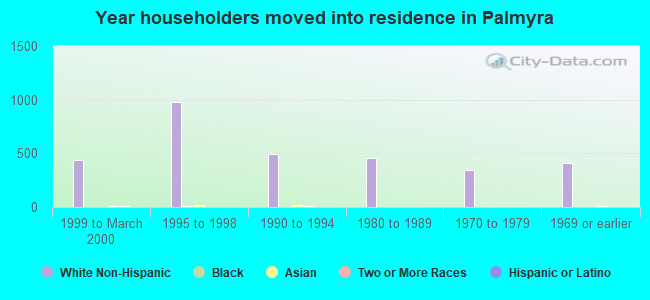
Year householder moved into unit - Moved in 1999 to March 2000 (%)
Year householder moved into unit - Moved in 1999 to March 2000 (%) - White
Year householder moved into unit - Moved in 1999 to March 2000 (%) - Black or African American
Year householder moved into unit - Moved in 1999 to March 2000 (%) - Asian
Year householder moved into unit - Moved in 1999 to March 2000 (%) - Hispanic or Latino
Year householder moved into unit - Moved in 1999 to March 2000 (%) - American Indian and Alaska Native
Year householder moved into unit - Moved in 1999 to March 2000 (%) - Multirace
Year householder moved into unit - Moved in 1999 to March 2000 (%) - Other Race
Year householder moved into unit - Moved in 1995 to 1998 (%)
Year householder moved into unit - Moved in 1995 to 1998 (%) - White
Year householder moved into unit - Moved in 1995 to 1998 (%) - Black or African American
Year householder moved into unit - Moved in 1995 to 1998 (%) - Asian
Year householder moved into unit - Moved in 1995 to 1998 (%) - Hispanic or Latino
Year householder moved into unit - Moved in 1995 to 1998 (%) - American Indian and Alaska Native
Year householder moved into unit - Moved in 1995 to 1998 (%) - Multirace
Year householder moved into unit - Moved in 1995 to 1998 (%) - Other Race
Year householder moved into unit - Moved in 1990 to 1994 (%)
Year householder moved into unit - Moved in 1990 to 1994 (%) - White
Year householder moved into unit - Moved in 1990 to 1994 (%) - Black or African American
Year householder moved into unit - Moved in 1990 to 1994 (%) - Asian
Year householder moved into unit - Moved in 1990 to 1994 (%) - Hispanic or Latino
Year householder moved into unit - Moved in 1990 to 1994 (%) - American Indian and Alaska Native
Year householder moved into unit - Moved in 1990 to 1994 (%) - Multirace
Year householder moved into unit - Moved in 1990 to 1994 (%) - Other Race
Year householder moved into unit - Moved in 1980 to 1989 (%)
Year householder moved into unit - Moved in 1980 to 1989 (%) - White
Year householder moved into unit - Moved in 1980 to 1989 (%) - Black or African American
Year householder moved into unit - Moved in 1980 to 1989 (%) - Asian
Year householder moved into unit - Moved in 1980 to 1989 (%) - Hispanic or Latino
Year householder moved into unit - Moved in 1980 to 1989 (%) - American Indian and Alaska Native
Year householder moved into unit - Moved in 1980 to 1989 (%) - Multirace
Year householder moved into unit - Moved in 1980 to 1989 (%) - Other Race
Year householder moved into unit - Moved in 1970 to 1979 (%)
Year householder moved into unit - Moved in 1970 to 1979 (%) - White
Year householder moved into unit - Moved in 1970 to 1979 (%) - Black or African American
Year householder moved into unit - Moved in 1970 to 1979 (%) - Asian
Year householder moved into unit - Moved in 1970 to 1979 (%) - Hispanic or Latino
Year householder moved into unit - Moved in 1970 to 1979 (%) - American Indian and Alaska Native
Year householder moved into unit - Moved in 1970 to 1979 (%) - Multirace
Year householder moved into unit - Moved in 1970 to 1979 (%) - Other Race
Year householder moved into unit - Moved in 1969 or earlier (%)
Year householder moved into unit - Moved in 1969 or earlier (%) - White
Year householder moved into unit - Moved in 1969 or earlier (%) - Black or African American
Year householder moved into unit - Moved in 1969 or earlier (%) - Asian
Year householder moved into unit - Moved in 1969 or earlier (%) - Hispanic or Latino
Year householder moved into unit - Moved in 1969 or earlier (%) - American Indian and Alaska Native
Year householder moved into unit - Moved in 1969 or earlier (%) - Multirace
Year householder moved into unit - Moved in 1969 or earlier (%) - Other Race
Housing units lacking complete plumbing facilities (%)
Housing units lacking complete kitchen facilities (%)
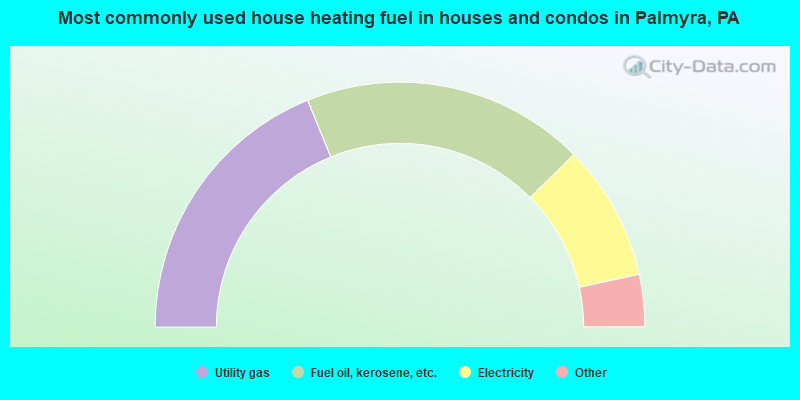
House heating fuel used in houses and condos - Utility gas (%)
House heating fuel used in houses and condos - Bottled, tank, or LP gas (%)
House heating fuel used in houses and condos - Electricity (%)
House heating fuel used in houses and condos - Fuel oil, kerosene, etc. (%)
House heating fuel used in houses and condos - Coal or coke (%)
House heating fuel used in houses and condos - Wood (%)
House heating fuel used in houses and condos - Solar energy (%)
House heating fuel used in houses and condos - Other fuel (%)
House heating fuel used in houses and condos - No fuel used (%)
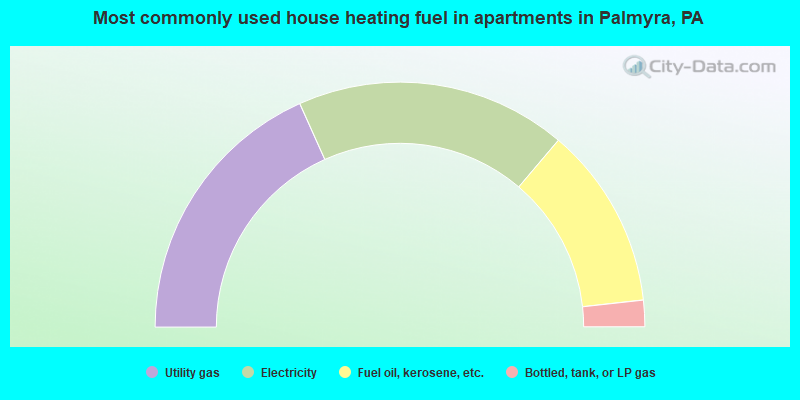
House heating fuel used in apartments - Utility gas (%)
House heating fuel used in apartments - Bottled, tank, or LP gas (%)
House heating fuel used in apartments - Electricity (%)
House heating fuel used in apartments - Fuel oil, kerosene, etc. (%)
House heating fuel used in apartments - Coal or coke (%)
House heating fuel used in apartments - Wood (%)
House heating fuel used in apartments - Solar energy (%)
House heating fuel used in apartments - Other fuel (%)
House heating fuel used in apartments - No fuel used (%)
Latest news about housing in Palmyra, PA collected exclusively by city-data.com from local newspapers, TV, and radio stations
Median year house/condo built: 1959Median year apartment built: 1954Household type by relationship:
Households: 7,823
Male householders: 1,320 (346 living alone ), Female householders: 1,672 (617 living alone )1,176 spouses (1,176 opposite-sex spouses ), 418 unmarried partners , (418 opposite-sex unmarried partners ), 2,590 children (2,371 natural , 102 adopted , 116 stepchildren ), 93 grandchildren , 75 brothers or sisters , 78 parents , 0 foster children , 40 other relatives , 319 non-relatives In group quarters: 38
Size of family households: 747 2-persons , 429 3-persons , 334 4-persons , 205 5-persons , 20 6-persons , 69 7-or-more-persons .
Size of nonfamily households: 952 1-person , 173 2-persons , 29 4-persons .
943 married couples with children. single-parent households (200 men , 518 women ).
88.7% of residents of Palmyra speak English at home. of residents speak Spanish at home (76% speak English very well , 12% speak English well , 12% speak English not well ).of residents speak other Indo-European language at home (84% speak English very well , 12% speak English well , 4% speak English not well ).of residents speak Asian or Pacific Island language at home (26% speak English very well , 57% speak English well , 18% speak English not well ).
Foreign born population: 438 (5.6%)of them are naturalized citizens )
Median number of rooms in houses and condos:
Median number of rooms in apartments
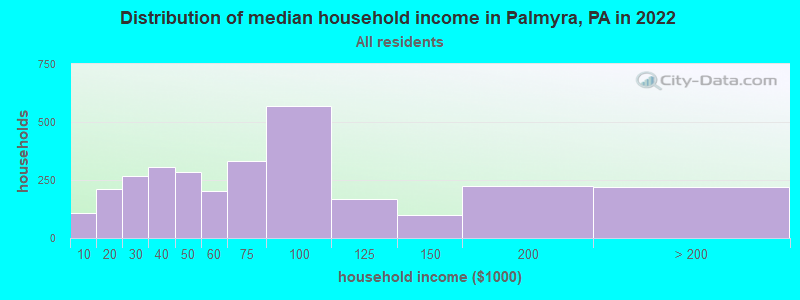
Palmyra, PA household income distribution 106 Less than $10,000212 $10,000 to $19,999269 $20,000 to $29,999308 $30,000 to $39,999286 $40,000 to $49,999202 $50,000 to $59,999332 $60,000 to $74,999568 $75,000 to $99,999168 $100,000 to $124,999100 $125,000 to $149,999226 $150,000 to $199,999218 $200,000 or more
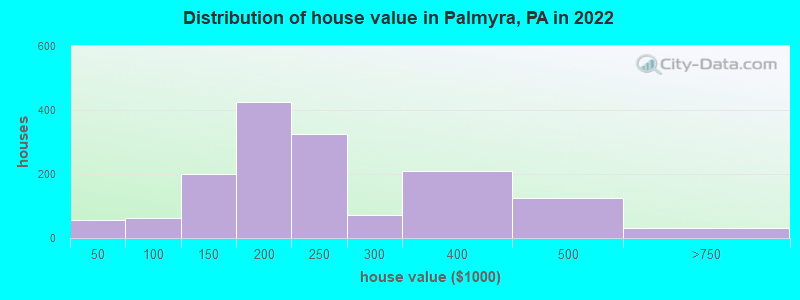
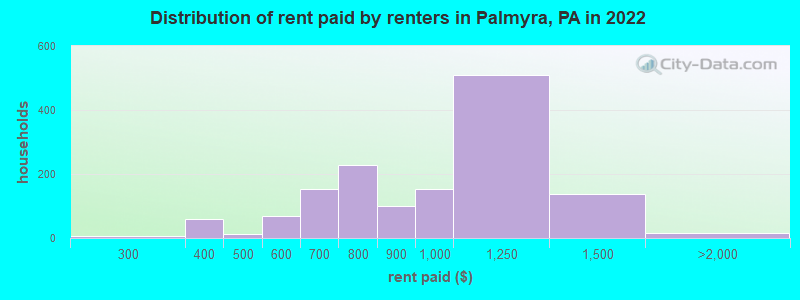
Home value of owner - occupied houses in 2022 in Palmyra, PA 13 Less than $10,00011 $10,000 to $14,99910 $20,000 to $24,9995 $25,000 to $29,99914 $30,000 to $34,9997 $50,000 to $59,99910 $60,000 to $69,9993 $70,000 to $79,99920 $80,000 to $89,99921 $90,000 to $99,99989 $100,000 to $124,999111 $125,000 to $149,999211 $150,000 to $174,999213 $175,000 to $199,999323 $200,000 to $249,99972 $250,000 to $299,999208 $300,000 to $399,999125 $400,000 to $499,99930 $500,000 to $749,999Rent paid by renters in 2022 in Palmyra, PA 5 $250 to $29927 $300 to $34932 $350 to $3999 $400 to $4493 $450 to $49949 $500 to $54919 $550 to $59990 $600 to $64961 $650 to $699147 $700 to $74980 $750 to $799101 $800 to $899153 $900 to $999507 $1,000 to $1,249137 $1,250 to $1,49916 $1,500 to $1,999
Percentage of workers working in this county: 52.9%Number of people working at home: 805 (19.1% of all workers )
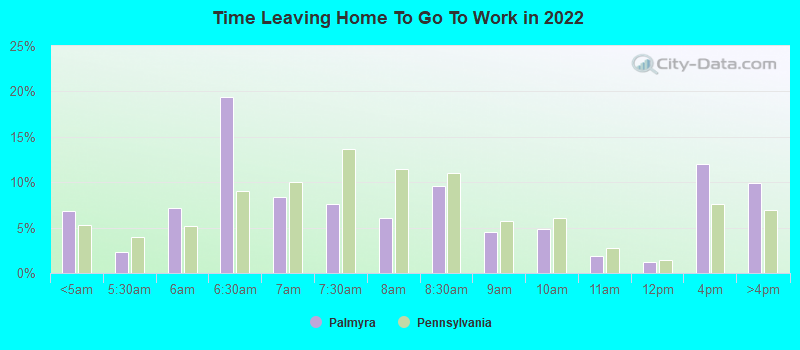
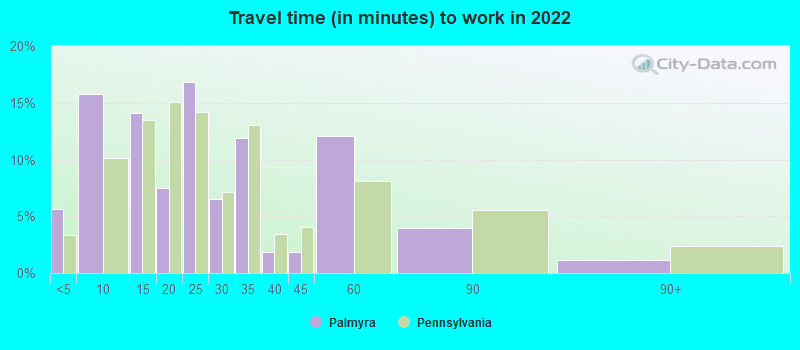
Travel time to work (commute)
Less than 5 minutes: 1265 to 9 minutes: 36010 to 14 minutes: 64115 to 19 minutes: 43720 to 24 minutes: 74325 to 29 minutes: 28230 to 34 minutes: 41835 to 39 minutes: 7840 to 44 minutes: 9245 to 59 minutes: 9960 to 89 minutes: 7490 or more minutes: 33
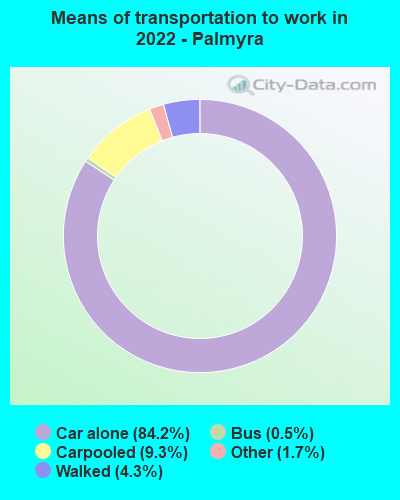
Means of transportation to work:
Drove a car alone: 2,138 (65.2%)Carpooled: 241 (7.3%)Bus : 5 (0.2%)Taxi: 45 (1.4%)Walked: 138 (4.2%)Worked at home: 807 (24.6%)
Unemployment by race in 2022
Unemployment rate for White non-Hispanic residents 5.2% Males1.1% FemalesUnemployment rate for Asian residents 10.5% Males3.5% Females
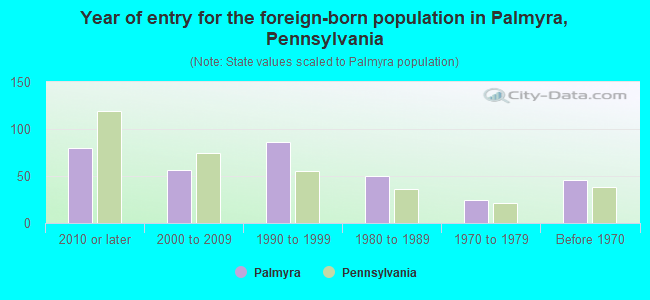
Year of entry for the foreign-born population in Palmyra, Pennsylvania
80 2010 or later 56 2000 to 2009 86 1990 to 1999 50 1980 to 1989 25 1970 to 1979 46 Before 1970
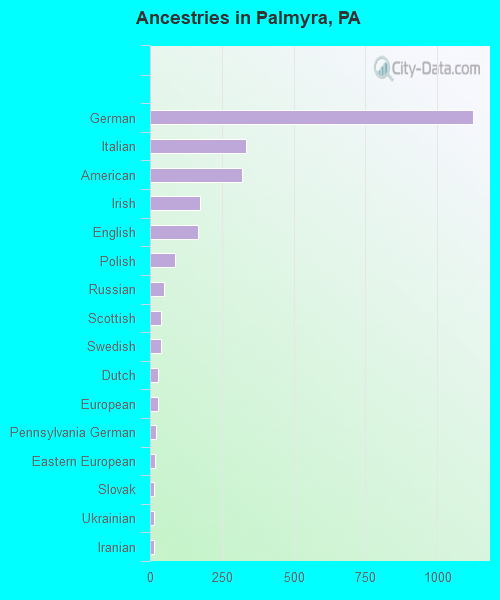
First ancestries reported:
German: 1,124 (33.1%)
Italian: 333 (9.8%)
American: 319 (9.4%)
Irish: 175 (5.2%)
English: 167 (4.9%)
Polish: 86 (2.5%)
Russian: 47 (1.4%)
Scottish: 37 (1.1%)
Swedish: 37 (1.1%)
Dutch: 28 (0.8%)
European: 27 (0.8%)
Pennsylvania German: 22 (0.6%)
Eastern European: 18 (0.5%)
Slovak: 14 (0.4%)
Ukrainian: 14 (0.4%)
Iranian: 13 (0.4%)
Haitian: 10 (0.3%)
Hungarian: 9 (0.3%)
Scotch-Irish: 8 (0.2%)
Welsh: 6 (0.2%)
Carpatho Rusyn: 5 (0.1%)
French: 5 (0.1%) Most common places of birth for foreign-born residents (%): India Palmyra:
25.0% (93)Pennsylvania:
10.7% (100,596)
Dominican Republic Palmyra:
16.1% (60)Pennsylvania:
9.2% (86,544)
Korea Palmyra:
14.5% (54)Pennsylvania:
2.9% (27,433)
Russia Palmyra:
8.3% (31)Pennsylvania:
1.6% (15,272)
Vietnam Palmyra:
8.1% (30)Pennsylvania:
3.3% (31,542)
China, excluding Hong Kong and Taiwan Palmyra:
7.3% (27)Pennsylvania:
7.2% (67,704)
Philippines Palmyra:
5.1% (19)Pennsylvania:
2.2% (21,039)
Ukraine Palmyra:
3.8% (14)Pennsylvania:
2.1% (19,841)
Kazakhstan Palmyra:
3.0% (11)Pennsylvania:
0.1% (1,124)
Thailand Palmyra:
2.7% (10)Pennsylvania:
0.5% (4,593)
Haiti Palmyra:
2.4% (9)Pennsylvania:
1.6% (15,224)
Bhutan Palmyra:
1.9% (7)Pennsylvania:
0.8% (7,882)
Place of birth for U.S.-born residents:
This state: 5,828Other state: 1,469Northeast: 674Midwest: 221South: 497West: 72 86.2% of Palmyra residents lived in the same house 1 years ago.
Out of people who lived in different houses, 44.1% lived in this county.
Out of people who lived in different counties, 63.9% lived in Pennsylvania.
Palmyra:
86.2%State average:
89.3%
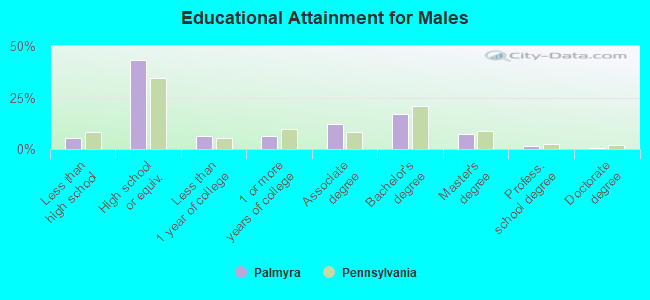
Education attainment for males 25 years and older:
No schooling: 0Nursery to 4th grade: 05th and 6th grade: 07th and 8th grade: 109th grade: 1410th grade: 011th grade: 8412th grade, no diploma: 20High school graduate (or equivalency): 999Less than 1 year of college: 147Some college more than 1 year, no degree: 147Associate degree: 286Bachelor's degree: 391Master's degree: 170Professional school degree: 39Doctorate degree: 6
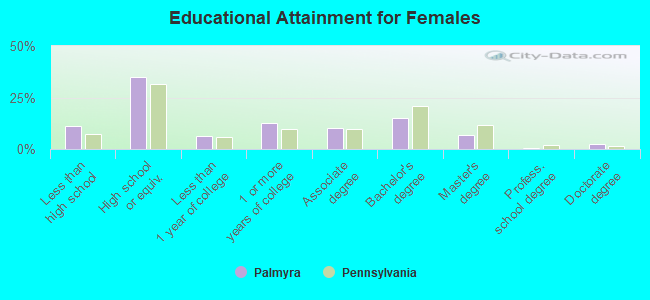
Education attainment for females 25 years and older:
No schooling: 7Nursery to 4th grade: 05th and 6th grade: 07th and 8th grade: 19th grade: 1310th grade: 11711th grade: 2212th grade, no diploma: 136High school graduate (or equivalency): 930Less than 1 year of college: 170Some college more than 1 year, no degree: 335Associate degree: 277Bachelor's degree: 399Master's degree: 184Professional school degree: 17Doctorate degree: 61
Housing units in structures:
One, detached: 1,407One, attached: 649Two: 4133 or 4: 2915 to 9: 10910 to 19: 2420 to 49: 11150 or more: 62Mobile homes: 81Median worth of mobile homes: $135,043
Housing units lacking complete kitchen facilities in 2022: 0.3%House/condo owner moved in on average 11 years ago
Renter moved in on average 2 years ago
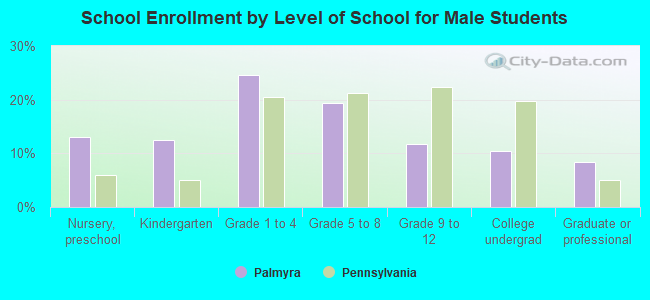
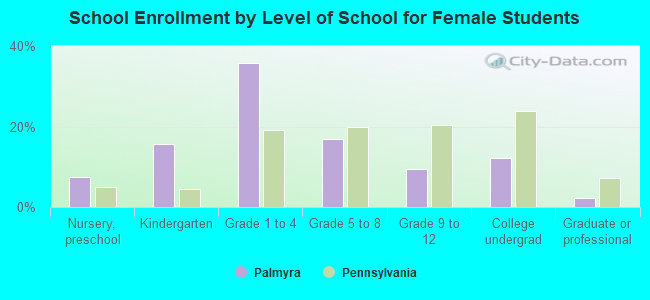
Private vs. public school enrollment:
Students in private schools in grades 1 to 8 (elementary and middle school): 86 Here:
11.0%Pennsylvania:
15.7%
Students in private schools in grades 9 to 12 (high school): 0 Here:
0.0%Pennsylvania:
13.4%
Students in private undergraduate colleges: 13 Here:
6.3%Pennsylvania:
39.8%