Paramount-Long Meadow, MD (Maryland) Houses and Residents
| Paramount-Long Meadow: | $363,362 |
| Maryland: | $398,100 |
Mean price in 2022:
Detached houses: $408,156
Here: $408,156 State: $526,819 Townhouses or other attached units: $439,563
Here: $439,563 State: $328,305
Total population: 2,571 (Urban population: 2,439, Rural population: 271 (all nonfarm))
Houses: 990 (960 occupied: 761 owner occupied, 200 renter occupied)
| % of renters here: | 21% |
| State: | 32% |
Housing density: 357 houses/condos per square mile
Median price asked for vacant for-sale houses and condos in 2022 in this county: $260,815.
Median contract rent in 2022: $1,081
Median rent asked for vacant for-rent units in 2022: $1,121
Median gross rent in Paramount-Long Meadow, MD in 2022: $1,268
Housing units in Paramount-Long Meadow with a mortgage: 467 (56 second mortgage, 0 home equity loan, 53 both second mortgage and home equity loan)
Houses without a mortgage: 0
Median household income for houses/condos with a mortgage: $107,590
Median household income for apartments without a mortgage: $73,330
Median monthly housing costs: $1,282
Compare current foreclosures near Paramount-Long Meadow, MD:
| Photo | Address | Area | Beds / Baths | Price | Details |
|---|---|---|---|---|---|

|
#1
Shale Dr
Hagerstown, MD 21740
|
3,302 sq. feet
|
2 baths 4 beds |
$475,000
|
show details |

|
#2
Appomattox Ct
Keedysville, MD 21756
|
3,536 sq. feet
|
2 baths 4 beds |
$564,900
|
show details |

|
#3
Mar Rock Dr
Hagerstown, MD 21740
|
1,632 sq. feet
|
2 baths 3 beds |
$359,000
|
show details |

|
#4
Spielman Rd
Williamsport, MD 21795
|
1,758 sq. feet
|
1 baths 3 beds |
$156,750
|
show details |

|
#5
Oriole Cir
Hagerstown, MD 21742
|
1,724 sq. feet
|
2 baths 3 beds |
$319,900
|
show details |

|
#6
Vale St
Hagerstown, MD 21740
|
1,490 sq. feet
|
2 baths 3 beds |
show details | |

|
#7
Cottage St
Waynesboro, PA 17268
|
1,704 sq. feet
|
1 baths 3 beds |
show details | |

|
#8
Morningside Dr
Falling Waters, WV 25419
|
1,672 sq. feet
|
3 baths 3 beds |
show details | |

|
#9
Calvin Dr
Hedgesville, WV 25427
|
1,266 sq. feet
|
1 baths 3 beds |
show details | |

|
#10
Ray St
Hagerstown, MD 21740
|
924 sq. feet
|
1 baths 3 beds |
show details |
| Photo | Address | Area | Beds / Baths | Price | Details |
|---|---|---|---|---|---|

|
#11
University Dr
Mont Alto, PA 17237
|
1,144 sq. feet
|
1 baths 3 beds |
show details | |

|
#12
Kaisesville Rd
Mercersburg, PA 17236
|
1,887 sq. feet
|
2 baths 3 beds |
show details | |

|
#13
Jefferson Blvd
Hagerstown, MD 21742
|
1,118 sq. feet
|
1 baths 4 beds |
show details | |

|
#14
Cross Fields Dr
Waynesboro, PA 17268
|
- sq. feet
|
2 baths 4 beds |
show details | |

|
#15
Burning Tree Ln
Fayetteville, PA 17222
|
1,664 sq. feet
|
3 baths 3 beds |
show details | |

|
#16
Ringgold St
Waynesboro, PA 17268
|
1,300 sq. feet
|
1 baths 3 beds |
show details | |

|
#17
Apple Tree Ln
Williamsport, MD 21795
|
1,357 sq. feet
|
2 baths - beds |
show details | |

|
#18
Rollingridge Ct
Myersville, MD 21773
|
1,800 sq. feet
|
4 baths - beds |
show details | |

|
#19
Beaver Creek Rd
Hagerstown, MD 21740
|
1,352 sq. feet
|
1 baths - beds |
show details | |

|
#20
Garis Shop Rd
Hagerstown, MD 21740
|
1,152 sq. feet
|
1 baths - beds |
show details |
| Photo | Address | Area | Beds / Baths | Price | Details |
|---|---|---|---|---|---|

|
#21
Harbaugh Valley Rd
Fairfield, PA 17320
|
1,958 sq. feet
|
1 baths 2 beds |
show details | |

|
#22
Fairway Dr S
Fayetteville, PA 17222
|
- sq. feet
|
2 baths 3 beds |
show details | |

|
#23
Joy Dr
Greencastle, PA 17225
|
3,636 sq. feet
|
3 baths - beds |
show details | |

|
#24
Boyd Rd
Clear Spring, MD 21722
|
1,056 sq. feet
|
1 baths - beds |
show details | |

|
#25
Veterans Ct
Smithsburg, MD 21783
|
1,900 sq. feet
|
3 baths - beds |
show details | |

|
#26
Scott Ave
Waynesboro, PA 17268
|
1,120 sq. feet
|
2 baths - beds |
show details | |

|
#27
Hykes Rd E
Greencastle, PA 17225
|
1,570 sq. feet
|
2 baths - beds |
show details | |

|
#28
S Broad St
Waynesboro, PA 17268
|
2,730 sq. feet
|
1 baths - beds |
show details | |

|
#29
Meridian Drive
Hagerstown, MD 21742
|
- sq. feet
|
2 baths 2 beds |
show details | |

|
#30
N Franklin St
Waynesboro, PA 17268
|
- sq. feet
|
1 baths 4 beds |
show details |
| Photo | Address | Area | Beds / Baths | Price | Details |
|---|---|---|---|---|---|

|
#31
Childacrest Dr
Boonsboro, MD 21713
|
4,687 sq. feet
|
6 baths - beds |
show details | |

|
#32
Ayoub Ln
Hagerstown, MD 21742
|
5,175 sq. feet
|
4 baths - beds |
show details | |

|
#33
Abbott Dr
Boonsboro, MD 21713
|
2,189 sq. feet
|
2 baths - beds |
show details | |

|
#34
Kuhn Rd
Greencastle, PA 17225
|
1,300 sq. feet
|
1 baths - beds |
show details | |

|
#35
Woodview Dr
Hagerstown, MD 21742
|
2,504 sq. feet
|
3 baths - beds |
show details | |

|
#36
Kuhn Ave
Hagerstown, MD 21740
|
1,632 sq. feet
|
2 baths - beds |
show details | |

|
#37
Crystal Falls Dr
Hagerstown, MD 21740
|
1,395 sq. feet
|
1 baths - beds |
show details | |

|
#38
S Potomac St
Hagerstown, MD 21740
|
864 sq. feet
|
1 baths - beds |
show details | |

|
#39
Willowdale Rd
Greencastle, PA 17225
|
1,144 sq. feet
|
2 baths - beds |
show details | |

|
#40
Virginia Ave
Hagerstown, MD 21740
|
1,600 sq. feet
|
1 baths - beds |
show details |
| Photo | Address | Area | Beds / Baths | Price | Details |
|---|---|---|---|---|---|

|
#41
Mount Lena Rd
Boonsboro, MD 21713
|
1,668 sq. feet
|
1 baths - beds |
show details | |

|
#42
Jacobs Trl
Fairfield, PA 17320
|
1,200 sq. feet
|
2 baths 3 beds |
show details | |

|
#43
W Washington St
Hagerstown, MD 21740
|
2,072 sq. feet
|
3 baths - beds |
show details | |

|
#44
Bonnie Trl
Fairfield, PA 17320
|
1,752 sq. feet
|
2 baths 3 beds |
show details | |

|
#45
Shimpstown Rd
Mercersburg, PA 17236
|
- sq. feet
|
1 baths 3 beds |
show details | |

|
#46
Roy Croft Dr
Hagerstown, MD 21740
|
1,840 sq. feet
|
3 baths - beds |
show details | |

|
#47
View St
Hagerstown, MD 21742
|
1,218 sq. feet
|
2 baths - beds |
show details | |

|
#48
Kasinof Ave
Hagerstown, MD 21742
|
1,144 sq. feet
|
2 baths - beds |
show details | |

|
#49
Bramly Dr
Hagerstown, MD 21742
|
962 sq. feet
|
2 baths - beds |
show details | |

|
Check over 1 million property listings on Foreclosure.com!
|
browse all offers | |||


Median year apartment built: 1967
Household type by relationship:
Households: 2,812- Male householders: 565 (34 living alone), Female householders: 394 (115 living alone)
601 spouses (601 opposite-sex spouses), 33 unmarried partners, (33 opposite-sex unmarried partners), 860 children (758 natural, 7 adopted, 94 stepchildren), 0 grandchildren, 16 brothers or sisters, 24 parents, 0 foster children, 0 other relatives, 229 non-relatives
- In group quarters: 87
Size of family households: 348 2-persons, 136 3-persons, 107 4-persons, 78 5-persons, 47 6-persons, 23 7-or-more-persons.
Size of nonfamily households: 158 1-person, 36 2-persons.
503 married couples with children.
86 single-parent households (3 men, 83 women).
94.8% of residents of Paramount-Long Meadow speak English at home.
3.9% of residents speak Spanish at home (37% speak English very well, 19% speak English well, 20% speak English not well, 23% don't speak English at all).
0.5% of residents speak Asian or Pacific Island language at home (100% speak English very well).
Foreign born population: 64 (2.3%)
(59.4% of them are naturalized citizens)
| Here: | 8.1 |
| State: | 7.3 |
| Here: | 4.8 |
| State: | 4.2 |

- Bedrooms in owner-occupied houses and condos in Paramount-Long Meadow, Maryland
- 0no bedroom
- 01 bedroom
- 902 bedrooms
- 2193 bedrooms
- 3604 bedrooms
- 935+ bedrooms

- Bedrooms in renter-occupied apartments in Paramount-Long Meadow, Maryland
- 14no bedroom
- 01 bedroom
- 1562 bedrooms
- 03 bedrooms
- 304 bedrooms
- 05+ bedrooms

- Cars and other vehicles available in Paramount-Long Meadow in owner-occupied houses/condos
- 10no vehicle
- 1761 vehicle
- 3092 vehicles
- 1963 vehicles
- 494 vehicles
- 205+ vehicles

- Cars and other vehicles available in Paramount-Long Meadow in renter-occupied apartments
- 0no vehicle
- 801 vehicle
- 892 vehicles
- 03 vehicles
- 04 vehicles
- 325+ vehicles

- Rooms in owner-occupied houses in Paramount-Long Meadow, Maryland
- 01 room
- 02 rooms
- 03 rooms
- 04 rooms
- 665 rooms
- 696 rooms
- 997 rooms
- 1988 rooms
- 3319+ rooms

- Rooms in renter-occupied apartments in Paramount-Long Meadow, Maryland
- 141 room
- 02 rooms
- 103 rooms
- 614 rooms
- 595 rooms
- 226 rooms
- 187 rooms
- 08 rooms
- 159+ rooms


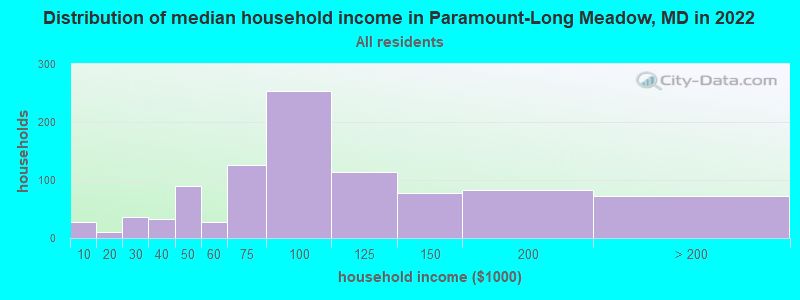
Paramount-Long Meadow, MD household income distribution

- 27Less than $10,000
- 11$10,000 to $19,999
- 37$20,000 to $29,999
- 32$30,000 to $39,999
- 90$40,000 to $49,999
- 28$50,000 to $59,999
- 126$60,000 to $74,999
- 254$75,000 to $99,999
- 114$100,000 to $124,999
- 77$125,000 to $149,999
- 83$150,000 to $199,999
- 73$200,000 or more
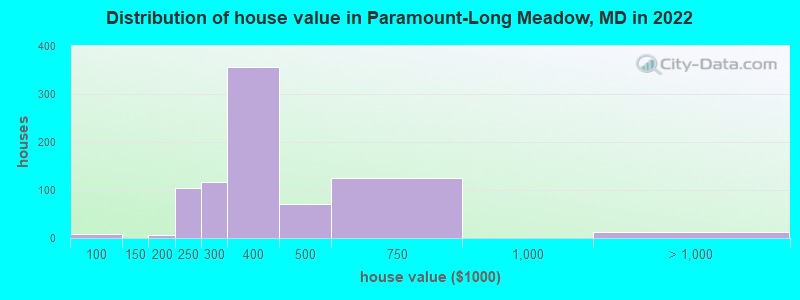
Home value of owner - occupied houses in 2022 in Paramount-Long Meadow, MD
-
- 8$70,000 to $79,999
- 6$175,000 to $199,999
- 103$200,000 to $249,999
- 115$250,000 to $299,999
- 355$300,000 to $399,999
- 70$400,000 to $499,999
- 125$500,000 to $749,999
- 11$1,000,000 to $1,499,999
Rent paid by renters in 2022 in Paramount-Long Meadow, MD
-
- 86$150 to $199
- 87$1,000 to $1,249
- 44$1,250 to $1,499
- 11$1,500 to $1,999


Percentage of workers working in this county: 64.0%
Number of people working at home: 248 (21.3% of all workers)
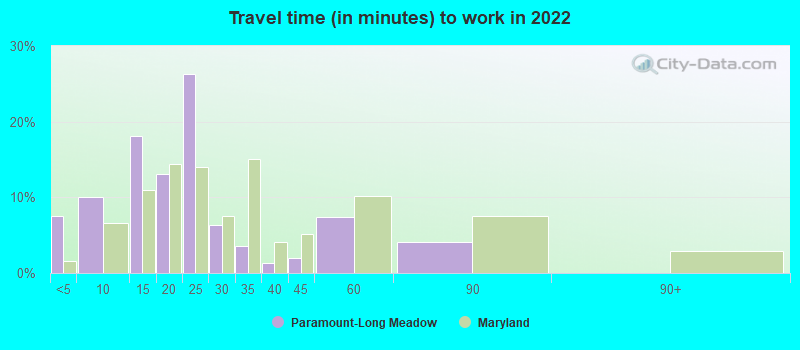
Travel time to work (commute)
- Less than 5 minutes: 2
- 5 to 9 minutes: 51
- 10 to 14 minutes: 141
- 15 to 19 minutes: 182
- 20 to 24 minutes: 108
- 25 to 29 minutes: 5
- 30 to 34 minutes: 102
- 35 to 39 minutes: 42
- 40 to 44 minutes: 82
- 45 to 59 minutes: 48
- 60 to 89 minutes: 123
- 90 or more minutes: 17
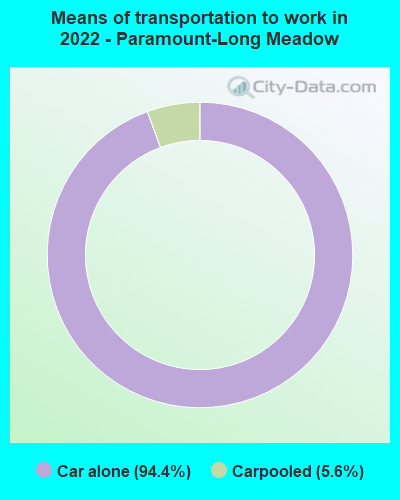
Means of transportation to work:
- Drove a car alone: 533 (72.6%)
- Carpooled: 30 (4.1%)
- Worked at home: 317 (43.2%)

- Unemployment by race in 2022
- Unemployment rate for White non-Hispanic residents
- 1.3%Males
- 0.9%Females
- Unemployment rate for Black residents
- 76.8%Females
- Unemployment rate for Hispanic or Latino residents
- 39.8%Males

- Year of entry for the foreign-born population in Paramount-Long Meadow, Maryland
- 272010 or later
- 222000 to 2009
- 01990 to 1999
- 161980 to 1989
- 171970 to 1979
- 22Before 1970

First ancestries reported:
- German: 583 (44.6%)
- English: 102 (7.8%)
- Irish: 92 (7.0%)
- European: 65 (5.0%)
- American: 58 (4.4%)
- Italian: 52 (4.0%)
- Scottish: 41 (3.1%)
- Slovak: 37 (2.8%)
- Polish: 33 (2.5%)
- Scotch-Irish: 16 (1.2%)
- Swedish: 13 (1.0%)
- Northern European: 11 (0.8%)
- African: 11 (0.8%)
- Dutch: 9 (0.7%)
- Austrian: 6 (0.5%)
- Russian: 6 (0.5%)
- French Canadian: 5 (0.4%)
- Cajun: 4 (0.3%)
- French: 2 (0.2%)
Most common places of birth for foreign-born residents (%):
| Paramount-Long Meadow: | 45.6% (31) |
| Maryland: | 1.4% (13,947) |
| Paramount-Long Meadow: | 16.2% (11) |
| Maryland: | 3.8% (36,698) |
| Paramount-Long Meadow: | 13.2% (9) |
| Maryland: | 0.3% (3,238) |
| Paramount-Long Meadow: | 10.3% (7) |
| Maryland: | 1.0% (9,481) |
| Paramount-Long Meadow: | 4.4% (3) |
| Maryland: | 1.3% (12,898) |
Place of birth for U.S.-born residents:
- This state: 1,839
- Other state: 891
- Northeast: 452
- Midwest: 65
- South: 269
- West: 100
91.8% of Paramount-Long Meadow residents lived in the same house 1 years ago.
Out of people who lived in different houses, 37.5% lived in this county.
Out of people who lived in different counties, 65.6% lived in Maryland.
| Paramount-Long Meadow: | 91.8% |
| State average: | 88.5% |
Education attainment for males 25 years and older:
- No schooling: 4
- Nursery to 4th grade: 0
- 5th and 6th grade: 0
- 7th and 8th grade: 28
- 9th grade: 0
- 10th grade: 0
- 11th grade: 17
- 12th grade, no diploma: 9
- High school graduate (or equivalency): 201
- Less than 1 year of college: 62
- Some college more than 1 year, no degree: 73
- Associate degree: 49
- Bachelor's degree: 138
- Master's degree: 192
- Professional school degree: 101
- Doctorate degree: 4

Education attainment for females 25 years and older:
- No schooling: 3
- Nursery to 4th grade: 0
- 5th and 6th grade: 0
- 7th and 8th grade: 8
- 9th grade: 0
- 10th grade: 0
- 11th grade: 19
- 12th grade, no diploma: 6
- High school graduate (or equivalency): 202
- Less than 1 year of college: 101
- Some college more than 1 year, no degree: 132
- Associate degree: 122
- Bachelor's degree: 269
- Master's degree: 122
- Professional school degree: 47
- Doctorate degree: 0


Housing units in structures:
- One, detached: 696
- One, attached: 126
- Two: 22
- 3 or 4: 10
- 5 to 9: 42
- 10 to 19: 92
House/condo owner moved in on average 9 years ago
Renter moved in on average 0 years ago

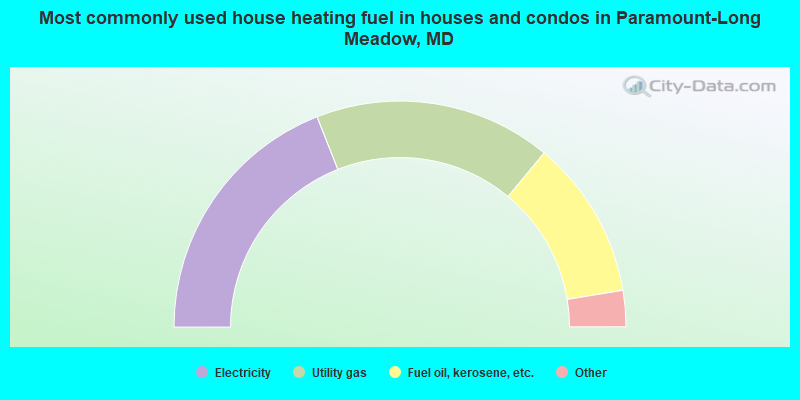
- 38.1%Electricity
- 34.0%Utility gas
- 22.8%Fuel oil, kerosene, etc.
- 2.3%Bottled, tank, or LP gas
- 1.3%Other fuel
- 0.8%Solar energy
- 0.7%Wood
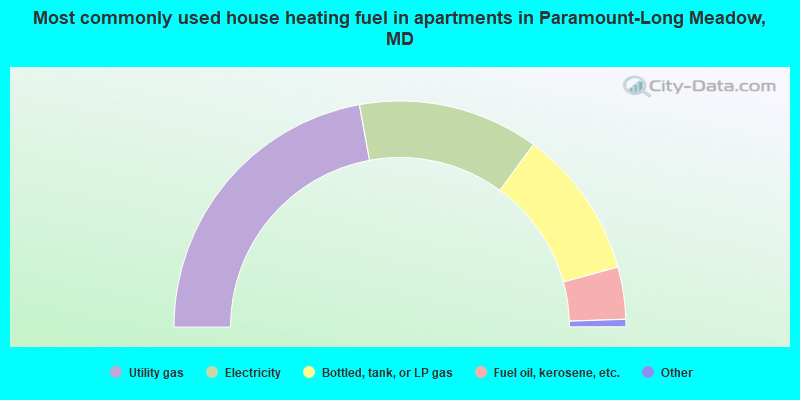
- 44.7%Utility gas
- 26.1%Electricity
- 21.6%Bottled, tank, or LP gas
- 7.5%Fuel oil, kerosene, etc.
Private vs. public school enrollment:
| Here: | 13.0% |
| Maryland: | 15.2% |
| Here: | 6.7% |
| Maryland: | 14.4% |
| Here: | 24.6% |
| Maryland: | 20.2% |


