Pasadena, TX (Texas) Houses and Residents
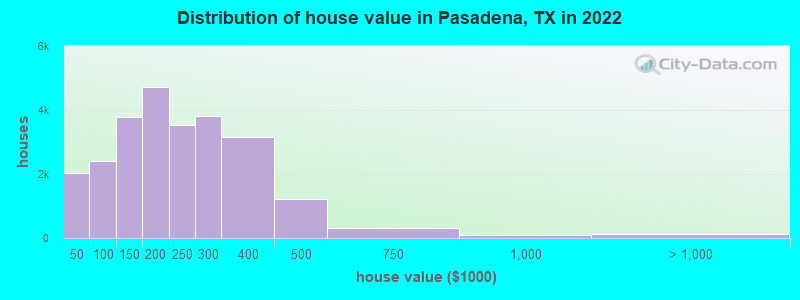
Estimated median house or condo value in 2022: $200,000 (it was $67,600 in 2000 )
Pasadena:
$200,000Texas:
$275,400
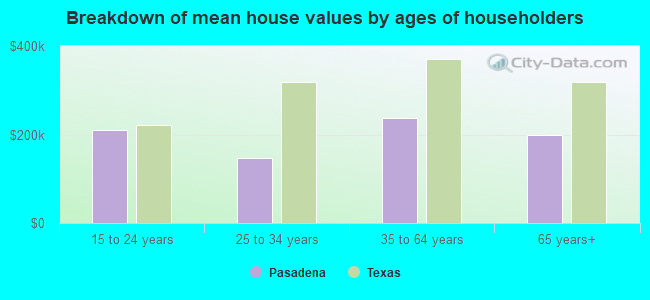
Lower value quartile - upper value quartile: $133,500 - $266,400Mean price in 2022: Detached houses: $226,562 Here:
$226,562State:
$369,058
Townhouses or other attached units: $147,022 Here:
$147,022State:
$327,631
In 5-or-more-unit structures: $207,073 Here:
$207,073State:
$413,944
Mobile homes: $45,930 Here:
$45,930State:
$124,413
Total population: 153,887 (Urban population: 141,127, Rural population: 604 (all nonfarm) )
Houses: 53,550 (49,352 occupied: 26,705 owner occupied, 22,647 renter occupied )
% of renters here:
46%State:
38%
Housing density: 1,213 houses/condos per square mile
Median price asked for vacant for-sale houses and condos in 2022: $159,030.
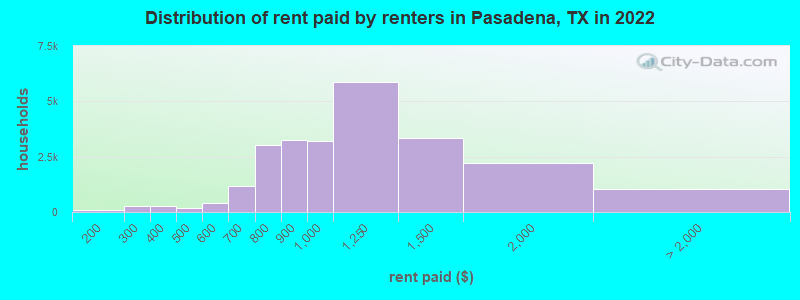
Median contract rent in 2022: $983 (lower quartile is $834, upper quartile is $1,291)
Median rent asked for vacant for-rent units in 2022: $1,065
Median gross rent in Pasadena, TX in 2022: $1,154
Housing units in Pasadena with a mortgage: 12,979 (560 second mortgage, 70 home equity loan, 490 both second mortgage and home equity loan )Houses without a mortgage: 381
Median household income for houses/condos with a mortgage: $78,477
Median household income for apartments without a mortgage: $57,843
Median monthly housing costs: $1,102
Data:
Median house or condo value ($)
Median house or condo value ($ change since 2000)
Median house or condo value ($) - White
Median house or condo value ($) - Black or African American
Median house or condo value ($) - Asian
Median house or condo value ($) - Hispanic or Latino
Median house or condo value ($) - American Indian and Alaska Native
Median house or condo value ($) - Multirace
Median house or condo value ($) - Other Race
Median price asked for mobile homes ($)
Household density (households per square mile)
Mean house or condo value by units in structure - 1, detached ($)
Mean house or condo value by units in structure - 1, attached ($)
Mean house or condo value by units in structure - 2 ($)
Mean house or condo value by units in structure by units in structure - 3 or 4 ($)
Mean house or condo value by units in structure - 5 or more ($)
Mean house or condo value by units in structure - Boat, RV, van, etc. ($)
Mean house or condo value by units in structure - Mobile home ($)
Median contract rent ($)
Median contract rent - Lower quartile ($)
Median contract rent - Upper quartile ($)
Median gross rent ($)
Urban houses (%)
Rural houses (%)
Houses occupied (%)
Houses occupied (% change since 2000)
Houses owner occupied (%)
Houses owner occupied (% change since 2000)
Houses renter occupied (%)
Houses renter occupied (% change since 2000)
Vacant housing units - For rent (%)
Vacant housing units - For rent (% change since 2000)
Vacant housing units - For sale only (%)
Vacant housing units - For sale only (% change since 2000)
Vacant housing units - Rented or sold, not occupied (%)
Vacant housing units - Rented or sold, not occupied (% change since 2000)
Vacant housing units - For seasonal, recreational, or occasional use (%)
Vacant housing units - For seasonal, recreational, or occasional use (% change since 2000)
Vacant housing units - For migrant workers (%)
Vacant housing units - For migrant workers (% change since 2000)
Vacant housing units - Other vacant (%)
Vacant housing units - Other vacant (% change since 2000)
Median monthly housing costs ($)
Median household income for houses/condos with a mortgage ($)
Median household income for houses/condos without a mortgage ($)
Median household income ($)
Median household income ($) - White
Median household income ($) - Black or African American
Median household income ($) - Asian
Median household income ($) - Hispanic or Latino
Median household income ($) - American Indian and Alaska Native
Median household income ($) - Multirace
Median household income ($) - Other Race
Mortgage status - with mortgage (%)
Mortgage status - with second mortgage (%)
Mortgage status - with home equity loan (%)
Mortgage status - with both second mortgage and home equity loan (%)
Mortgage status - without a mortgage (%)
Median year house/condo built
Median year apartment built
Household type by relationship - Male householder living alone (%)
Household type by relationship - Male householder not living alone (%)
Household type by relationship - Female householder living alone (%)
Household type by relationship - Female householder not living alone (%)
Household type by relationship - Opposite-Sex spouse (%)
Household type by relationship - Same-Sex spouse (%)
Household type by relationship - Opposite-Sex unmarried partner (%)
Household type by relationship - Same-Sex unmarried partner (%)
Household type by relationship - In group quarters (%)
Size of family households - 2-person household (%)
Size of family households - 3-person household (%)
Size of family households - 4-person household (%)
Size of family households - 5-person household (%)
Size of family households - 6-person household (%)
Size of family households - 7-or-more-person household (%)
Size of nonfamily households - 1-person household (%)
Size of nonfamily households - 2-person household (%)
Size of nonfamily households - 3-person household (%)
Size of nonfamily households - 4-person household (%)
Size of nonfamily households - 5-person household (%)
Size of nonfamily households - 6-person household (%)
Size of nonfamily households - 7-or-moreperson household (%)
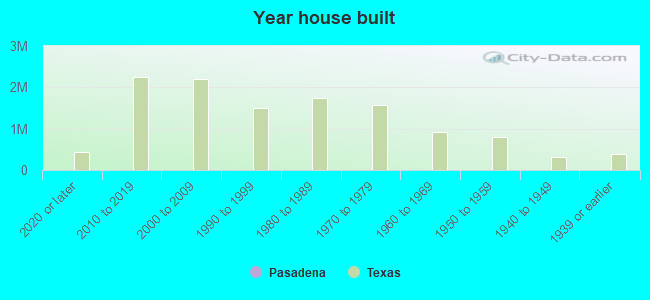
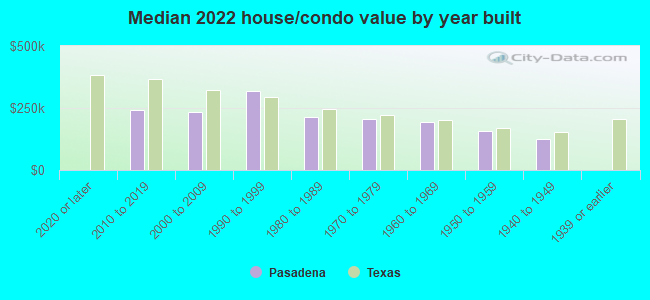
Year house built - Built 2010 or later (%)
Year house built - Built 2000 to 2009 (%)
Year house built - Built 1990 to 1999 (%)
Year house built - Built 1980 to 1989 (%)
Year house built - Built 1970 to 1979 (%)
Year house built - Built 1960 to 1969 (%)
Year house built - Built 1950 to 1959 (%)
Year house built - Built 1940 to 1949 (%)
Year house built - Built 1939 or earlier (%)
Median number of rooms in houses and condos
Median number of rooms in apartments
Median number of bedrooms in owner occupied houses
Mean number of bedrooms in owner occupied houses
Median number of bedrooms in renter occupied houses
Mean number of bedrooms in renter occupied houses
Median number of vehichles in owner occupied houses
Mean number of vehichles in owner occupied houses
Median number of vehichles in renter occupied houses
Mean number of vehichles in renter occupied houses
Rooms in owner-occupied houses - 1 room (%)
Rooms in owner-occupied houses - 2 rooms (%)
Rooms in owner-occupied houses - 3 rooms (%)
Rooms in owner-occupied houses - 4 rooms (%)
Rooms in owner-occupied houses - 5 rooms (%)
Rooms in owner-occupied houses - 6 rooms (%)
Rooms in owner-occupied houses - 7 rooms (%)
Rooms in owner-occupied houses - 8 rooms (%)
Rooms in owner-occupied houses - 9+ rooms (%)
Rooms in renter-occupied houses - 1 room (%)
Rooms in renter-occupied houses - 2 rooms (%)
Rooms in renter-occupied houses - 3 rooms (%)
Rooms in renter-occupied houses - 4 rooms (%)
Rooms in renter-occupied houses - 5 rooms (%)
Rooms in renter-occupied houses - 6 rooms (%)
Rooms in renter-occupied houses - 7 rooms (%)
Rooms in renter-occupied houses - 8 rooms (%)
Rooms in renter-occupied houses - 9+ rooms (%)
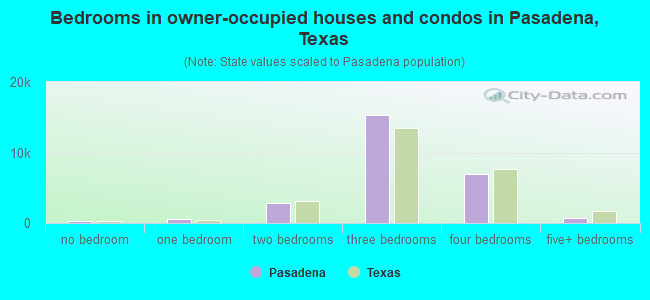
Bedrooms in owner-occupied houses - no bedrooms (%)
Bedrooms in owner-occupied houses - 1 bedroom (%)
Bedrooms in owner-occupied houses - 2 bedrooms (%)
Bedrooms in owner-occupied houses - 3 bedrooms (%)
Bedrooms in owner-occupied houses - 4 bedrooms (%)
Bedrooms in owner-occupied houses - 5+ bedrooms (%)
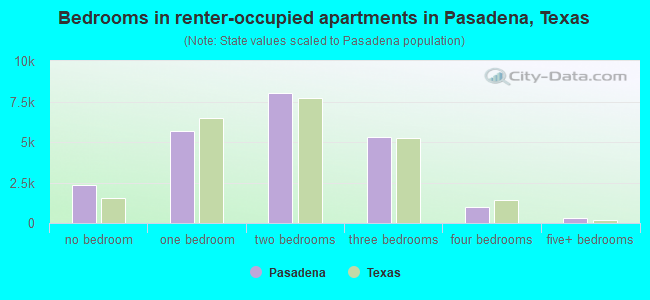
Bedrooms in renter-occupied houses - no bedrooms (%)
Bedrooms in renter-occupied houses - 1 bedroom (%)
Bedrooms in renter-occupied houses - 2 bedrooms (%)
Bedrooms in renter-occupied houses - 3 bedrooms (%)
Bedrooms in renter-occupied houses - 4 bedrooms (%)
Bedrooms in renter-occupied houses - 5+ bedrooms (%)
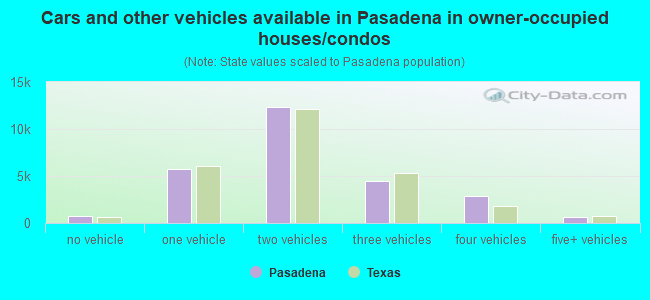
Vehicles available in owner-occupied houses - no vehicle available (%)
Vehicles available in owner-occupied houses - 1 vehicle available(%)
Vehicles available in owner-occupied houses - 2 Vehicles available (%)
Vehicles available in owner-occupied houses - 3 Vehicles available (%)
Vehicles available in owner-occupied houses - 4 Vehicles available (%)
Vehicles available in owner-occupied houses - 5+ Vehicles available (%)
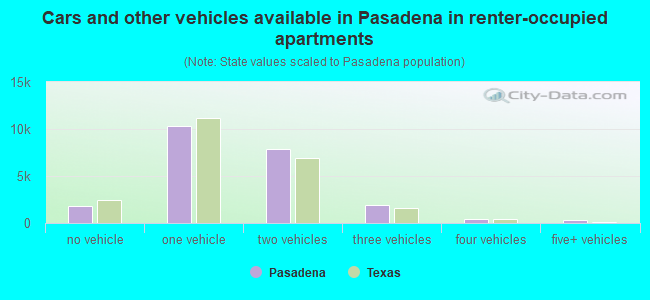
Vehicles available in renter-occupied houses - no vehicle available (%)
Vehicles available in renter-occupied houses - 1 vehicle available (%)
Vehicles available in renter-occupied houses - 2 Vehicles available (%)
Vehicles available in renter-occupied houses - 3 Vehicles available (%)
Vehicles available in renter-occupied houses - 4 Vehicles available (%)
Vehicles available in renter-occupied houses - 5+ Vehicles available (%)
Housing units in structures - 1, detached (%)
Housing units in structures - 1, attached (%)
Housing units in structures - 2 (%)
Housing units in structures - 3 or 4 (%)
Housing units in structures - 5 to 9 (%)
Housing units in structures - 10 to 19 (%)
Housing units in structures - 20 to 49 (%)
Housing units in structures - 50 or more (%)
Housing units in structures - Mobile home (%)
Housing units in structures - Boat, RV, van, etc. (%)
Housing units in structures - Owners - 1, detached (%)
Housing units in structures - Owners - 1, attached (%)
Housing units in structures - Owners - 2 (%)
Housing units in structures - Owners - 3 or 4 (%)
Housing units in structures - Owners - 5 to 9 (%)
Housing units in structures - Owners - 10 to 19 (%)
Housing units in structures - Owners - 20 to 49 (%)
Housing units in structures - Owners - 50 or more (%)
Housing units in structures - Owners - Mobile home (%)
Housing units in structures - Owners - Boat, RV, van, etc. (%)
Housing units in structures - Renters - 1, detached (%)
Housing units in structures - Renters - 1, attached (%)
Housing units in structures - Renters - 2 (%)
Housing units in structures - Renters - 3 or 4 (%)
Housing units in structures - Renters - 5 to 9 (%)
Housing units in structures - Renters - 10 to 19 (%)
Housing units in structures - Renters - 20 to 49 (%)
Housing units in structures - Renters - 50 or more (%)
Housing units in structures - Renters - Mobile home (%)
Housing units in structures - Renters - Boat, RV, van, etc. (%)
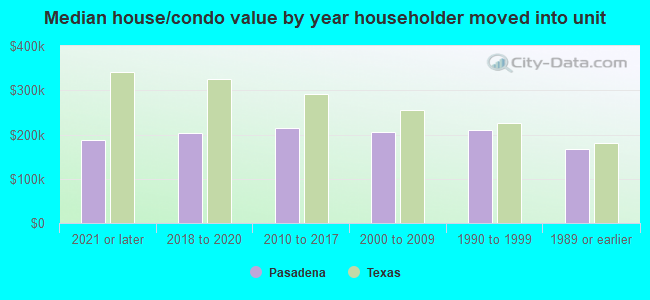
House/condo owner moved in on average (years ago)
Renter moved in on average (years ago)
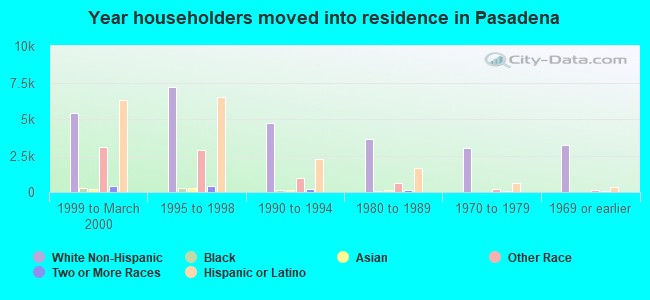
Year householder moved into unit - Moved in 1999 to March 2000 (%)
Year householder moved into unit - Moved in 1999 to March 2000 (%) - White
Year householder moved into unit - Moved in 1999 to March 2000 (%) - Black or African American
Year householder moved into unit - Moved in 1999 to March 2000 (%) - Asian
Year householder moved into unit - Moved in 1999 to March 2000 (%) - Hispanic or Latino
Year householder moved into unit - Moved in 1999 to March 2000 (%) - American Indian and Alaska Native
Year householder moved into unit - Moved in 1999 to March 2000 (%) - Multirace
Year householder moved into unit - Moved in 1999 to March 2000 (%) - Other Race
Year householder moved into unit - Moved in 1995 to 1998 (%)
Year householder moved into unit - Moved in 1995 to 1998 (%) - White
Year householder moved into unit - Moved in 1995 to 1998 (%) - Black or African American
Year householder moved into unit - Moved in 1995 to 1998 (%) - Asian
Year householder moved into unit - Moved in 1995 to 1998 (%) - Hispanic or Latino
Year householder moved into unit - Moved in 1995 to 1998 (%) - American Indian and Alaska Native
Year householder moved into unit - Moved in 1995 to 1998 (%) - Multirace
Year householder moved into unit - Moved in 1995 to 1998 (%) - Other Race
Year householder moved into unit - Moved in 1990 to 1994 (%)
Year householder moved into unit - Moved in 1990 to 1994 (%) - White
Year householder moved into unit - Moved in 1990 to 1994 (%) - Black or African American
Year householder moved into unit - Moved in 1990 to 1994 (%) - Asian
Year householder moved into unit - Moved in 1990 to 1994 (%) - Hispanic or Latino
Year householder moved into unit - Moved in 1990 to 1994 (%) - American Indian and Alaska Native
Year householder moved into unit - Moved in 1990 to 1994 (%) - Multirace
Year householder moved into unit - Moved in 1990 to 1994 (%) - Other Race
Year householder moved into unit - Moved in 1980 to 1989 (%)
Year householder moved into unit - Moved in 1980 to 1989 (%) - White
Year householder moved into unit - Moved in 1980 to 1989 (%) - Black or African American
Year householder moved into unit - Moved in 1980 to 1989 (%) - Asian
Year householder moved into unit - Moved in 1980 to 1989 (%) - Hispanic or Latino
Year householder moved into unit - Moved in 1980 to 1989 (%) - American Indian and Alaska Native
Year householder moved into unit - Moved in 1980 to 1989 (%) - Multirace
Year householder moved into unit - Moved in 1980 to 1989 (%) - Other Race
Year householder moved into unit - Moved in 1970 to 1979 (%)
Year householder moved into unit - Moved in 1970 to 1979 (%) - White
Year householder moved into unit - Moved in 1970 to 1979 (%) - Black or African American
Year householder moved into unit - Moved in 1970 to 1979 (%) - Asian
Year householder moved into unit - Moved in 1970 to 1979 (%) - Hispanic or Latino
Year householder moved into unit - Moved in 1970 to 1979 (%) - American Indian and Alaska Native
Year householder moved into unit - Moved in 1970 to 1979 (%) - Multirace
Year householder moved into unit - Moved in 1970 to 1979 (%) - Other Race
Year householder moved into unit - Moved in 1969 or earlier (%)
Year householder moved into unit - Moved in 1969 or earlier (%) - White
Year householder moved into unit - Moved in 1969 or earlier (%) - Black or African American
Year householder moved into unit - Moved in 1969 or earlier (%) - Asian
Year householder moved into unit - Moved in 1969 or earlier (%) - Hispanic or Latino
Year householder moved into unit - Moved in 1969 or earlier (%) - American Indian and Alaska Native
Year householder moved into unit - Moved in 1969 or earlier (%) - Multirace
Year householder moved into unit - Moved in 1969 or earlier (%) - Other Race
Housing units lacking complete plumbing facilities (%)
Housing units lacking complete kitchen facilities (%)
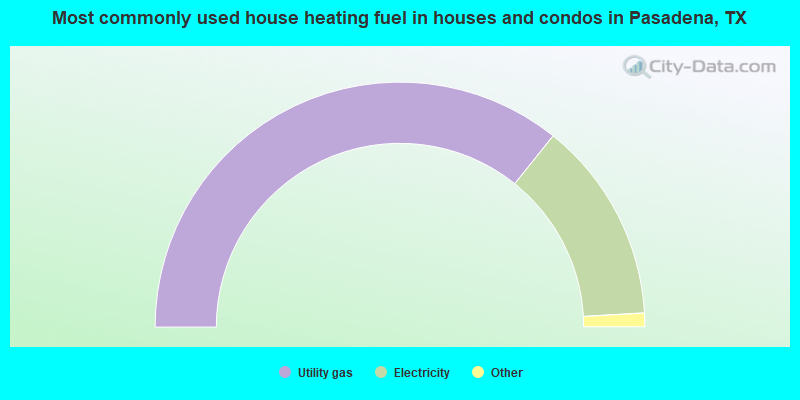
House heating fuel used in houses and condos - Utility gas (%)
House heating fuel used in houses and condos - Bottled, tank, or LP gas (%)
House heating fuel used in houses and condos - Electricity (%)
House heating fuel used in houses and condos - Fuel oil, kerosene, etc. (%)
House heating fuel used in houses and condos - Coal or coke (%)
House heating fuel used in houses and condos - Wood (%)
House heating fuel used in houses and condos - Solar energy (%)
House heating fuel used in houses and condos - Other fuel (%)
House heating fuel used in houses and condos - No fuel used (%)
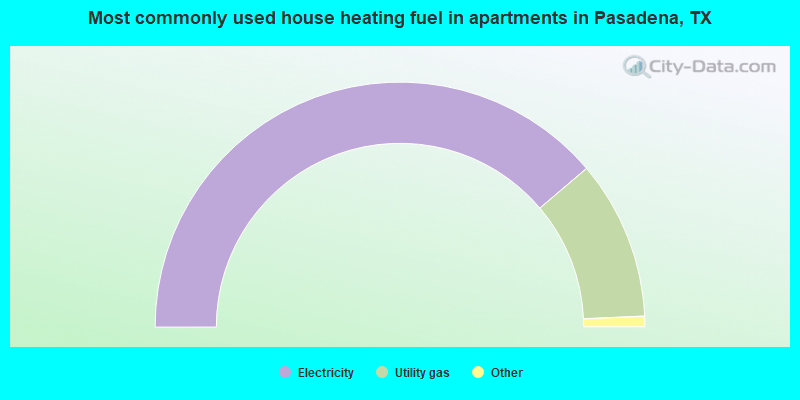
House heating fuel used in apartments - Utility gas (%)
House heating fuel used in apartments - Bottled, tank, or LP gas (%)
House heating fuel used in apartments - Electricity (%)
House heating fuel used in apartments - Fuel oil, kerosene, etc. (%)
House heating fuel used in apartments - Coal or coke (%)
House heating fuel used in apartments - Wood (%)
House heating fuel used in apartments - Solar energy (%)
House heating fuel used in apartments - Other fuel (%)
House heating fuel used in apartments - No fuel used (%)
Latest news about housing in Pasadena, TX collected exclusively by city-data.com from local newspapers, TV, and radio stations
Median year house/condo built: 1970Median year apartment built: 1981Household type by relationship:
Households: 147,665
Male householders: 24,325 (4,052 living alone ), Female householders: 25,027 (5,087 living alone )23,058 spouses (22,980 opposite-sex spouses ), 5,183 unmarried partners , (4,759 opposite-sex unmarried partners ), 55,758 children (51,412 natural , 1,728 adopted , 2,618 stepchildren ), 4,153 grandchildren , 3,405 brothers or sisters , 1,324 parents , 0 foster children , 3,335 other relatives , 910 non-relatives In group quarters: 1,187
Size of family households: 12,500 2-persons , 8,504 3-persons , 7,660 4-persons , 4,752 5-persons , 1,612 6-persons , 2,166 7-or-more-persons .
Size of nonfamily households: 9,139 1-person , 2,979 2-persons , 40 3-persons .
24,566 married couples with children. single-parent households (4,307 men , 10,979 women ).
51.8% of residents of Pasadena speak English at home. of residents speak Spanish at home (50% speak English very well , 20% speak English well , 19% speak English not well , 12% don't speak English at all ).of residents speak other Indo-European language at home (81% speak English very well , 16% speak English well , 2% speak English not well , 1% don't speak English at all ).of residents speak Asian or Pacific Island language at home (58% speak English very well , 29% speak English well , 11% speak English not well , 1% don't speak English at all ).of residents speak other language at home (52% speak English very well , 47% speak English well , 1% speak English not well ).
Foreign born population: 38,856 (26.3%)of them are naturalized citizens )
Median number of rooms in houses and condos:
Median number of rooms in apartments
Owner-occupied Renter-occupied
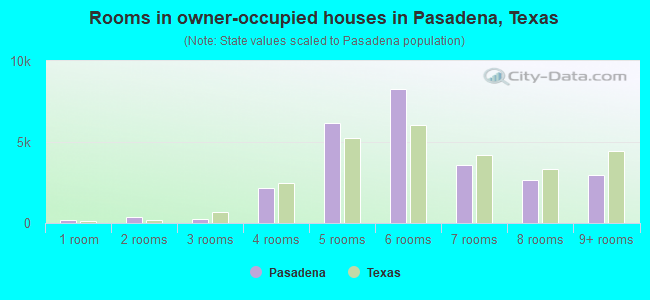
Rooms in owner-occupied houses in Pasadena, Texas
191 1 room 390 2 rooms 248 3 rooms 2,191 4 rooms 6,169 5 rooms 8,266 6 rooms 3,608 7 rooms 2,656 8 rooms 2,986 9+ rooms
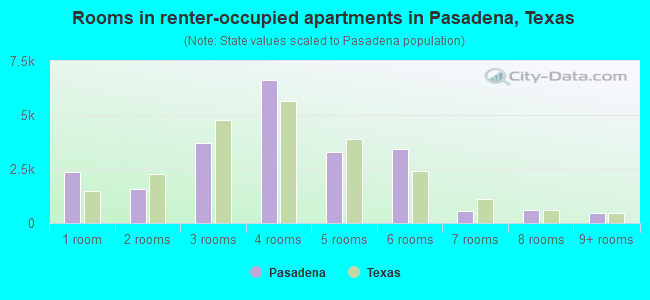
Rooms in renter-occupied apartments in Pasadena, Texas
2,345 1 room 1,593 2 rooms 3,717 3 rooms 6,639 4 rooms 3,300 5 rooms 3,433 6 rooms 551 7 rooms 606 8 rooms 463 9+ rooms
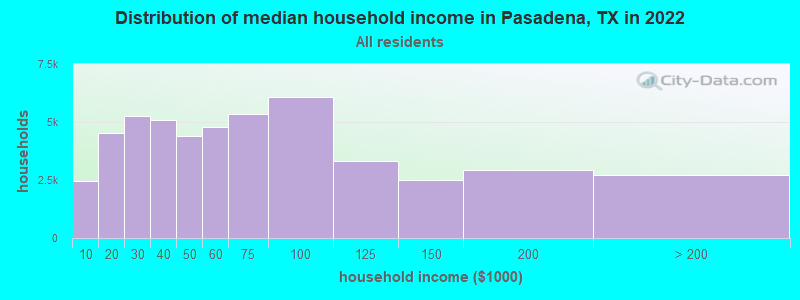
Pasadena, TX household income distribution 2,476 Less than $10,0004,519 $10,000 to $19,9995,248 $20,000 to $29,9995,080 $30,000 to $39,9994,415 $40,000 to $49,9994,793 $50,000 to $59,9995,330 $60,000 to $74,9996,073 $75,000 to $99,9993,324 $100,000 to $124,9992,486 $125,000 to $149,9992,912 $150,000 to $199,9992,696 $200,000 or more
Home value of owner - occupied houses in 2022 in Pasadena, TX 717 Less than $10,000188 $10,000 to $14,999414 $15,000 to $19,999281 $20,000 to $24,999165 $25,000 to $29,99974 $30,000 to $34,99941 $35,000 to $39,999137 $40,000 to $49,999247 $50,000 to $59,999417 $60,000 to $69,999243 $70,000 to $79,999659 $80,000 to $89,999711 $90,000 to $99,9991,913 $100,000 to $124,9991,863 $125,000 to $149,9992,612 $150,000 to $174,9992,098 $175,000 to $199,9993,528 $200,000 to $249,9993,800 $250,000 to $299,9993,168 $300,000 to $399,9991,208 $400,000 to $499,999323 $500,000 to $749,999102 $750,000 to $999,99924 $1,000,000 to $1,499,99947 $1,500,000 to $1,999,99946 $2,000,000 or moreRent paid by renters in 2022 in Pasadena, TX 25 $100 to $14986 $150 to $199148 $200 to $249102 $250 to $299232 $300 to $34955 $350 to $39958 $400 to $449110 $450 to $499154 $500 to $549236 $550 to $599459 $600 to $649710 $650 to $6991,226 $700 to $7491,800 $750 to $7993,257 $800 to $8993,191 $900 to $9995,858 $1,000 to $1,2493,353 $1,250 to $1,4992,235 $1,500 to $1,999144 $2,000 to $2,49958 $2,500 to $2,9992 $3,000 to $3,49966 $3,500 or more759 No cash rent
Percentage of workers working in this county: 90.4%Number of people working at home: 7,401 (11.0% of all workers )
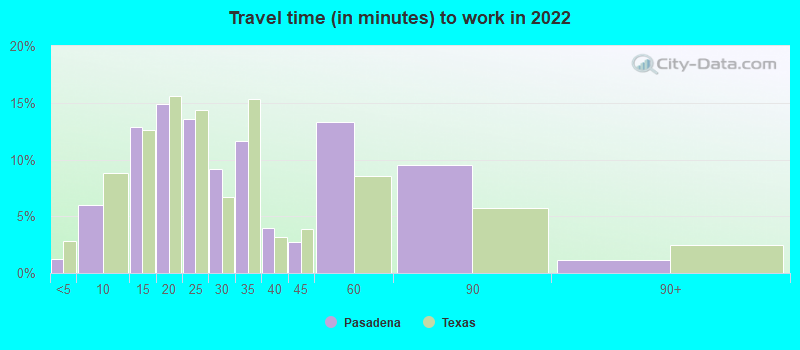
Travel time to work (commute)
Less than 5 minutes: 9655 to 9 minutes: 3,41710 to 14 minutes: 7,92515 to 19 minutes: 7,81620 to 24 minutes: 8,81925 to 29 minutes: 4,94030 to 34 minutes: 8,28335 to 39 minutes: 1,18140 to 44 minutes: 2,60145 to 59 minutes: 5,16760 to 89 minutes: 4,04790 or more minutes: 405
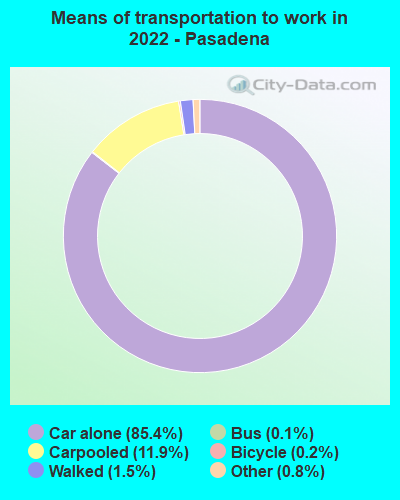
Means of transportation to work:
Drove a car alone: 52,285 (74.6%)Carpooled: 8,583 (12.2%)Bus : 57 (0.1%)Taxi: 684 (1.0%)Bicycle: 107 (0.2%)Walked: 891 (1.3%)Worked at home: 7,401 (10.6%)
Unemployment by race in 2022
Unemployment rate for White non-Hispanic residents 4.9% Males3.6% FemalesUnemployment rate for Black residents 14.2% Males14.7% FemalesUnemployment rate for American Indian and Alaska Native residents 18.4% Males22.8% FemalesUnemployment rate for Asian residents 3.7% Males1.1% FemalesUnemployment rate for other race residents 6.7% MalesUnemployment rate for two or more race residents 8.4% Males6.9% FemalesUnemployment rate for Hispanic or Latino residents 6.8% Males3.8% Females
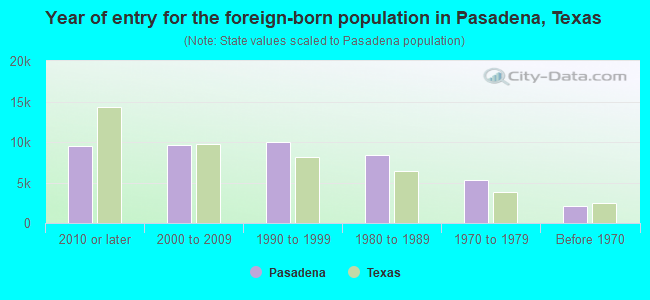
Year of entry for the foreign-born population in Pasadena, Texas
9,559 2010 or later 9,646 2000 to 2009 9,977 1990 to 1999 8,343 1980 to 1989 5,297 1970 to 1979 2,103 Before 1970
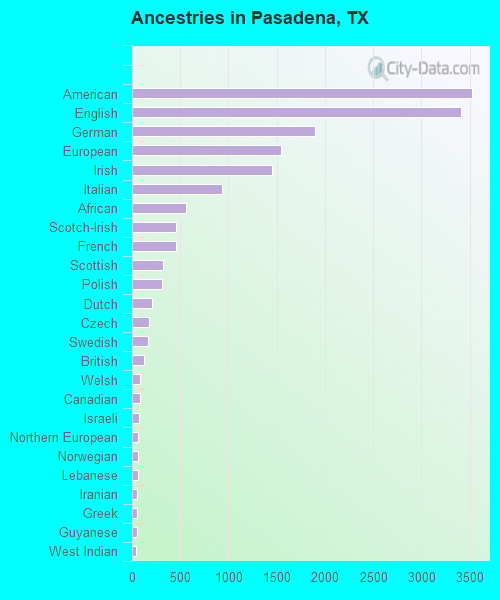
First ancestries reported:
American: 3,524 (3.4%)
English: 3,412 (3.3%)
German: 1,895 (1.8%)
European: 1,542 (1.5%)
Irish: 1,447 (1.4%)
Italian: 932 (0.9%)
African: 564 (0.5%)
Scotch-Irish: 453 (0.4%)
French: 451 (0.4%)
Scottish: 317 (0.3%)
Polish: 306 (0.3%)
Dutch: 212 (0.2%)
Czech: 178 (0.2%)
Swedish: 166 (0.2%)
British: 120 (0.1%)
Welsh: 88 (0.08%)
Canadian: 78 (0.07%)
Israeli: 71 (0.07%)
Northern European: 66 (0.06%)
Norwegian: 65 (0.06%)
Lebanese: 64 (0.06%)
Iranian: 53 (0.05%)
Greek: 53 (0.05%)
Guyanese: 47 (0.04%)
West Indian: 46 (0.04%)
French Canadian: 38 (0.04%)
Eastern European: 32 (0.03%)
Danish: 32 (0.03%)
Russian: 31 (0.03%)
British West Indian: 30 (0.03%)
Cajun: 26 (0.02%)
Egyptian: 25 (0.02%)
Romanian: 20 (0.02%)
Hungarian: 20 (0.02%)
Brazilian: 17 (0.02%)
Swiss: 15 (0.01%)
Trinidadian and Tobagonian: 14 (0.01%)
Nigerian: 13 (0.01%)
Czechoslovakian: 12 (0.01%)
Jamaican: 12 (0.01%)
Lithuanian: 8 (0.01%)
Syrian: 7 (0.01%)
Iraqi: 7 (0.01%)
Ukrainian: 7 (0.01%)
Bulgarian: 6 (0.01%) Most common places of birth for foreign-born residents (%): Mexico Pasadena:
72.7% (29,399)Texas:
48.4% (2,411,723)
Honduras Pasadena:
6.6% (2,668)Texas:
3.0% (147,182)
El Salvador Pasadena:
4.7% (1,921)Texas:
4.5% (224,455)
Guatemala Pasadena:
3.5% (1,406)Texas:
1.8% (87,382)
India Pasadena:
2.0% (807)Texas:
6.1% (306,347)
Place of birth for U.S.-born residents:
This state: 88,597Other state: 18,893Northeast: 1,018Midwest: 5,137South: 6,856West: 5,882 82.8% of Pasadena residents lived in the same house 1 years ago.
Out of people who lived in different houses, 44.4% lived in this county.
Out of people who lived in different counties, 73.2% lived in Texas.
Pasadena:
82.8%State average:
85.7%
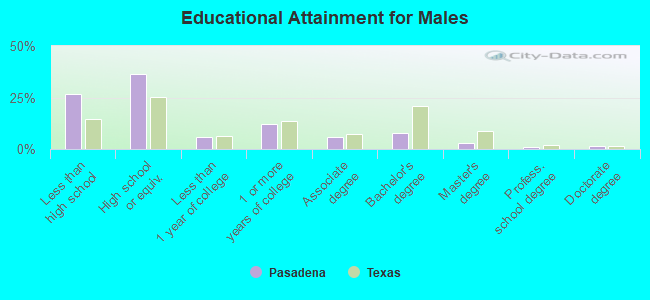
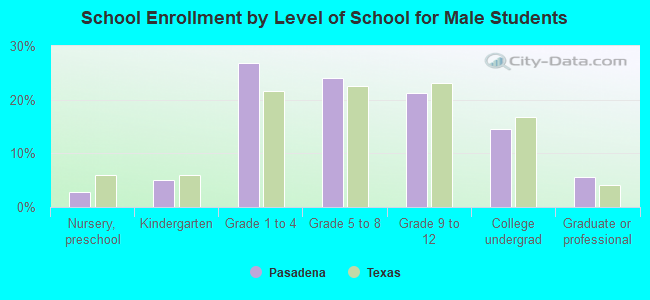
Education attainment for males 25 years and older:
No schooling: 3,028Nursery to 4th grade: 7925th and 6th grade: 8787th and 8th grade: 1,4439th grade: 1,57710th grade: 1,36011th grade: 41212th grade, no diploma: 1,742High school graduate (or equivalency): 15,396Less than 1 year of college: 2,518Some college more than 1 year, no degree: 5,212Associate degree: 2,506Bachelor's degree: 3,194Master's degree: 1,226Professional school degree: 472Doctorate degree: 680
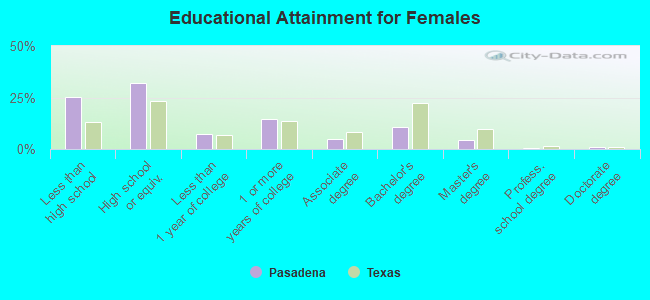
Education attainment for females 25 years and older:
No schooling: 1,984Nursery to 4th grade: 7645th and 6th grade: 2,4307th and 8th grade: 9669th grade: 79710th grade: 1,09211th grade: 1,39012th grade, no diploma: 1,493High school graduate (or equivalency): 13,962Less than 1 year of college: 3,124Some college more than 1 year, no degree: 6,278Associate degree: 2,087Bachelor's degree: 4,631Master's degree: 1,914Professional school degree: 167Doctorate degree: 466
Housing units in structures:
One, detached: 29,476One, attached: 1,960Two: 1843 or 4: 4,2715 to 9: 3,44510 to 19: 2,55020 to 49: 3,08550 or more: 6,867Mobile homes: 1,712Median worth of mobile homes: $63,200
Housing units lacking complete plumbing facilities in 2022: 2.5%Housing units lacking complete kitchen facilities in 2022: 1.7%House/condo owner moved in on average 14 years ago
Renter moved in on average 2 years ago
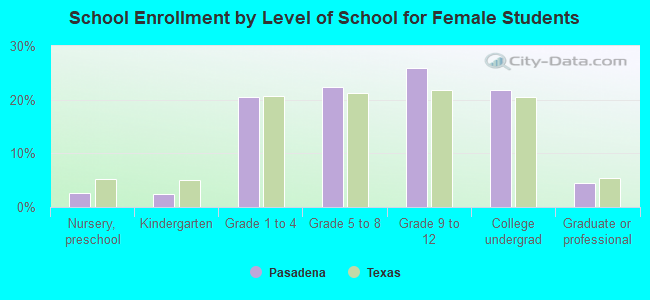
Private vs. public school enrollment:
Students in private schools in grades 1 to 8 (elementary and middle school): 575 Students in private schools in grades 9 to 12 (high school): 731 Students in private undergraduate colleges: 473