Plainview, TX (Texas) Houses and Residents
| Plainview: | $111,549 |
| Texas: | $275,400 |
Total population: 21,166 (All urban)
Houses: 8,813 (7,305 occupied: 3,896 owner occupied, 3,518 renter occupied)
| % of renters here: | 47% |
| State: | 38% |
Housing density: 640 houses/condos per square mile
Median price asked for vacant for-sale houses and condos in 2022: $452,863.
Median contract rent in 2022: $615 (lower quartile is $510, upper quartile is $809)
Median rent asked for vacant for-rent units in 2022: $561
Median gross rent in Plainview, TX in 2022: $786
Housing units in Plainview with a mortgage: 1,620 (52 second mortgage, 0 home equity loan, 36 both second mortgage and home equity loan)
Houses without a mortgage: 0
Median household income for houses/condos with a mortgage: $83,085
Median household income for apartments without a mortgage: $50,401
Median monthly housing costs: $759
Compare current foreclosures near Plainview, TX:
| Photo | Address | Area | Beds / Baths | Price | Details |
|---|---|---|---|---|---|

|
#1
Ebeling Dr
Plainview, TX 79072
|
2,586 sq. feet
|
2 baths 3 beds |
show details | |

|
#2
Dallas St
Plainview, TX 79072
|
1,820 sq. feet
|
2 baths 3 beds |
show details | |

|
#3
SE Alpine Dr
Plainview, TX 79072
|
1,112 sq. feet
|
- baths 3 beds |
show details | |

|
#4
Ennis St
Plainview, TX 79072
|
1,996 sq. feet
|
- baths 3 beds |
show details | |

|
#5
Mesa Dr
Plainview, TX 79072
|
1,294 sq. feet
|
- baths 3 beds |
show details | |

|
#6
Quincy St
Plainview, TX 79072
|
2,190 sq. feet
|
- baths 3 beds |
show details | |

|
#7
W 2nd St
Plainview, TX 79072
|
- sq. feet
|
- baths - beds |
show details | |

|
#8
W 16th St
Plainview, TX 79072
|
2,027 sq. feet
|
- baths - beds |
show details | |

|
#9
County Road O # A
Plainview, TX 79072
|
- sq. feet
|
- baths - beds |
show details | |

|
#10
W 20th St
Plainview, TX 79072
|
- sq. feet
|
- baths - beds |
show details |
| Photo | Address | Area | Beds / Baths | Price | Details |
|---|---|---|---|---|---|

|
#11
W 25th St
Plainview, TX 79072
|
1,248 sq. feet
|
- baths - beds |
show details | |

|
#12
Mulberry Ln
Plainview, TX 79072
|
- sq. feet
|
- baths - beds |
show details | |

|
#13
W 22nd St
Plainview, TX 79072
|
888 sq. feet
|
- baths - beds |
show details | |

|
#14
Vernon St
Plainview, TX 79072
|
1,426 sq. feet
|
- baths - beds |
show details | |

|
#15
E 34th St
Plainview, TX 79072
|
- sq. feet
|
- baths - beds |
show details | |

|
#16
Fm 400
Plainview, TX 79072
|
- sq. feet
|
- baths - beds |
show details | |

|
#17
W 16th St
Plainview, TX 79072
|
- sq. feet
|
- baths - beds |
show details | |

|
#18
Ripley Ave
Kress, TX 79052
|
1,290 sq. feet
|
1 baths 3 beds |
show details | |

|
#19
Caldwell Ave
Kress, TX 79052
|
- sq. feet
|
- baths - beds |
show details | |

|
Check over 1 million property listings on Foreclosure.com!
|
browse all offers | |||

Latest news about housing in Plainview, TX collected exclusively by city-data.com from local newspapers, TV, and radio stations

 | Thinking of moving from Maryland to Texas, pros and cons? (87 replies) |
| Anyone in Plainview? Relocating back home from OKC (0 replies) |
| Info on panhandle area wanted (5 replies) |
| From the Hudson Valley to DFW? (24 replies) |
| Amarillo or Lubbock? (20 replies) |
| Using propane tank if house only has electric (15 replies) |

Median year apartment built: 1973
Household type by relationship:
Households: 20,653- Male householders: 2,967 (632 living alone), Female householders: 4,236 (1,062 living alone)
3,330 spouses (3,245 opposite-sex spouses), 342 unmarried partners, (342 opposite-sex unmarried partners), 7,167 children (6,674 natural, 107 adopted, 385 stepchildren), 751 grandchildren, 265 brothers or sisters, 150 parents, 0 foster children, 282 other relatives, 415 non-relatives
- In group quarters: 741
Size of family households: 2,134 2-persons, 1,178 3-persons, 1,129 4-persons, 578 5-persons, 227 6-persons, 78 7-or-more-persons.
Size of nonfamily households: 1,786 1-person, 273 2-persons, 14 7-or-more-persons.
2,885 married couples with children.
2,220 single-parent households (294 men, 1,926 women).
58.9% of residents of Plainview speak English at home.
39.8% of residents speak Spanish at home (73% speak English very well, 9% speak English well, 11% speak English not well, 8% don't speak English at all).
0.8% of residents speak other Indo-European language at home (100% speak English very well).
0.2% of residents speak Asian or Pacific Island language at home (100% speak English very well).
0.4% of residents speak other language at home (21% speak English very well, 42% speak English well, 37% speak English not well).
Foreign born population: 2,457 (11.9%)
(34.1% of them are naturalized citizens)
| Here: | 5.9 |
| State: | 6.3 |
| Here: | 4.5 |
| State: | 4.0 |
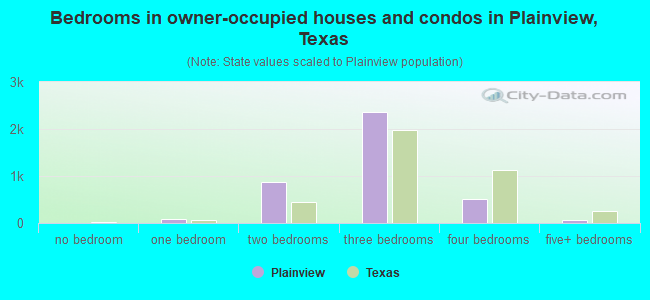
- Bedrooms in owner-occupied houses and condos in Plainview, Texas
- 7no bedroom
- 901 bedroom
- 8682 bedrooms
- 2,3633 bedrooms
- 5124 bedrooms
- 575+ bedrooms
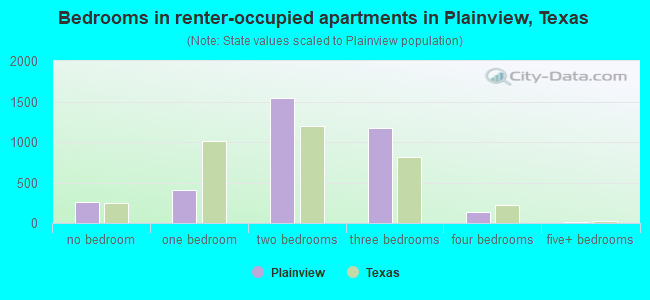
- Bedrooms in renter-occupied apartments in Plainview, Texas
- 265no bedroom
- 4071 bedroom
- 1,5382 bedrooms
- 1,1673 bedrooms
- 1304 bedrooms
- 125+ bedrooms
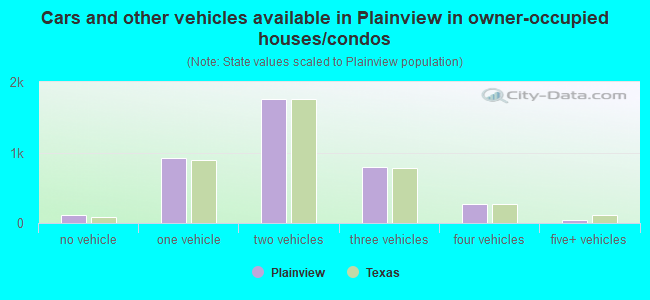
- Cars and other vehicles available in Plainview in owner-occupied houses/condos
- 119no vehicle
- 9211 vehicle
- 1,7532 vehicles
- 8013 vehicles
- 2654 vehicles
- 375+ vehicles
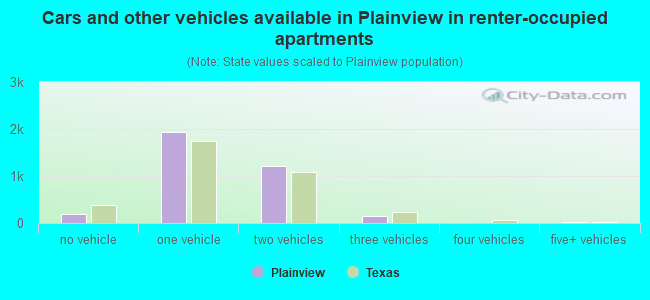
- Cars and other vehicles available in Plainview in renter-occupied apartments
- 188no vehicle
- 1,9311 vehicle
- 1,2222 vehicles
- 1543 vehicles
- 04 vehicles
- 235+ vehicles
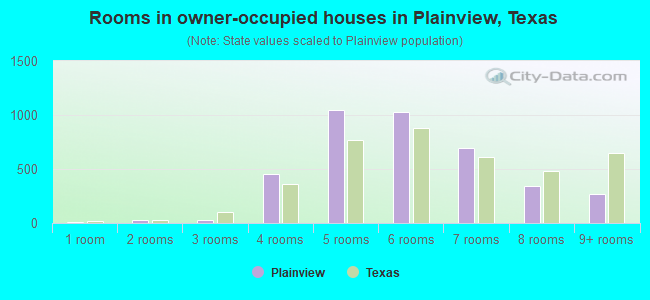
- Rooms in owner-occupied houses in Plainview, Texas
- 71 room
- 272 rooms
- 273 rooms
- 4534 rooms
- 1,0505 rooms
- 1,0246 rooms
- 6977 rooms
- 3388 rooms
- 2739+ rooms
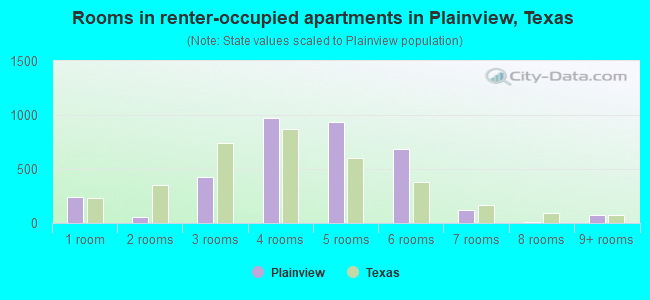
- Rooms in renter-occupied apartments in Plainview, Texas
- 2421 room
- 592 rooms
- 4233 rooms
- 9724 rooms
- 9365 rooms
- 6896 rooms
- 1177 rooms
- 68 rooms
- 739+ rooms
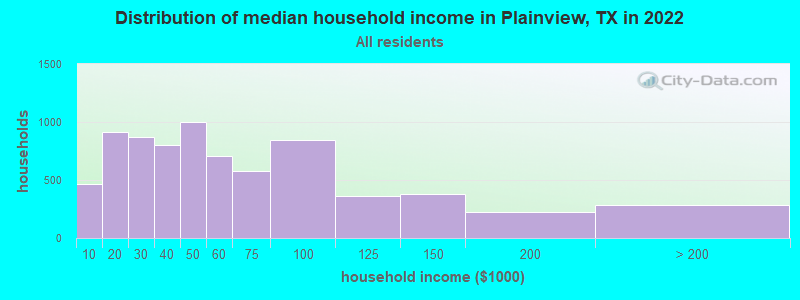
Plainview, TX household income distribution

- 467Less than $10,000
- 911$10,000 to $19,999
- 873$20,000 to $29,999
- 804$30,000 to $39,999
- 996$40,000 to $49,999
- 707$50,000 to $59,999
- 576$60,000 to $74,999
- 841$75,000 to $99,999
- 358$100,000 to $124,999
- 378$125,000 to $149,999
- 225$150,000 to $199,999
- 286$200,000 or more
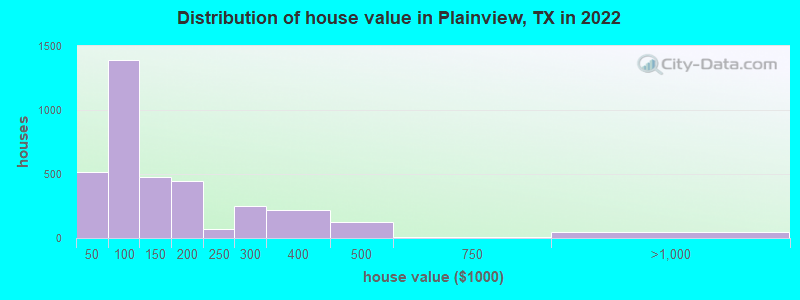
Home value of owner - occupied houses in 2022 in Plainview, TX
-
- 18$10,000 to $14,999
- 84$15,000 to $19,999
- 50$25,000 to $29,999
- 59$30,000 to $34,999
- 46$35,000 to $39,999
- 256$40,000 to $49,999
- 321$50,000 to $59,999
- 98$60,000 to $69,999
- 206$70,000 to $79,999
- 330$80,000 to $89,999
- 175$90,000 to $99,999
- 229$100,000 to $124,999
- 248$125,000 to $149,999
- 299$150,000 to $174,999
- 149$175,000 to $199,999
- 70$200,000 to $249,999
- 252$250,000 to $299,999
- 217$300,000 to $399,999
- 125$400,000 to $499,999
- 9$500,000 to $749,999
- 46$750,000 to $999,999
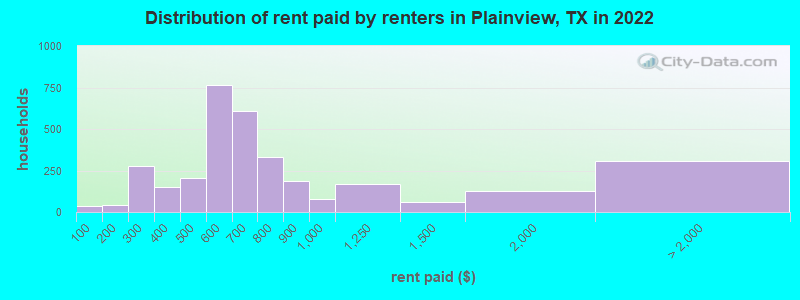
Rent paid by renters in 2022 in Plainview, TX
-
- 34Less than $100
- 45$150 to $199
- 237$200 to $249
- 37$250 to $299
- 41$300 to $349
- 107$350 to $399
- 70$400 to $449
- 132$450 to $499
- 433$500 to $549
- 330$550 to $599
- 321$600 to $649
- 286$650 to $699
- 31$700 to $749
- 298$750 to $799
- 188$800 to $899
- 76$900 to $999
- 166$1,000 to $1,249
- 58$1,250 to $1,499
- 124$1,500 to $1,999
- 61$3,000 to $3,499
- 248No cash rent
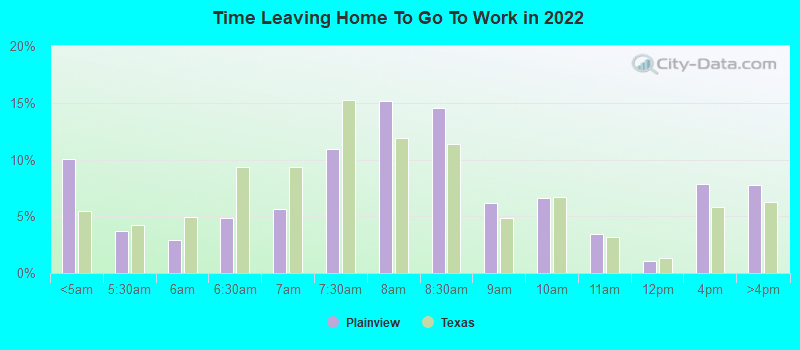
Percentage of workers working in this county: 81.9%
Number of people working at home: 277 (3.0% of all workers)
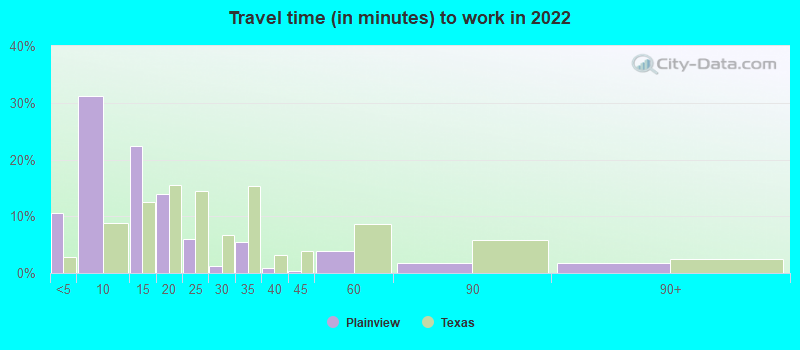
Travel time to work (commute)
- Less than 5 minutes: 869
- 5 to 9 minutes: 2,508
- 10 to 14 minutes: 1,843
- 15 to 19 minutes: 1,323
- 20 to 24 minutes: 315
- 25 to 29 minutes: 23
- 30 to 34 minutes: 593
- 35 to 39 minutes: 0
- 40 to 44 minutes: 76
- 45 to 59 minutes: 421
- 60 to 89 minutes: 428
- 90 or more minutes: 163
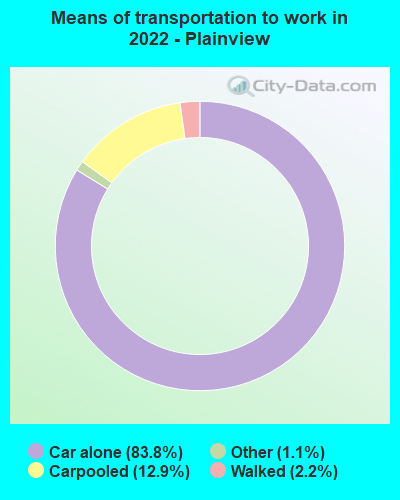
Means of transportation to work:
- Drove a car alone: 7,114 (77.7%)
- Carpooled: 1,186 (12.9%)
- Taxi: 118 (1.3%)
- Walked: 198 (2.2%)
- Worked at home: 277 (3.0%)
- Unemployment by race in 2022
- Unemployment rate for White non-Hispanic residents
- 6.1%Males
- 5.7%Females
- Unemployment rate for Black residents
- 17.6%Males
- 2.4%Females
- Unemployment rate for other race residents
- 1.1%Males
- 16.4%Females
- Unemployment rate for two or more race residents
- 1.4%Males
- 0.8%Females
- Unemployment rate for Hispanic or Latino residents
- 3.7%Males
- 8.1%Females
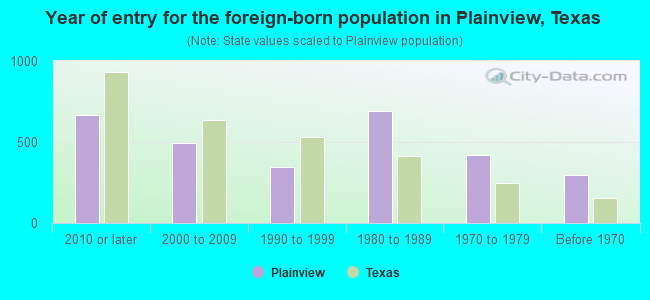
- Year of entry for the foreign-born population in Plainview, Texas
- 6662010 or later
- 4942000 to 2009
- 3461990 to 1999
- 6931980 to 1989
- 4201970 to 1979
- 294Before 1970
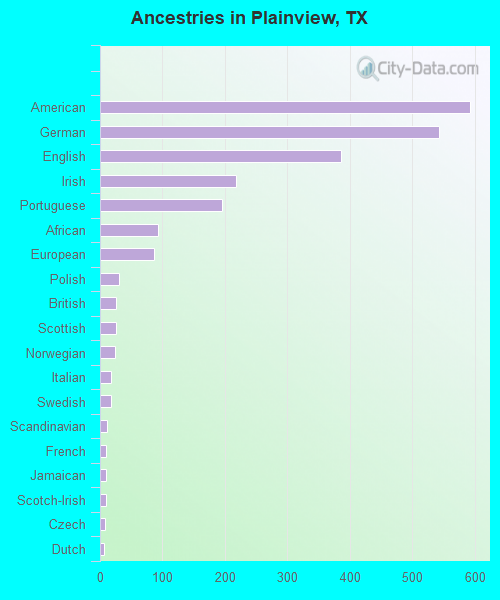
First ancestries reported:
- American: 593 (4.8%)
- German: 542 (4.4%)
- English: 386 (3.1%)
- Irish: 217 (1.7%)
- Portuguese: 195 (1.6%)
- African: 93 (0.7%)
- European: 86 (0.7%)
- Polish: 30 (0.2%)
- British: 26 (0.2%)
- Scottish: 25 (0.2%)
- Norwegian: 24 (0.2%)
- Italian: 17 (0.1%)
- Swedish: 17 (0.1%)
- Scandinavian: 11 (0.09%)
- French: 10 (0.08%)
- Jamaican: 10 (0.08%)
- Scotch-Irish: 9 (0.07%)
- Czech: 8 (0.06%)
- Dutch: 6 (0.05%)
Most common places of birth for foreign-born residents (%):
| Plainview: | 72.4% (1,778) |
| Texas: | 48.4% (2,411,723) |
| Plainview: | 9.8% (240) |
| Texas: | 3.0% (147,182) |
| Plainview: | 3.0% (73) |
| Texas: | 0.1% (5,595) |
| Plainview: | 2.6% (63) |
| Texas: | 1.2% (61,555) |
| Plainview: | 2.3% (57) |
| Texas: | 4.5% (224,455) |
| Plainview: | 2.2% (54) |
| Texas: | 0.6% (27,480) |
| Plainview: | 1.9% (46) |
| Texas: | 0.8% (37,989) |
| Plainview: | 1.5% (37) |
| Texas: | 0.2% (7,897) |
Place of birth for U.S.-born residents:
- This state: 15,284
- Other state: 2,652
- Northeast: 203
- Midwest: 656
- South: 798
- West: 1,009
79.6% of Plainview residents lived in the same house 1 years ago.
Out of people who lived in different houses, 36.7% lived in this county.
Out of people who lived in different counties, 83.1% lived in Texas.
| Plainview: | 79.6% |
| State average: | 85.7% |
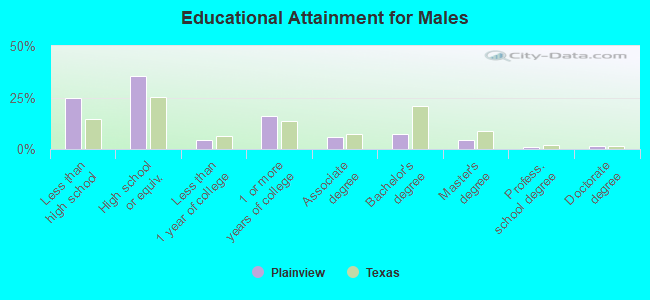
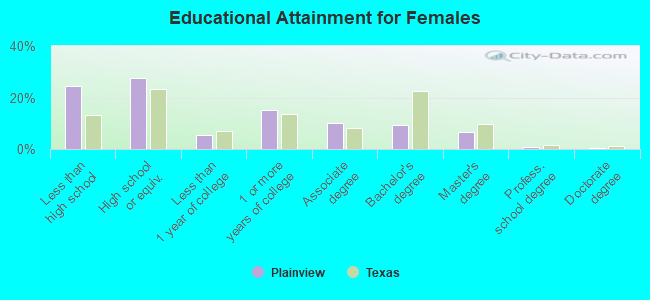
Education attainment for males 25 years and older:
- No schooling: 418
- Nursery to 4th grade: 218
- 5th and 6th grade: 168
- 7th and 8th grade: 111
- 9th grade: 186
- 10th grade: 101
- 11th grade: 93
- 12th grade, no diploma: 47
- High school graduate (or equivalency): 1,933
- Less than 1 year of college: 230
- Some college more than 1 year, no degree: 871
- Associate degree: 310
- Bachelor's degree: 409
- Master's degree: 233
- Professional school degree: 51
- Doctorate degree: 92
Education attainment for females 25 years and older:
- No schooling: 225
- Nursery to 4th grade: 136
- 5th and 6th grade: 263
- 7th and 8th grade: 354
- 9th grade: 208
- 10th grade: 131
- 11th grade: 107
- 12th grade, no diploma: 94
- High school graduate (or equivalency): 1,726
- Less than 1 year of college: 333
- Some college more than 1 year, no degree: 951
- Associate degree: 638
- Bachelor's degree: 580
- Master's degree: 410
- Professional school degree: 38
- Doctorate degree: 24


Housing units in structures:
- One, detached: 6,397
- One, attached: 219
- Two: 365
- 3 or 4: 556
- 5 to 9: 250
- 10 to 19: 407
- 20 to 49: 251
- 50 or more: 109
- Mobile homes: 256
Housing units lacking complete kitchen facilities in 2022: 9.9%
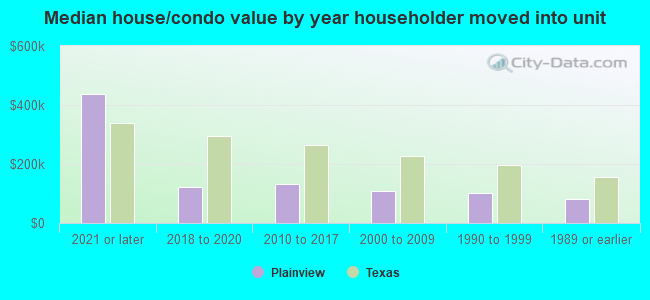
House/condo owner moved in on average 17 years ago
Renter moved in on average 3 years ago
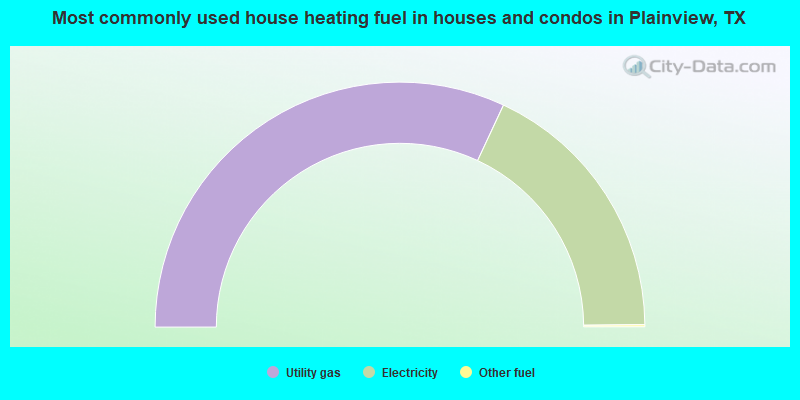
- 63.9%Utility gas
- 35.8%Electricity
- 0.3%Other fuel
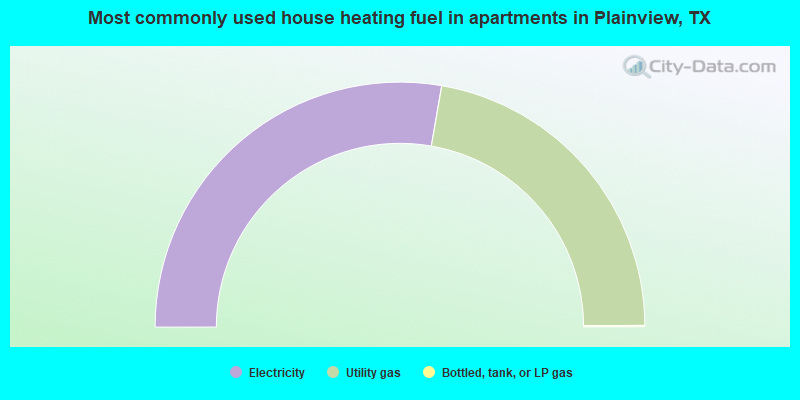
- 55.4%Electricity
- 44.3%Utility gas
- 0.2%Bottled, tank, or LP gas
Private vs. public school enrollment:
| Here: | 4.2% |
| Texas: | 8.8% |
| Here: | 12.1% |
| Texas: | 8.0% |
| Here: | 52.4% |
| Texas: | 16.2% |