Portland, CT (Connecticut) Houses and Residents
| Portland: | $274,585 |
| Connecticut: | $347,200 |
Mean price in 2022:
Detached houses: $330,585
Here: $330,585 State: $503,946 Townhouses or other attached units: $316,776
Here: $316,776 State: $304,959 In 2-unit structures: $320,807
Here: $320,807 State: $304,133 In 3-to-4-unit structures: $200,399
Here: $200,399 State: $272,970 In 5-or-more-unit structures: $126,515
Here: $126,515 State: $249,308
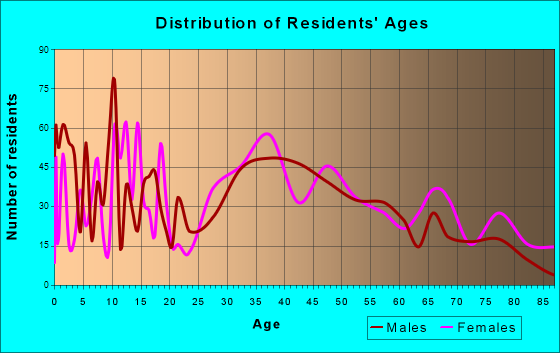
Total population: 5,862 (Urban population: 5,178, Rural population: 375 (all nonfarm))
Houses: 2,656 (2,516 occupied: 1,953 owner occupied, 590 renter occupied)
| % of renters here: | 23% |
| State: | 34% |
Housing density: 538 houses/condos per square mile
Median price asked for vacant for-sale houses and condos in 2022: $202,079.
Median contract rent in 2022: $1,036 (lower quartile is $843, upper quartile is $1,243)
Median rent asked for vacant for-rent units in 2022: $671
Median gross rent in Portland, CT in 2022: $1,179
Housing units in Portland with a mortgage: 1,340 (97 second mortgage, 0 home equity loan, 44 both second mortgage and home equity loan)
Houses without a mortgage: 114
Median household income for houses/condos with a mortgage: $155,117
Median household income for apartments without a mortgage: $78,919
Median monthly housing costs: $1,575
Compare current foreclosures near Portland, CT:
| Photo | Address | Area | Beds / Baths | Price | Details |
|---|---|---|---|---|---|

|
#1
Tuccitto Rd
Portland, CT 06480
|
816 sq. feet
|
1 baths 2 beds |
show details | |

|
#2
Fairview St
Portland, CT 06480
|
1,460 sq. feet
|
1 baths 4 beds |
show details | |

|
#3
Riverside St
Portland, CT 06480
|
1,274 sq. feet
|
1 baths 2 beds |
show details | |

|
#4
Middlesex Avenue Ext
Portland, CT 06480
|
1,596 sq. feet
|
1 baths 3 beds |
show details | |

|
#5
Penny Corner Rd
Portland, CT 06480
|
- sq. feet
|
- baths - beds |
show details | |

|
#6
Willis Ave
Meriden, CT 06450
|
1,008 sq. feet
|
1 baths 2 beds |
$299,900
|
show details |

|
#7
Bronson Ave
Meriden, CT 06451
|
1,150 sq. feet
|
1 baths 3 beds |
$299,900
|
show details |

|
#8
Peck St
Berlin, CT 06037
|
608 sq. feet
|
1 baths 1 beds |
$144,900
|
show details |

|
#9
Irving St
Manchester, CT 06042
|
1,335 sq. feet
|
2 baths 3 beds |
$265,000
|
show details |

|
#10
Royal Oak Lane
Wallingford, CT 06492
|
2,607 sq. feet
|
2 baths 4 beds |
$684,900
|
show details |
| Photo | Address | Area | Beds / Baths | Price | Details |
|---|---|---|---|---|---|

|
#11
Roosevelt St
New Britain, CT 06051
|
1,536 sq. feet
|
2 baths 3 beds |
$299,900
|
show details |

|
#12
Railroad Ave
Chester, CT 06412
|
2,092 sq. feet
|
2 baths 4 beds |
$499,900
|
show details |

|
#13
Spring St
Glastonbury, CT 06033
|
1,284 sq. feet
|
1 baths 3 beds |
$296,400
|
show details |

|
#14
Westchester Rd
Colchester, CT 06415
|
900 sq. feet
|
1 baths 2 beds |
$309,900
|
show details |

|
#15
Shares Ln
South Windsor, CT 06074
|
1,850 sq. feet
|
2 baths 4 beds |
$385,000
|
show details |

|
#16
Portland Cobalt Rd # 3
Portland, CT 06480
|
- sq. feet
|
- baths - beds |
show details | |

|
#17
Park Rd
Marlborough, CT 06447
|
1,134 sq. feet
|
1 baths 3 beds |
show details | |

|
#18
237 Ridgefield Stree
Hartford, CT 06112
|
- sq. feet
|
3 baths 6 beds |
show details | |

|
#19
Cornwall St
Hartford, CT 06112
|
1,248 sq. feet
|
1 baths 3 beds |
show details | |

|
#20
Avery Ave
Meriden, CT 06450
|
1,508 sq. feet
|
1 baths 3 beds |
show details |
| Photo | Address | Area | Beds / Baths | Price | Details |
|---|---|---|---|---|---|

|
#21
Main St
Newington, CT 06111
|
1,512 sq. feet
|
1 baths 4 beds |
show details | |

|
#22
Butternut Ln
Rocky Hill, CT 06067
|
1,176 sq. feet
|
1 baths 2 beds |
show details | |

|
#23
Main St
Meriden, CT 06451
|
1,008 sq. feet
|
1 baths 3 beds |
show details | |

|
#24
21 Webster St
New Britain, CT 06051
|
3 sq. feet
|
2 baths 6 beds |
show details | |

|
#25
City Ave
New Britain, CT 06051
|
1,932 sq. feet
|
1 baths 3 beds |
show details | |

|
#26
Lydale Pl
Meriden, CT 06450
|
1,716 sq. feet
|
2 baths 3 beds |
show details | |

|
#27
Pond St
New Britain, CT 06051
|
2,400 sq. feet
|
2 baths 6 beds |
show details | |

|
#28
Northbrook Ct # 9
East Hartford, CT 06108
|
1,130 sq. feet
|
2 baths 2 beds |
show details | |

|
#29
Hope Valley Rd
Amston, CT 06231
|
2,128 sq. feet
|
2 baths 3 beds |
show details | |

|
#30
Stanley St
New Britain, CT 06051
|
- sq. feet
|
3 baths 6 beds |
show details |
| Photo | Address | Area | Beds / Baths | Price | Details |
|---|---|---|---|---|---|

|
#31
Deepwood Dr
Manchester, CT 06040
|
734 sq. feet
|
1 baths 2 beds |
show details | |

|
#32
Reskin Dr
Wallingford, CT 06492
|
2,303 sq. feet
|
1 baths 4 beds |
show details | |

|
#33
Amity St
Meriden, CT 06450
|
1,568 sq. feet
|
2 baths 3 beds |
show details | |

|
#34
Churchill Dr
Newington, CT 06111
|
1,116 sq. feet
|
1 baths 2 beds |
show details | |

|
#35
Bell Ct Apt C1
East Hartford, CT 06108
|
890 sq. feet
|
1 baths 2 beds |
show details | |

|
#36
Pratt St
Meriden, CT 06450
|
1,040 sq. feet
|
2 baths 3 beds |
show details | |

|
#37
Obrien Dr
Meriden, CT 06450
|
1,612 sq. feet
|
2 baths 2 beds |
show details | |

|
#38
Hollister Dr
East Hartford, CT 06118
|
1,300 sq. feet
|
1 baths 3 beds |
show details | |

|
#39
Cartpath Dr
Meriden, CT 06450
|
804 sq. feet
|
1 baths 2 beds |
show details | |

|
#40
Orient St
Meriden, CT 06450
|
1,780 sq. feet
|
3 baths 3 beds |
show details |
| Photo | Address | Area | Beds / Baths | Price | Details |
|---|---|---|---|---|---|

|
#41
Mohawk Dr
Wallingford, CT 06492
|
1,524 sq. feet
|
3 baths 4 beds |
show details | |

|
#42
Farmington Chase Cre
Farmington, CT 06032
|
1,317 sq. feet
|
1 baths 2 beds |
show details | |

|
#43
Horne Cir
Southington, CT 06489
|
1,902 sq. feet
|
2 baths 4 beds |
show details | |

|
#44
Feather Ln
North Branford, CT 06471
|
4,408 sq. feet
|
2 baths 4 beds |
show details | |

|
#45
Dover Rd
New Britain, CT 06052
|
2,212 sq. feet
|
2 baths 3 beds |
show details | |

|
#46
Broadview Ter
Hartford, CT 06106
|
1,821 sq. feet
|
2 baths 7 beds |
show details | |

|
#47
Poplar Rd
Middletown, CT 06457
|
1,242 sq. feet
|
1 baths 3 beds |
show details | |

|
#48
Cheshire St
Hartford, CT 06114
|
3,279 sq. feet
|
2 baths 4 beds |
show details | |

|
#49
E Main St
Middletown, CT 06457
|
1,736 sq. feet
|
2 baths 3 beds |
show details | |

|
Check over 1 million property listings on Foreclosure.com!
|
browse all offers | |||

Latest news about housing in Portland, CT collected exclusively by city-data.com from local newspapers, TV, and radio stations

 | Current Real estate markets (3987 replies) |
| 2024 Connecticut Town Tournament VI (Celebrating the 10-Year Anniversary & Dazzleman's Memorial) (746 replies) |
| condo/house - confused (34 replies) |
| Desegregate Connecticut---Raised CT Zoning Bill (2512 replies) |
| Moving to CT to flee Red States - CT as a Sanctuary State (242 replies) |
| Connecticut cities ranked - All 21 cities for interest and visitor appeal (77 replies) |
Median year apartment built: 1943
Household type by relationship:
Households: 6,443- Male householders: 1,319 (286 living alone), Female householders: 1,192 (363 living alone)
1,384 spouses (1,370 opposite-sex spouses), 137 unmarried partners, (77 opposite-sex unmarried partners), 1,726 children (1,564 natural, 0 adopted, 161 stepchildren), 121 grandchildren, 85 brothers or sisters, 83 parents, 0 foster children, 95 other relatives, 167 non-relatives
- In group quarters: 129
Size of family households: 719 2-persons, 335 3-persons, 406 4-persons, 163 5-persons, 39 6-persons, 19 7-or-more-persons.
Size of nonfamily households: 685 1-person, 121 2-persons, 40 3-persons.
933 married couples with children.
318 single-parent households (61 men, 257 women).
91.4% of residents of Portland speak English at home.
3.0% of residents speak Spanish at home (100% speak English very well).
1.2% of residents speak other Indo-European language at home (72% speak English very well, 19% speak English well, 9% speak English not well).
4.0% of residents speak Asian or Pacific Island language at home (13% speak English very well, 59% speak English well, 28% speak English not well).
Foreign born population: 421 (6.5%)
(56.5% of them are naturalized citizens)
| Here: | 6.2 |
| State: | 6.5 |
| Here: | 4.0 |
| State: | 4.0 |

- Bedrooms in owner-occupied houses and condos in Portland, Connecticut
- 0no bedroom
- 421 bedroom
- 3872 bedrooms
- 1,0543 bedrooms
- 3664 bedrooms
- 1055+ bedrooms

- Bedrooms in renter-occupied apartments in Portland, Connecticut
- 0no bedroom
- 2591 bedroom
- 1152 bedrooms
- 2173 bedrooms
- 04 bedrooms
- 05+ bedrooms

- Cars and other vehicles available in Portland in owner-occupied houses/condos
- 31no vehicle
- 3241 vehicle
- 1,0392 vehicles
- 3973 vehicles
- 1494 vehicles
- 135+ vehicles

- Cars and other vehicles available in Portland in renter-occupied apartments
- 79no vehicle
- 2301 vehicle
- 2032 vehicles
- 223 vehicles
- 04 vehicles
- 565+ vehicles

- Rooms in owner-occupied houses in Portland, Connecticut
- 01 room
- 52 rooms
- 03 rooms
- 824 rooms
- 4465 rooms
- 6346 rooms
- 3207 rooms
- 1938 rooms
- 2739+ rooms

- Rooms in renter-occupied apartments in Portland, Connecticut
- 01 room
- 172 rooms
- 2023 rooms
- 1304 rooms
- 1415 rooms
- 416 rooms
- 447 rooms
- 158 rooms
- 09+ rooms


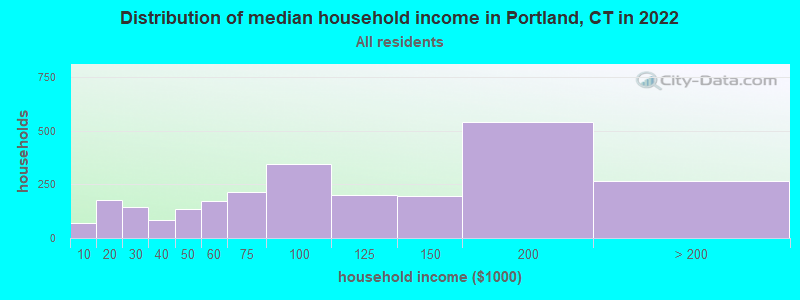
Portland, CT household income distribution

- 68Less than $10,000
- 179$10,000 to $19,999
- 146$20,000 to $29,999
- 86$30,000 to $39,999
- 136$40,000 to $49,999
- 172$50,000 to $59,999
- 214$60,000 to $74,999
- 343$75,000 to $99,999
- 199$100,000 to $124,999
- 197$125,000 to $149,999
- 540$150,000 to $199,999
- 264$200,000 or more
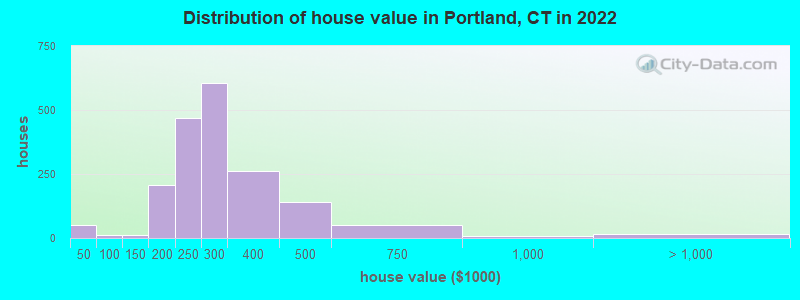
Home value of owner - occupied houses in 2022 in Portland, CT
-
- 21$15,000 to $19,999
- 8$20,000 to $24,999
- 12$25,000 to $29,999
- 7$35,000 to $39,999
- 12$90,000 to $99,999
- 11$100,000 to $124,999
- 25$150,000 to $174,999
- 182$175,000 to $199,999
- 470$200,000 to $249,999
- 605$250,000 to $299,999
- 263$300,000 to $399,999
- 139$400,000 to $499,999
- 50$500,000 to $749,999
- 6$750,000 to $999,999
- 14$2,000,000 or more
Rent paid by renters in 2022 in Portland, CT
-
- 16$200 to $249
- 16$300 to $349
- 44$400 to $449
- 6$750 to $799
- 132$800 to $899
- 57$900 to $999
- 190$1,000 to $1,249
- 36$1,250 to $1,499
- 96$1,500 to $1,999


Percentage of workers working in this county: 61.5%
Number of people working at home: 673 (19.0% of all workers)
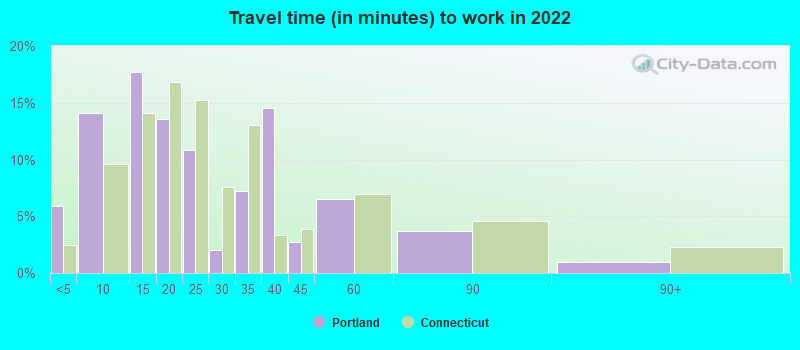
Travel time to work (commute)
- Less than 5 minutes: 212
- 5 to 9 minutes: 273
- 10 to 14 minutes: 184
- 15 to 19 minutes: 466
- 20 to 24 minutes: 223
- 25 to 29 minutes: 163
- 30 to 34 minutes: 416
- 35 to 39 minutes: 173
- 40 to 44 minutes: 48
- 45 to 59 minutes: 609
- 60 to 89 minutes: 95
- 90 or more minutes: 58
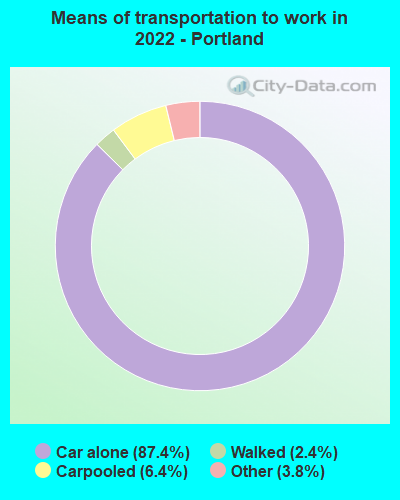
Means of transportation to work:
- Drove a car alone: 1,613 (65.2%)
- Carpooled: 125 (5.1%)
- Taxi: 85 (3.4%)
- Walked: 48 (1.9%)
- Worked at home: 673 (27.2%)

- Unemployment by race in 2022
- Unemployment rate for White non-Hispanic residents
- 5.4%Males
- 3.6%Females
- Unemployment rate for Asian residents
- 22.9%Males
- Unemployment rate for other race residents
- 16.1%Males

- Year of entry for the foreign-born population in Portland, Connecticut
- 1862010 or later
- 722000 to 2009
- 681990 to 1999
- 511980 to 1989
- 91970 to 1979
- 180Before 1970

First ancestries reported:
- Italian: 273 (15.9%)
- American: 235 (13.7%)
- Irish: 215 (12.5%)
- Polish: 199 (11.6%)
- German: 78 (4.5%)
- European: 75 (4.4%)
- English: 37 (2.2%)
- French Canadian: 35 (2.0%)
- Russian: 34 (2.0%)
- French: 19 (1.1%)
- Scottish: 17 (1.0%)
- Hungarian: 8 (0.5%)
- Swedish: 7 (0.4%)
- Eastern European: 4 (0.2%)
Most common places of birth for foreign-born residents (%):
| Portland: | 19.5% (82) |
| Connecticut: | 0.3% (1,499) |
| Portland: | 16.2% (68) |
| Connecticut: | 1.4% (7,495) |
| Portland: | 15.7% (66) |
| Connecticut: | 1.2% (6,678) |
| Portland: | 12.1% (51) |
| Connecticut: | 4.4% (24,001) |
| Portland: | 10.7% (45) |
| Connecticut: | 2.5% (13,591) |
| Portland: | 8.6% (36) |
| Connecticut: | 1.3% (7,149) |
| Portland: | 7.6% (32) |
| Connecticut: | 4.8% (25,802) |
| Portland: | 5.7% (24) |
| Connecticut: | 2.8% (15,141) |
| Portland: | 4.3% (18) |
| Connecticut: | 1.2% (6,448) |
Place of birth for U.S.-born residents:
- This state: 4,979
- Other state: 919
- Northeast: 583
- Midwest: 99
- South: 161
- West: 73
89.5% of Portland residents lived in the same house 1 years ago.
Out of people who lived in different houses, 25.2% lived in this county.
Out of people who lived in different counties, 93.2% lived in Connecticut.
| Portland: | 89.5% |
| State average: | 88.4% |
Education attainment for males 25 years and older:
- No schooling: 22
- Nursery to 4th grade: 7
- 5th and 6th grade: 8
- 7th and 8th grade: 10
- 9th grade: 33
- 10th grade: 116
- 11th grade: 73
- 12th grade, no diploma: 78
- High school graduate (or equivalency): 473
- Less than 1 year of college: 114
- Some college more than 1 year, no degree: 352
- Associate degree: 231
- Bachelor's degree: 472
- Master's degree: 189
- Professional school degree: 12
- Doctorate degree: 25

Education attainment for females 25 years and older:
- No schooling: 0
- Nursery to 4th grade: 0
- 5th and 6th grade: 0
- 7th and 8th grade: 15
- 9th grade: 6
- 10th grade: 0
- 11th grade: 12
- 12th grade, no diploma: 0
- High school graduate (or equivalency): 491
- Less than 1 year of college: 217
- Some college more than 1 year, no degree: 240
- Associate degree: 164
- Bachelor's degree: 786
- Master's degree: 392
- Professional school degree: 11
- Doctorate degree: 65

Housing units in structures:
- One, detached: 1,965
- One, attached: 81
- Two: 262
- 3 or 4: 205
- 5 to 9: 21
- 10 to 19: 37
- 20 to 49: 28
- 50 or more: 55
Housing units lacking complete kitchen facilities in 2022: 0.4%
House/condo owner moved in on average 9 years ago
Renter moved in on average 3 years ago

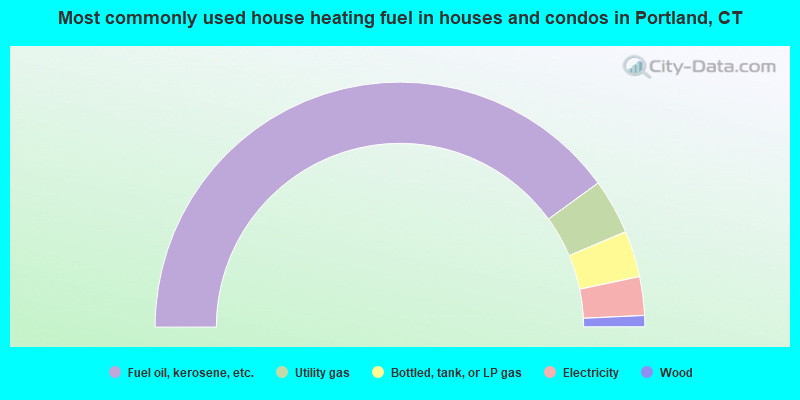
- 80.0%Fuel oil, kerosene, etc.
- 7.3%Utility gas
- 6.1%Bottled, tank, or LP gas
- 5.1%Electricity
- 1.5%Wood
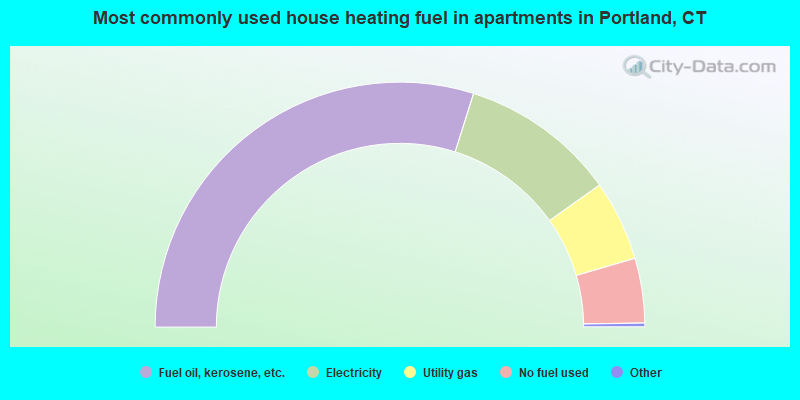
- 60.1%Fuel oil, kerosene, etc.
- 20.7%Electricity
- 10.7%Utility gas
- 8.6%No fuel used
Private vs. public school enrollment:
| Here: | 0.0% |
| Connecticut: | 9.5% |
| Here: | 12.9% |
| Connecticut: | 12.9% |
| Here: | 9.3% |
| Connecticut: | 35.5% |


