Housing density: 248 houses/condos per square mile
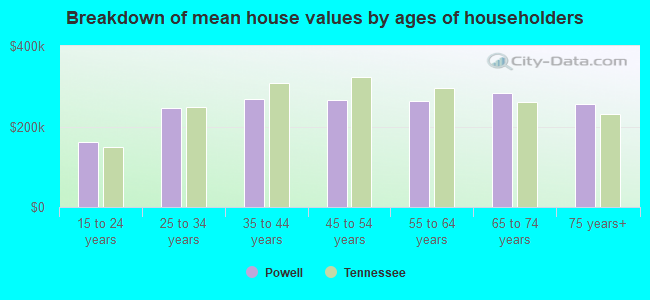
Median price asked for vacant for-sale houses and condos in 2022 in this county: $410,747.
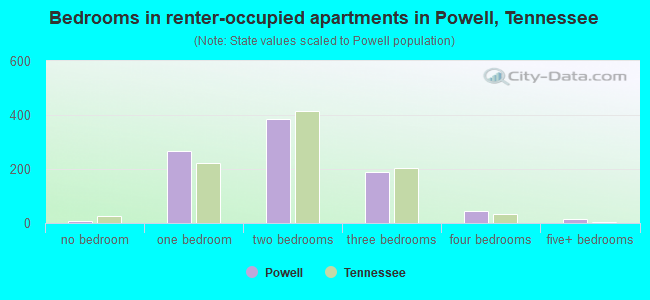
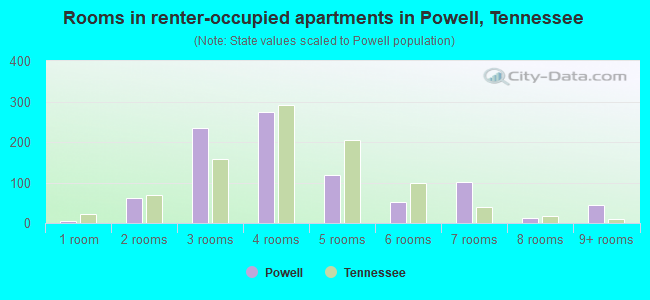
Median contract rent in 2022: $810 (lower quartile is $525, upper quartile is $1,143)
Median rent asked for vacant for-rent units in 2022: $886
Median gross rent in Powell, TN in 2022: $1,017
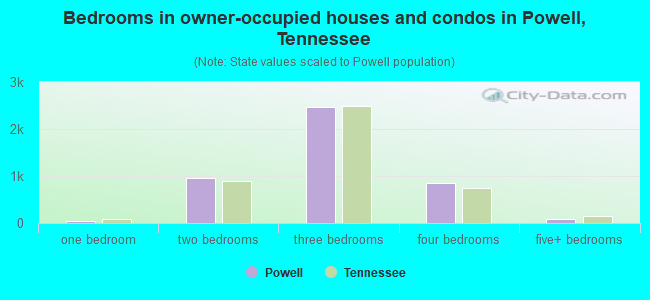
Housing units in Powell with a mortgage: 2,252 (224 second mortgage, 328 home equity loan, 0 both second mortgage and home equity loan) Houses without a mortgage: 1,057
In family households: 334,598 (78,196 male householders, 32,561 female householders)
83,377 spouses, 110,923 children (102,076 natural, 3,343 adopted, 5,504 stepchildren), 8,705 grandchildren, 3,434 brothers or sisters, 2,960 parents, foster children, 4,342 other relatives, 7,948 non-relatives
In nonfamily households: 85,280 (30,493 male householders (22,660 living alone)), 35,999 female householders (29,897 living alone)), 18,788 nonrelatives
In group quarters: 12,348 (3,241 institutionalized population)
58,209 married couples with children.
19,202 single-parent households (3,366 men, 15,836 women).
97.6% of residents of Powell speak English at home.
0.5% of residents speak Spanish at home (71% speak English very well, 29% speak English well).
1.5% of residents speak other Indo-European language at home (100% speak English very well).
0.3% of residents speak Asian or Pacific Island language at home (59% speak English very well, 41% speak English well).
0.1% of residents speak other language at home (100% speak English very well).
Foreign born population: 494 (2.8%)
(76.9% of them are naturalized citizens)
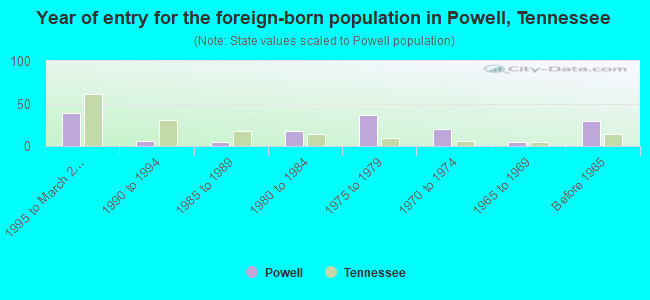
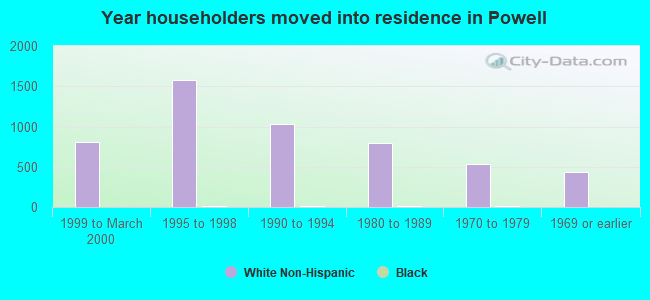
Year of entry for the foreign-born population in Powell, Tennessee
391995 to March 2000
61990 to 1994
51985 to 1989
181980 to 1984
361975 to 1979
201970 to 1974
51965 to 1969
29Before 1965
Most common places of birth for foreign-born residents (%):
India
Powell:
25.3% (40)
Tennessee:
4.8% (7,701)
Germany
Powell:
20.9% (33)
Tennessee:
5.2% (8,316)
Cambodia
Powell:
13.3% (21)
Tennessee:
0.7% (1,046)
Vietnam
Powell:
11.4% (18)
Tennessee:
3.7% (5,949)
Ukraine
Powell:
6.3% (10)
Tennessee:
0.5% (849)
Egypt
Powell:
5.7% (9)
Tennessee:
0.9% (1,385)
Korea
Powell:
5.1% (8)
Tennessee:
3.8% (6,106)
Sweden
Powell:
4.4% (7)
Tennessee:
0.2% (284)
United Kingdom
Powell:
3.8% (6)
Tennessee:
3.6% (5,726)
Czechoslovakia (includes Czech Republic and Slovakia)
Powell:
3.8% (6)
Tennessee:
0.3% (504)
Place of birth for U.S.-born residents:
This state: 9,933
Other state: 3,443
Northeast: 434
Midwest: 915
South: 1,843
West: 251
58% of Powell residents lived in the same house 5 years ago. Out of people who lived in different houses, 65% lived in this county. Out of people who lived in different counties, 34% lived in Tennessee.
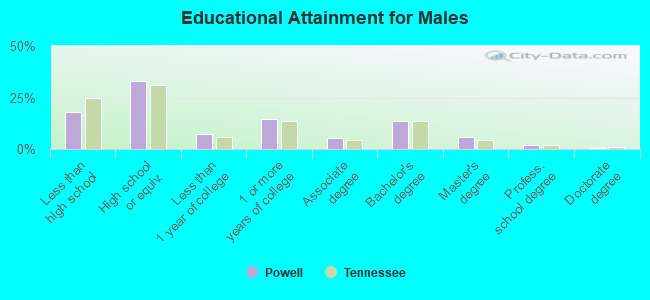
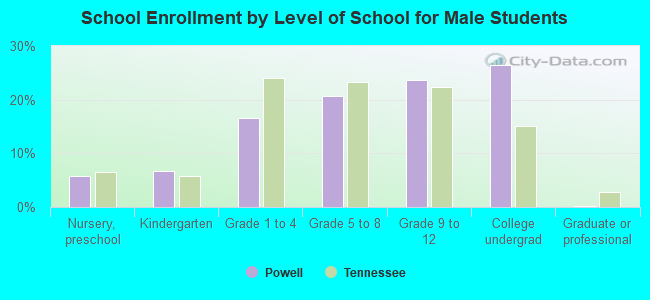
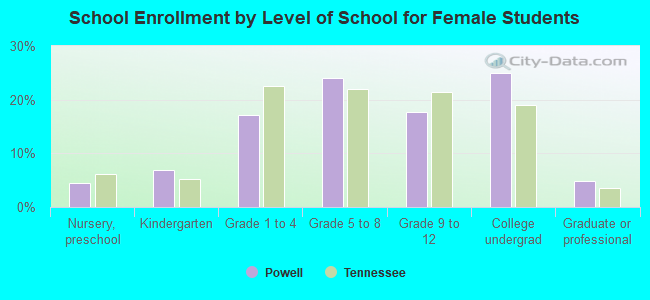
Education attainment for males 25 years and older:
No schooling: 41
Nursery to 4th grade: 27
5th and 6th grade: 62
7th and 8th grade: 122
9th grade: 89
10th grade: 138
11th grade: 138
12th grade, no diploma: 140
High school graduate (or equivalency): 1,398
Less than 1 year of college: 302
Some college more than 1 year, no degree: 614
Associate degree: 237
Bachelor's degree: 587
Master's degree: 242
Professional school degree: 79
Doctorate degree: 29
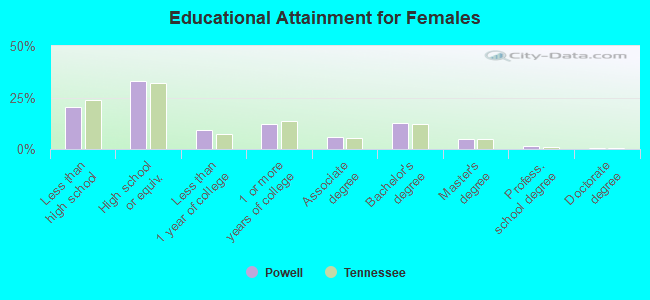
Education attainment for females 25 years and older:
No schooling: 26
Nursery to 4th grade: 21
5th and 6th grade: 57
7th and 8th grade: 235
9th grade: 101
10th grade: 246
11th grade: 164
12th grade, no diploma: 140
High school graduate (or equivalency): 1,583
Less than 1 year of college: 444
Some college more than 1 year, no degree: 577
Associate degree: 269
Bachelor's degree: 604
Master's degree: 241
Professional school degree: 66
Doctorate degree: 25
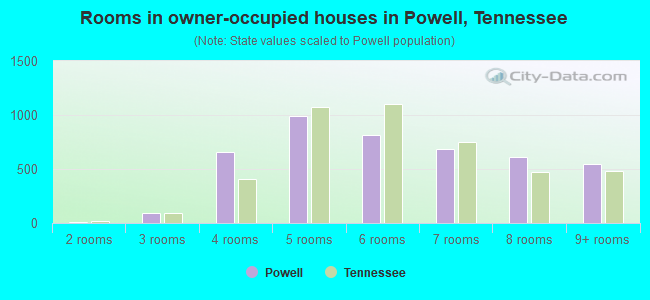
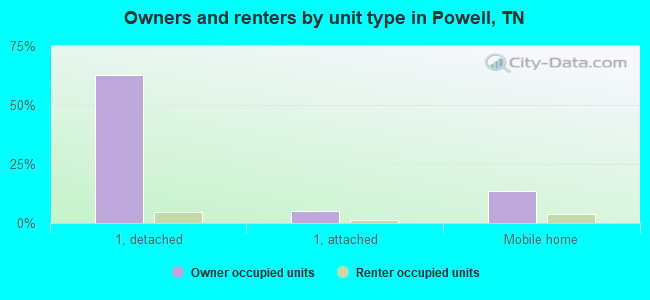
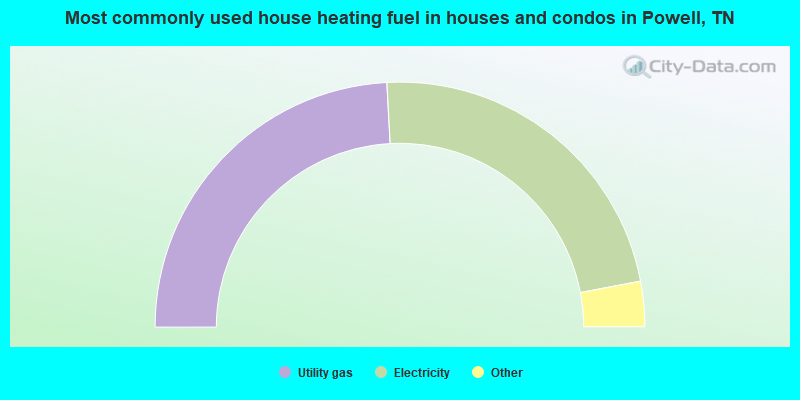
Housing units in structures:
One, detached: 3,740
One, attached: 367
Two: 82
3 or 4: 89
5 to 9: 73
10 to 19: 66
20 to 49: 29
50 or more: 141
Mobile homes: 981
Median worth of mobile homes: $63,741
Housing units lacking complete plumbing facilities: 0.9%
Housing units lacking complete kitchen facilities: 0.6%