Prescott, AZ (Arizona) Houses and Residents
Estimated median house or condo value in 2022: $581,440 (it was $148,600 in 2000 )
Prescott:
$581,440Arizona:
$402,800
Lower value quartile - upper value quartile: $413,379 - $861,408Mean price in 2022: Detached houses: $593,526 Here:
$593,526State:
$521,408
Townhouses or other attached units: $413,476 Here:
$413,476State:
$387,465
In 3-to-4-unit structures: $216,451 Here:
$216,451State:
$342,505
In 5-or-more-unit structures: $296,538 Here:
$296,538State:
$371,286
Mobile homes: $136,357 Here:
$136,357State:
$141,516
Occupied boats, RVs, vans, etc.: $14,545 Here:
$14,545State:
$60,504
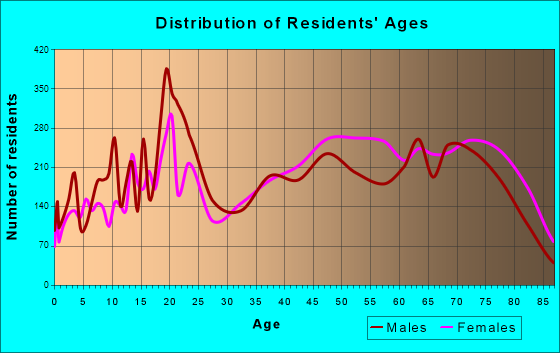
Total population: 40,958 (Urban population: 33,246, Rural population: 1,165 (all nonfarm) )
Houses: 25,936 (22,605 occupied: 15,747 owner occupied, 6,952 renter occupied )
% of renters here:
31%State:
33%
Housing density: 700 houses/condos per square mile
Median price asked for vacant for-sale houses and condos in 2022: $666,410.
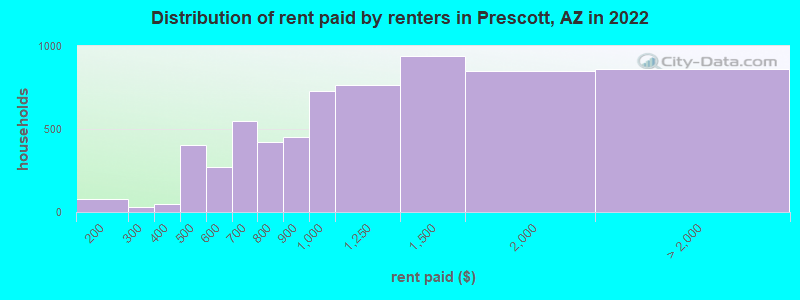
Median contract rent in 2022: $1,014 (lower quartile is $701, upper quartile is $1,469)
Median rent asked for vacant for-rent units in 2022: $1,816
Median gross rent in Prescott, AZ in 2022: $1,121
Housing units in Prescott with a mortgage: 8,011 (604 second mortgage, 14 home equity loan, 578 both second mortgage and home equity loan )Houses without a mortgage: 382
Median household income for houses/condos with a mortgage: $91,100
Median household income for apartments without a mortgage: $73,398
Median monthly housing costs: $986
Data:
Median house or condo value ($)
Median house or condo value ($ change since 2000)
Median house or condo value ($) - White
Median house or condo value ($) - Black or African American
Median house or condo value ($) - Asian
Median house or condo value ($) - Hispanic or Latino
Median house or condo value ($) - American Indian and Alaska Native
Median house or condo value ($) - Multirace
Median house or condo value ($) - Other Race
Median price asked for mobile homes ($)
Household density (households per square mile)
Mean house or condo value by units in structure - 1, detached ($)
Mean house or condo value by units in structure - 1, attached ($)
Mean house or condo value by units in structure - 2 ($)
Mean house or condo value by units in structure by units in structure - 3 or 4 ($)
Mean house or condo value by units in structure - 5 or more ($)
Mean house or condo value by units in structure - Boat, RV, van, etc. ($)
Mean house or condo value by units in structure - Mobile home ($)
Median contract rent ($)
Median contract rent - Lower quartile ($)
Median contract rent - Upper quartile ($)
Median gross rent ($)
Urban houses (%)
Rural houses (%)
Houses occupied (%)
Houses occupied (% change since 2000)
Houses owner occupied (%)
Houses owner occupied (% change since 2000)
Houses renter occupied (%)
Houses renter occupied (% change since 2000)
Vacant housing units - For rent (%)
Vacant housing units - For rent (% change since 2000)
Vacant housing units - For sale only (%)
Vacant housing units - For sale only (% change since 2000)
Vacant housing units - Rented or sold, not occupied (%)
Vacant housing units - Rented or sold, not occupied (% change since 2000)
Vacant housing units - For seasonal, recreational, or occasional use (%)
Vacant housing units - For seasonal, recreational, or occasional use (% change since 2000)
Vacant housing units - For migrant workers (%)
Vacant housing units - For migrant workers (% change since 2000)
Vacant housing units - Other vacant (%)
Vacant housing units - Other vacant (% change since 2000)
Median monthly housing costs ($)
Median household income for houses/condos with a mortgage ($)
Median household income for houses/condos without a mortgage ($)
Median household income ($)
Median household income ($) - White
Median household income ($) - Black or African American
Median household income ($) - Asian
Median household income ($) - Hispanic or Latino
Median household income ($) - American Indian and Alaska Native
Median household income ($) - Multirace
Median household income ($) - Other Race
Mortgage status - with mortgage (%)
Mortgage status - with second mortgage (%)
Mortgage status - with home equity loan (%)
Mortgage status - with both second mortgage and home equity loan (%)
Mortgage status - without a mortgage (%)
Median year house/condo built
Median year apartment built
Household type by relationship - Male householder living alone (%)
Household type by relationship - Male householder not living alone (%)
Household type by relationship - Female householder living alone (%)
Household type by relationship - Female householder not living alone (%)
Household type by relationship - Opposite-Sex spouse (%)
Household type by relationship - Same-Sex spouse (%)
Household type by relationship - Opposite-Sex unmarried partner (%)
Household type by relationship - Same-Sex unmarried partner (%)
Household type by relationship - In group quarters (%)
Size of family households - 2-person household (%)
Size of family households - 3-person household (%)
Size of family households - 4-person household (%)
Size of family households - 5-person household (%)
Size of family households - 6-person household (%)
Size of family households - 7-or-more-person household (%)
Size of nonfamily households - 1-person household (%)
Size of nonfamily households - 2-person household (%)
Size of nonfamily households - 3-person household (%)
Size of nonfamily households - 4-person household (%)
Size of nonfamily households - 5-person household (%)
Size of nonfamily households - 6-person household (%)
Size of nonfamily households - 7-or-moreperson household (%)
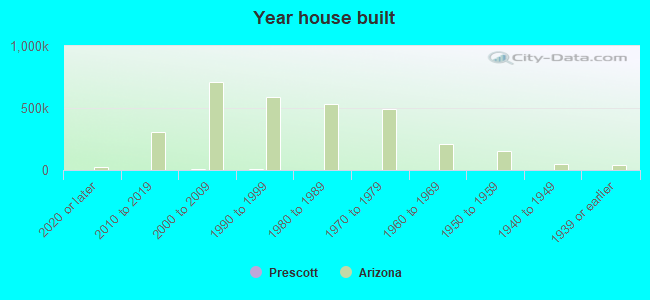
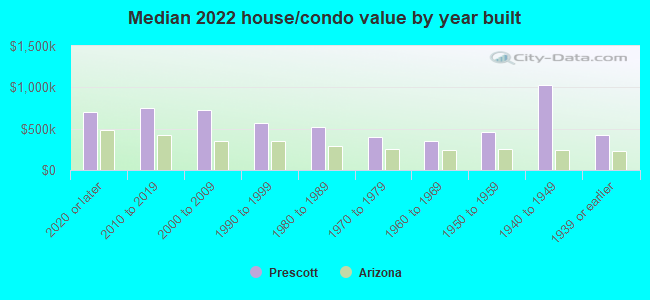
Year house built - Built 2010 or later (%)
Year house built - Built 2000 to 2009 (%)
Year house built - Built 1990 to 1999 (%)
Year house built - Built 1980 to 1989 (%)
Year house built - Built 1970 to 1979 (%)
Year house built - Built 1960 to 1969 (%)
Year house built - Built 1950 to 1959 (%)
Year house built - Built 1940 to 1949 (%)
Year house built - Built 1939 or earlier (%)
Median number of rooms in houses and condos
Median number of rooms in apartments
Median number of bedrooms in owner occupied houses
Mean number of bedrooms in owner occupied houses
Median number of bedrooms in renter occupied houses
Mean number of bedrooms in renter occupied houses
Median number of vehichles in owner occupied houses
Mean number of vehichles in owner occupied houses
Median number of vehichles in renter occupied houses
Mean number of vehichles in renter occupied houses
Rooms in owner-occupied houses - 1 room (%)
Rooms in owner-occupied houses - 2 rooms (%)
Rooms in owner-occupied houses - 3 rooms (%)
Rooms in owner-occupied houses - 4 rooms (%)
Rooms in owner-occupied houses - 5 rooms (%)
Rooms in owner-occupied houses - 6 rooms (%)
Rooms in owner-occupied houses - 7 rooms (%)
Rooms in owner-occupied houses - 8 rooms (%)
Rooms in owner-occupied houses - 9+ rooms (%)
Rooms in renter-occupied houses - 1 room (%)
Rooms in renter-occupied houses - 2 rooms (%)
Rooms in renter-occupied houses - 3 rooms (%)
Rooms in renter-occupied houses - 4 rooms (%)
Rooms in renter-occupied houses - 5 rooms (%)
Rooms in renter-occupied houses - 6 rooms (%)
Rooms in renter-occupied houses - 7 rooms (%)
Rooms in renter-occupied houses - 8 rooms (%)
Rooms in renter-occupied houses - 9+ rooms (%)
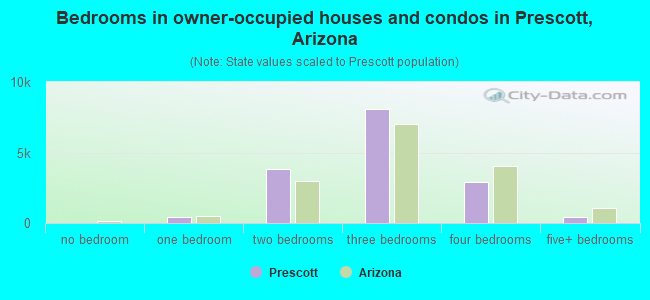
Bedrooms in owner-occupied houses - no bedrooms (%)
Bedrooms in owner-occupied houses - 1 bedroom (%)
Bedrooms in owner-occupied houses - 2 bedrooms (%)
Bedrooms in owner-occupied houses - 3 bedrooms (%)
Bedrooms in owner-occupied houses - 4 bedrooms (%)
Bedrooms in owner-occupied houses - 5+ bedrooms (%)
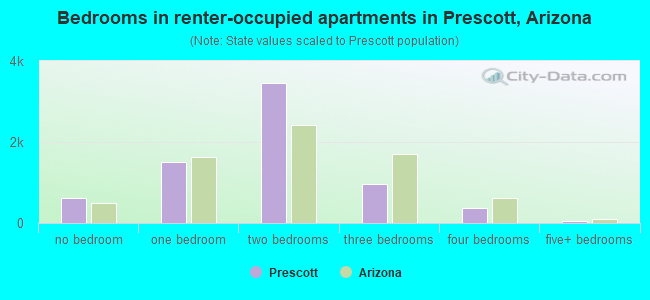
Bedrooms in renter-occupied houses - no bedrooms (%)
Bedrooms in renter-occupied houses - 1 bedroom (%)
Bedrooms in renter-occupied houses - 2 bedrooms (%)
Bedrooms in renter-occupied houses - 3 bedrooms (%)
Bedrooms in renter-occupied houses - 4 bedrooms (%)
Bedrooms in renter-occupied houses - 5+ bedrooms (%)
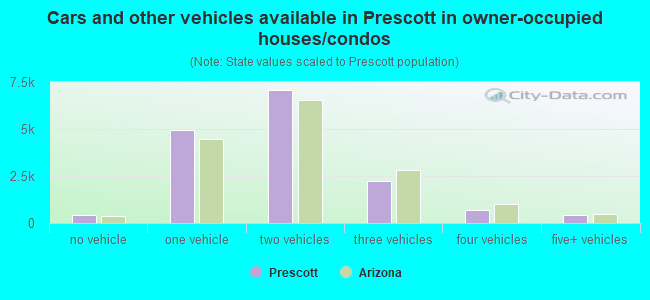
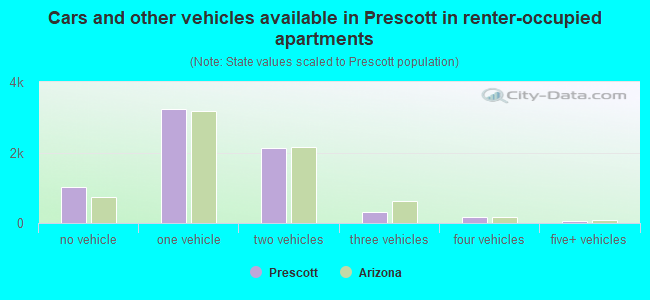
Vehicles available in owner-occupied houses - no vehicle available (%)
Vehicles available in owner-occupied houses - 1 vehicle available(%)
Vehicles available in owner-occupied houses - 2 Vehicles available (%)
Vehicles available in owner-occupied houses - 3 Vehicles available (%)
Vehicles available in owner-occupied houses - 4 Vehicles available (%)
Vehicles available in owner-occupied houses - 5+ Vehicles available (%)
Vehicles available in renter-occupied houses - no vehicle available (%)
Vehicles available in renter-occupied houses - 1 vehicle available (%)
Vehicles available in renter-occupied houses - 2 Vehicles available (%)
Vehicles available in renter-occupied houses - 3 Vehicles available (%)
Vehicles available in renter-occupied houses - 4 Vehicles available (%)
Vehicles available in renter-occupied houses - 5+ Vehicles available (%)
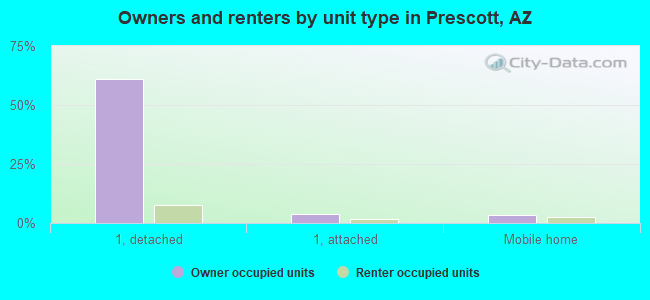
Housing units in structures - 1, detached (%)
Housing units in structures - 1, attached (%)
Housing units in structures - 2 (%)
Housing units in structures - 3 or 4 (%)
Housing units in structures - 5 to 9 (%)
Housing units in structures - 10 to 19 (%)
Housing units in structures - 20 to 49 (%)
Housing units in structures - 50 or more (%)
Housing units in structures - Mobile home (%)
Housing units in structures - Boat, RV, van, etc. (%)
Housing units in structures - Owners - 1, detached (%)
Housing units in structures - Owners - 1, attached (%)
Housing units in structures - Owners - 2 (%)
Housing units in structures - Owners - 3 or 4 (%)
Housing units in structures - Owners - 5 to 9 (%)
Housing units in structures - Owners - 10 to 19 (%)
Housing units in structures - Owners - 20 to 49 (%)
Housing units in structures - Owners - 50 or more (%)
Housing units in structures - Owners - Mobile home (%)
Housing units in structures - Owners - Boat, RV, van, etc. (%)
Housing units in structures - Renters - 1, detached (%)
Housing units in structures - Renters - 1, attached (%)
Housing units in structures - Renters - 2 (%)
Housing units in structures - Renters - 3 or 4 (%)
Housing units in structures - Renters - 5 to 9 (%)
Housing units in structures - Renters - 10 to 19 (%)
Housing units in structures - Renters - 20 to 49 (%)
Housing units in structures - Renters - 50 or more (%)
Housing units in structures - Renters - Mobile home (%)
Housing units in structures - Renters - Boat, RV, van, etc. (%)
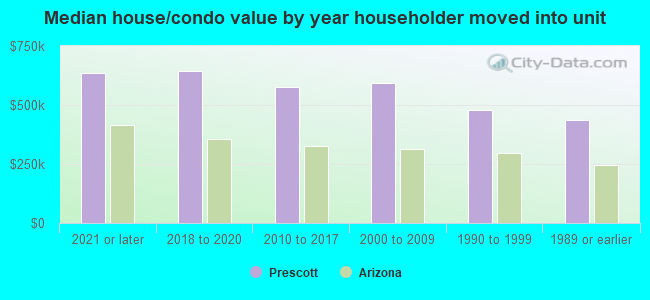
House/condo owner moved in on average (years ago)
Renter moved in on average (years ago)
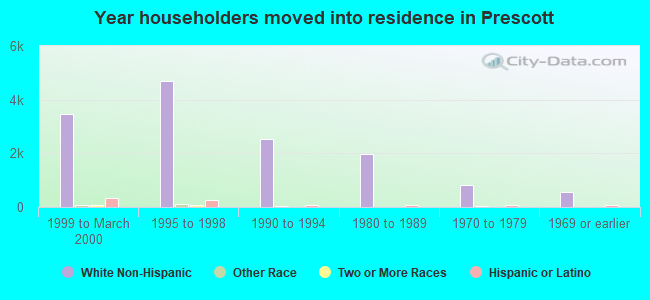
Year householder moved into unit - Moved in 1999 to March 2000 (%)
Year householder moved into unit - Moved in 1999 to March 2000 (%) - White
Year householder moved into unit - Moved in 1999 to March 2000 (%) - Black or African American
Year householder moved into unit - Moved in 1999 to March 2000 (%) - Asian
Year householder moved into unit - Moved in 1999 to March 2000 (%) - Hispanic or Latino
Year householder moved into unit - Moved in 1999 to March 2000 (%) - American Indian and Alaska Native
Year householder moved into unit - Moved in 1999 to March 2000 (%) - Multirace
Year householder moved into unit - Moved in 1999 to March 2000 (%) - Other Race
Year householder moved into unit - Moved in 1995 to 1998 (%)
Year householder moved into unit - Moved in 1995 to 1998 (%) - White
Year householder moved into unit - Moved in 1995 to 1998 (%) - Black or African American
Year householder moved into unit - Moved in 1995 to 1998 (%) - Asian
Year householder moved into unit - Moved in 1995 to 1998 (%) - Hispanic or Latino
Year householder moved into unit - Moved in 1995 to 1998 (%) - American Indian and Alaska Native
Year householder moved into unit - Moved in 1995 to 1998 (%) - Multirace
Year householder moved into unit - Moved in 1995 to 1998 (%) - Other Race
Year householder moved into unit - Moved in 1990 to 1994 (%)
Year householder moved into unit - Moved in 1990 to 1994 (%) - White
Year householder moved into unit - Moved in 1990 to 1994 (%) - Black or African American
Year householder moved into unit - Moved in 1990 to 1994 (%) - Asian
Year householder moved into unit - Moved in 1990 to 1994 (%) - Hispanic or Latino
Year householder moved into unit - Moved in 1990 to 1994 (%) - American Indian and Alaska Native
Year householder moved into unit - Moved in 1990 to 1994 (%) - Multirace
Year householder moved into unit - Moved in 1990 to 1994 (%) - Other Race
Year householder moved into unit - Moved in 1980 to 1989 (%)
Year householder moved into unit - Moved in 1980 to 1989 (%) - White
Year householder moved into unit - Moved in 1980 to 1989 (%) - Black or African American
Year householder moved into unit - Moved in 1980 to 1989 (%) - Asian
Year householder moved into unit - Moved in 1980 to 1989 (%) - Hispanic or Latino
Year householder moved into unit - Moved in 1980 to 1989 (%) - American Indian and Alaska Native
Year householder moved into unit - Moved in 1980 to 1989 (%) - Multirace
Year householder moved into unit - Moved in 1980 to 1989 (%) - Other Race
Year householder moved into unit - Moved in 1970 to 1979 (%)
Year householder moved into unit - Moved in 1970 to 1979 (%) - White
Year householder moved into unit - Moved in 1970 to 1979 (%) - Black or African American
Year householder moved into unit - Moved in 1970 to 1979 (%) - Asian
Year householder moved into unit - Moved in 1970 to 1979 (%) - Hispanic or Latino
Year householder moved into unit - Moved in 1970 to 1979 (%) - American Indian and Alaska Native
Year householder moved into unit - Moved in 1970 to 1979 (%) - Multirace
Year householder moved into unit - Moved in 1970 to 1979 (%) - Other Race
Year householder moved into unit - Moved in 1969 or earlier (%)
Year householder moved into unit - Moved in 1969 or earlier (%) - White
Year householder moved into unit - Moved in 1969 or earlier (%) - Black or African American
Year householder moved into unit - Moved in 1969 or earlier (%) - Asian
Year householder moved into unit - Moved in 1969 or earlier (%) - Hispanic or Latino
Year householder moved into unit - Moved in 1969 or earlier (%) - American Indian and Alaska Native
Year householder moved into unit - Moved in 1969 or earlier (%) - Multirace
Year householder moved into unit - Moved in 1969 or earlier (%) - Other Race
Housing units lacking complete plumbing facilities (%)
Housing units lacking complete kitchen facilities (%)
House heating fuel used in houses and condos - Utility gas (%)
House heating fuel used in houses and condos - Bottled, tank, or LP gas (%)
House heating fuel used in houses and condos - Electricity (%)
House heating fuel used in houses and condos - Fuel oil, kerosene, etc. (%)
House heating fuel used in houses and condos - Coal or coke (%)
House heating fuel used in houses and condos - Wood (%)
House heating fuel used in houses and condos - Solar energy (%)
House heating fuel used in houses and condos - Other fuel (%)
House heating fuel used in houses and condos - No fuel used (%)
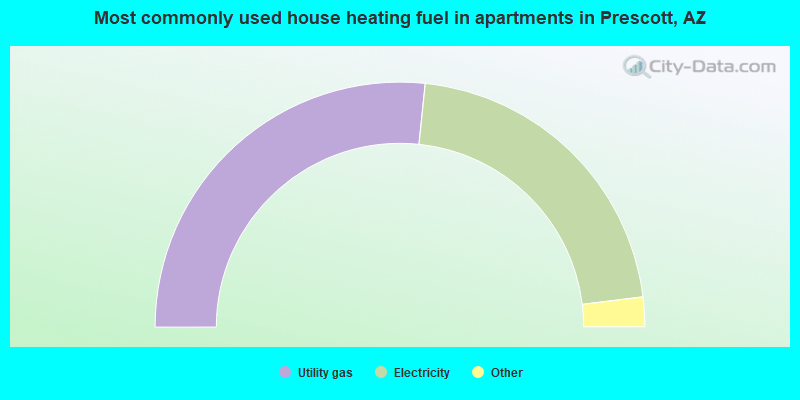
House heating fuel used in apartments - Utility gas (%)
House heating fuel used in apartments - Bottled, tank, or LP gas (%)
House heating fuel used in apartments - Electricity (%)
House heating fuel used in apartments - Fuel oil, kerosene, etc. (%)
House heating fuel used in apartments - Coal or coke (%)
House heating fuel used in apartments - Wood (%)
House heating fuel used in apartments - Solar energy (%)
House heating fuel used in apartments - Other fuel (%)
House heating fuel used in apartments - No fuel used (%)
Latest news about housing in Prescott, AZ collected exclusively by city-data.com from local newspapers, TV, and radio stations
Median year house/condo built: 1996Median year apartment built: 1985Household type by relationship:
Households: 47,673
Male householders: 11,584 (3,222 living alone ), Female householders: 10,985 (4,530 living alone )10,989 spouses (10,779 opposite-sex spouses ), 1,343 unmarried partners , (1,314 opposite-sex unmarried partners ), 7,313 children (6,557 natural , 367 adopted , 388 stepchildren ), 424 grandchildren , 173 brothers or sisters , 425 parents , 90 foster children , 285 other relatives , 1,587 non-relatives In group quarters: 2,469
Size of family households: 10,013 2-persons , 1,748 3-persons , 956 4-persons , 502 5-persons , 228 6-persons , 86 7-or-more-persons .
Size of nonfamily households: 7,544 1-person , 1,481 2-persons , 177 3-persons , 38 4-persons .
3,023 married couples with children. single-parent households (424 men , 1,555 women ).
94.0% of residents of Prescott speak English at home. of residents speak Spanish at home (80% speak English very well , 10% speak English well , 10% speak English not well ).of residents speak other Indo-European language at home (76% speak English very well , 19% speak English well , 5% speak English not well ).of residents speak Asian or Pacific Island language at home (58% speak English very well , 41% speak English well , 1% speak English not well ).of residents speak other language at home (84% speak English very well , 16% speak English not well ).
Foreign born population: 2,563 (5.4%)of them are naturalized citizens )
Median number of rooms in houses and condos:
Median number of rooms in apartments
Owner-occupied Renter-occupied
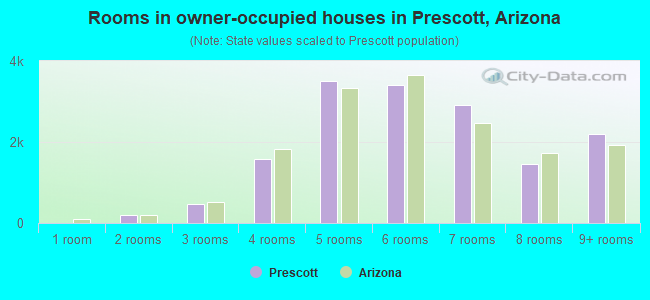
Rooms in owner-occupied houses in Prescott, Arizona
0 1 room 206 2 rooms 479 3 rooms 1,573 4 rooms 3,499 5 rooms 3,406 6 rooms 2,920 7 rooms 1,460 8 rooms 2,204 9+ rooms
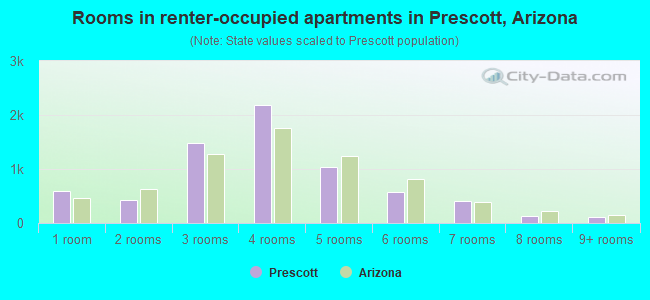
Rooms in renter-occupied apartments in Prescott, Arizona
593 1 room 421 2 rooms 1,486 3 rooms 2,178 4 rooms 1,041 5 rooms 576 6 rooms 414 7 rooms 131 8 rooms 112 9+ rooms
Prescott, AZ household income distribution 1,137 Less than $10,0001,649 $10,000 to $19,9991,640 $20,000 to $29,9991,918 $30,000 to $39,9991,589 $40,000 to $49,9992,046 $50,000 to $59,9992,572 $60,000 to $74,9992,772 $75,000 to $99,9991,895 $100,000 to $124,9991,992 $125,000 to $149,9991,422 $150,000 to $199,9992,108 $200,000 or more
Home value of owner - occupied houses in 2022 in Prescott, AZ 410 Less than $10,00088 $10,000 to $14,99926 $15,000 to $19,99919 $20,000 to $24,99917 $25,000 to $29,99926 $30,000 to $34,99949 $35,000 to $39,99951 $40,000 to $49,99933 $50,000 to $59,99915 $60,000 to $69,99973 $70,000 to $79,9998 $80,000 to $89,99926 $90,000 to $99,99996 $100,000 to $124,99933 $125,000 to $149,999153 $150,000 to $174,99997 $175,000 to $199,999670 $200,000 to $249,999588 $250,000 to $299,9992,353 $300,000 to $399,9993,214 $400,000 to $499,9996,664 $500,000 to $749,9993,070 $750,000 to $999,9991,118 $1,000,000 to $1,499,999161 $1,500,000 to $1,999,99911 $2,000,000 or moreRent paid by renters in 2022 in Prescott, AZ 80 $150 to $19930 $200 to $24938 $300 to $3499 $350 to $399174 $400 to $449230 $450 to $499181 $500 to $54991 $550 to $599399 $600 to $649147 $650 to $69979 $700 to $749339 $750 to $799450 $800 to $899728 $900 to $999765 $1,000 to $1,249941 $1,250 to $1,499850 $1,500 to $1,999193 $2,000 to $2,49988 $2,500 to $2,99929 $3,000 to $3,499349 $3,500 or more202 No cash rent
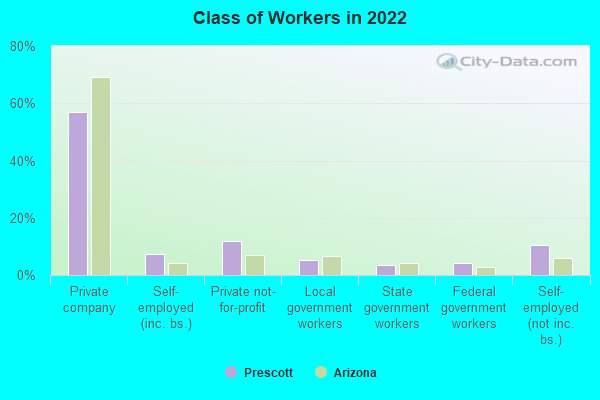
Percentage of workers working in this county: 98.0%Number of people working at home: 2,227 (13.8% of all workers )
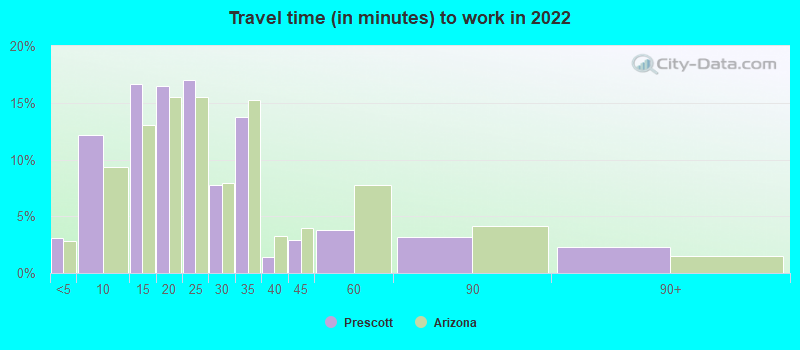
Travel time to work (commute)
Less than 5 minutes: 8675 to 9 minutes: 3,19710 to 14 minutes: 3,07715 to 19 minutes: 2,68320 to 24 minutes: 1,74925 to 29 minutes: 65230 to 34 minutes: 83735 to 39 minutes: 4440 to 44 minutes: 9245 to 59 minutes: 19060 to 89 minutes: 12190 or more minutes: 209
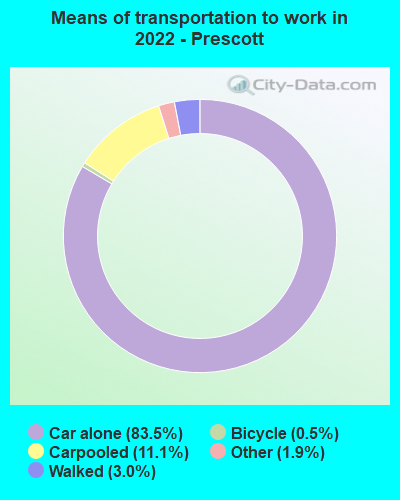
Means of transportation to work:
Drove a car alone: 25,112 (77.4%)Carpooled: 2,900 (8.9%)Bus : 7 (0.0%)Ferryboat: 6 (0.0%)Taxi: 540 (1.7%)Bicycle: 185 (0.6%)Walked: 790 (2.4%)Worked at home: 2,227 (6.9%)
Unemployment by race in 2022
Unemployment rate for White non-Hispanic residents 2.6% Males5.9% FemalesUnemployment rate for Hispanic or Latino residents 5.2% Males
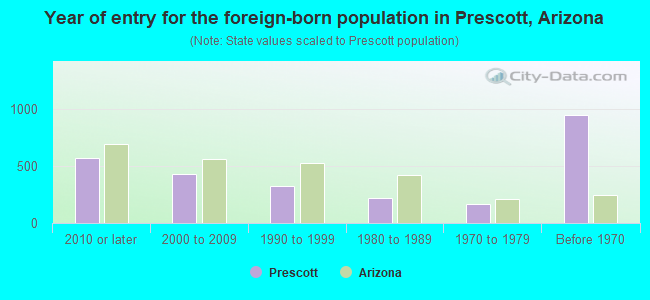
Year of entry for the foreign-born population in Prescott, Arizona
574 2010 or later 433 2000 to 2009 322 1990 to 1999 224 1980 to 1989 168 1970 to 1979 950 Before 1970
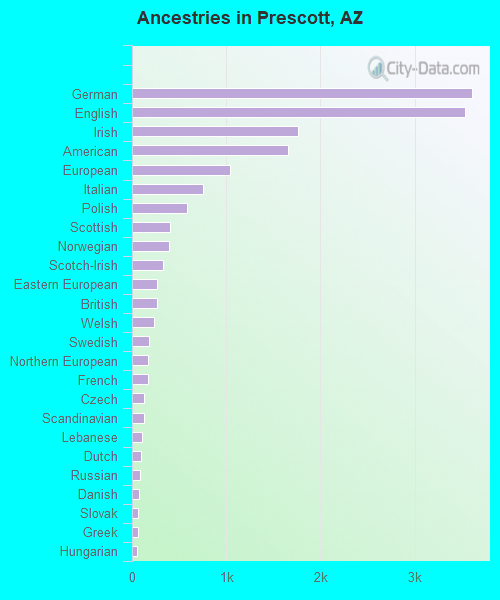
First ancestries reported:
German: 3,608 (17.2%)
English: 3,533 (16.9%)
Irish: 1,760 (8.4%)
American: 1,654 (7.9%)
European: 1,045 (5.0%)
Italian: 754 (3.6%)
Polish: 580 (2.8%)
Scottish: 398 (1.9%)
Norwegian: 395 (1.9%)
Scotch-Irish: 330 (1.6%)
Eastern European: 269 (1.3%)
British: 261 (1.2%)
Welsh: 236 (1.1%)
Swedish: 185 (0.9%)
Northern European: 174 (0.8%)
French: 172 (0.8%)
Czech: 131 (0.6%)
Scandinavian: 123 (0.6%)
Lebanese: 102 (0.5%)
Dutch: 99 (0.5%)
Russian: 81 (0.4%)
Danish: 72 (0.3%)
Slovak: 65 (0.3%)
Greek: 64 (0.3%)
Hungarian: 57 (0.3%)
Swiss: 55 (0.3%)
Lithuanian: 51 (0.2%)
Portuguese: 50 (0.2%)
Ukrainian: 44 (0.2%)
French Canadian: 42 (0.2%)
Serbian: 38 (0.2%)
Armenian: 37 (0.2%)
Canadian: 31 (0.1%)
Celtic: 28 (0.1%)
Romanian: 25 (0.1%)
Finnish: 23 (0.1%)
Brazilian: 23 (0.1%)
Czechoslovakian: 20 (0.10%)
Yugoslavian: 20 (0.10%)
Croatian: 17 (0.08%)
Cajun: 14 (0.07%)
Pennsylvania German: 13 (0.06%)
Austrian: 9 (0.04%)
Jamaican: 8 (0.04%)
Latvian: 7 (0.03%)
Belgian: 7 (0.03%)
Estonian: 6 (0.03%)
Most common places of birth for foreign-born residents (%): Mexico Prescott:
16.5% (423)Arizona:
53.4% (500,086)
Canada Prescott:
13.6% (350)Arizona:
4.3% (40,102)
Philippines Prescott:
7.4% (190)Arizona:
3.2% (30,378)
China, excluding Hong Kong and Taiwan Prescott:
5.1% (130)Arizona:
2.3% (21,275)
Germany Prescott:
4.8% (123)Arizona:
1.5% (14,058)
Korea Prescott:
4.2% (109)Arizona:
1.2% (11,275)
Japan Prescott:
3.8% (98)Arizona:
0.6% (6,077)
Russia Prescott:
3.7% (95)Arizona:
0.4% (3,763)
England Prescott:
2.5% (65)Arizona:
1.1% (9,889)
Vietnam Prescott:
2.4% (62)Arizona:
2.1% (19,199)
Ireland Prescott:
2.1% (55)Arizona:
0.1% (1,308)
United Kingdom, excluding England and Scotland Prescott:
2.1% (54)Arizona:
0.7% (6,565)
Argentina Prescott:
2.1% (54)Arizona:
0.2% (2,126)
India Prescott:
1.9% (49)Arizona:
4.5% (41,719)
Place of birth for U.S.-born residents:
This state: 11,998Other state: 32,690Northeast: 4,385Midwest: 10,106South: 4,684West: 13,137 80.6% of Prescott residents lived in the same house 1 years ago.
Out of people who lived in different houses, 24.8% lived in this county.
Out of people who lived in different counties, 31.2% lived in Arizona.
Prescott:
80.6%State average:
86.0%
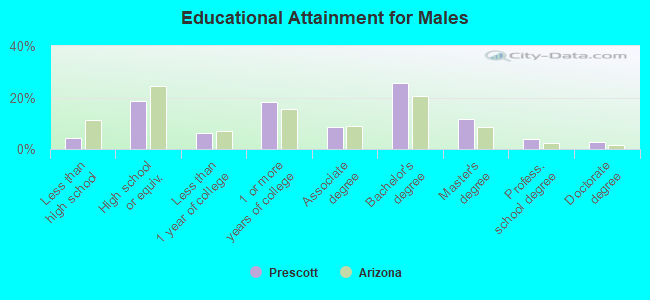
Education attainment for males 25 years and older:
No schooling: 116Nursery to 4th grade: 05th and 6th grade: 387th and 8th grade: 1509th grade: 9610th grade: 10011th grade: 19212th grade, no diploma: 144High school graduate (or equivalency): 3,528Less than 1 year of college: 1,139Some college more than 1 year, no degree: 3,446Associate degree: 1,577Bachelor's degree: 4,789Master's degree: 2,187Professional school degree: 725Doctorate degree: 520
Education attainment for females 25 years and older:
No schooling: 40Nursery to 4th grade: 135th and 6th grade: 457th and 8th grade: 519th grade: 12610th grade: 12311th grade: 6412th grade, no diploma: 193High school graduate (or equivalency): 3,848Less than 1 year of college: 1,828Some college more than 1 year, no degree: 3,602Associate degree: 2,822Bachelor's degree: 4,363Master's degree: 2,320Professional school degree: 327Doctorate degree: 337
Housing units in structures:
One, detached: 17,550One, attached: 1,474Two: 5393 or 4: 1,4435 to 9: 84410 to 19: 54320 to 49: 50850 or more: 1,228Mobile homes: 1,523Boats, RVs, vans, etc.: 280Median worth of mobile homes: $97,600
Housing units lacking complete plumbing facilities in 2022: 0.2%Housing units lacking complete kitchen facilities in 2022: 1.2%House/condo owner moved in on average 8 years ago
Renter moved in on average 1 years ago
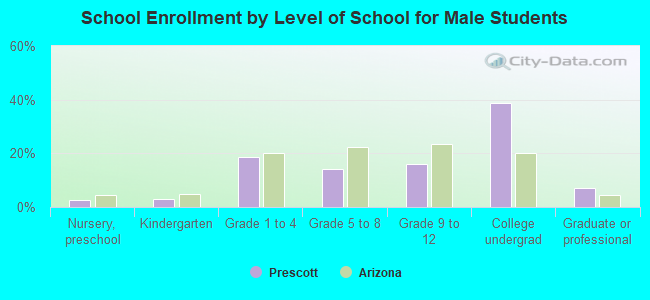
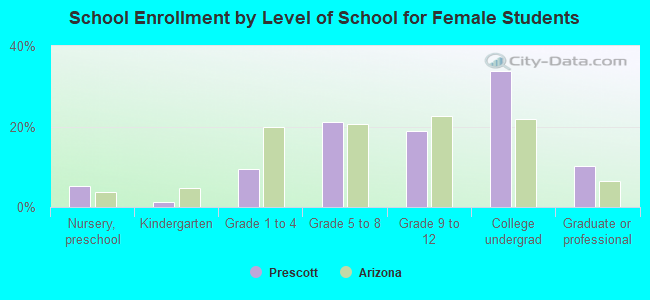
Private vs. public school enrollment:
Students in private schools in grades 1 to 8 (elementary and middle school): 305 Students in private schools in grades 9 to 12 (high school): 269 Students in private undergraduate colleges: 827