Princeton, FL (Florida) Houses and Residents
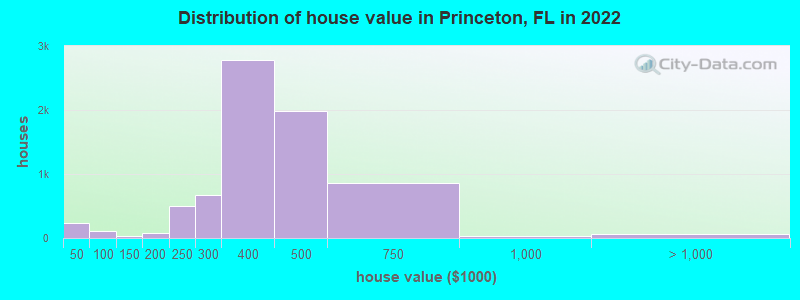
Estimated median house or condo value in 2022: $414,061 (it was $91,600 in 2000 )
Princeton:
$414,061Florida:
$354,100
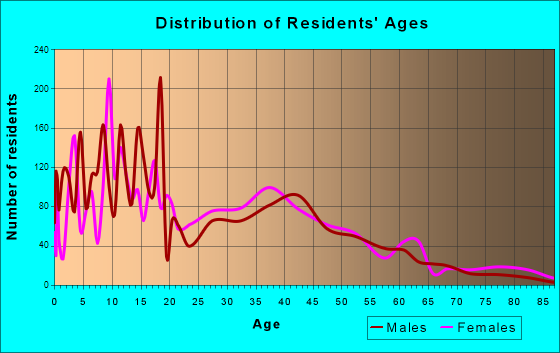
Lower value quartile - upper value quartile: $340,207 - $517,981Total population: 22,038 (Urban population: 9,733, Rural population: 405 (54 farm, 351 nonfarm ))
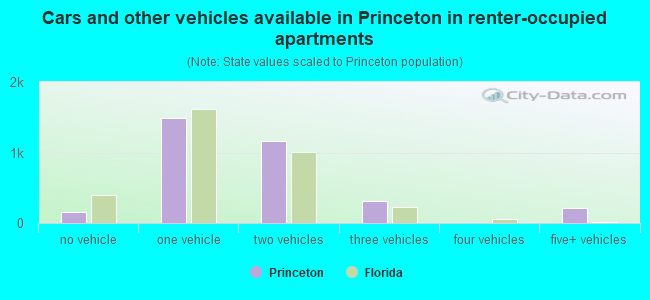
Houses: 11,739 (11,358 occupied: 8,176 owner occupied, 3,333 renter occupied )
% of renters here:
29%State:
33%
Housing density: 1,598 houses/condos per square mile
Median price asked for vacant for-sale houses and condos in 2022: $486,711.
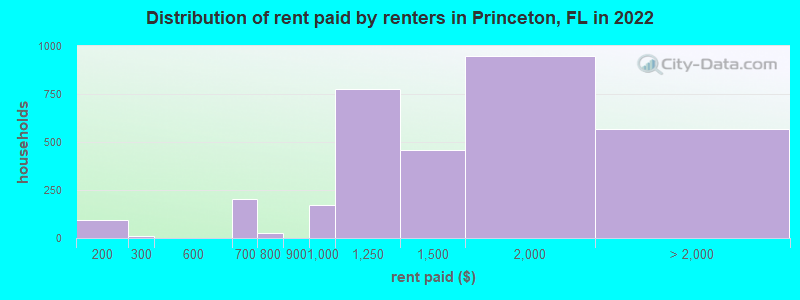
Median contract rent in 2022: $1,446 (lower quartile is $1,119, upper quartile is $1,891)
Median rent asked for vacant for-rent units in 2022: $2,611
Median gross rent in Princeton, FL in 2022: $1,595
Housing units in Princeton with a mortgage: 6,159 (127 second mortgage, 0 home equity loan, 96 both second mortgage and home equity loan )Houses without a mortgage: 0
Median household income for houses/condos with a mortgage: $96,778
Median household income for apartments without a mortgage: $77,419
Median monthly housing costs: $1,831
Data:
Median house or condo value ($)
Median house or condo value ($ change since 2000)
Median house or condo value ($) - White
Median house or condo value ($) - Black or African American
Median house or condo value ($) - Asian
Median house or condo value ($) - Hispanic or Latino
Median house or condo value ($) - American Indian and Alaska Native
Median house or condo value ($) - Multirace
Median house or condo value ($) - Other Race
Median price asked for mobile homes ($)
Household density (households per square mile)
Mean house or condo value by units in structure - 1, detached ($)
Mean house or condo value by units in structure - 1, attached ($)
Mean house or condo value by units in structure - 2 ($)
Mean house or condo value by units in structure by units in structure - 3 or 4 ($)
Mean house or condo value by units in structure - 5 or more ($)
Mean house or condo value by units in structure - Boat, RV, van, etc. ($)
Mean house or condo value by units in structure - Mobile home ($)
Median contract rent ($)
Median contract rent - Lower quartile ($)
Median contract rent - Upper quartile ($)
Median gross rent ($)
Urban houses (%)
Rural houses (%)
Houses occupied (%)
Houses occupied (% change since 2000)
Houses owner occupied (%)
Houses owner occupied (% change since 2000)
Houses renter occupied (%)
Houses renter occupied (% change since 2000)
Vacant housing units - For rent (%)
Vacant housing units - For rent (% change since 2000)
Vacant housing units - For sale only (%)
Vacant housing units - For sale only (% change since 2000)
Vacant housing units - Rented or sold, not occupied (%)
Vacant housing units - Rented or sold, not occupied (% change since 2000)
Vacant housing units - For seasonal, recreational, or occasional use (%)
Vacant housing units - For seasonal, recreational, or occasional use (% change since 2000)
Vacant housing units - For migrant workers (%)
Vacant housing units - For migrant workers (% change since 2000)
Vacant housing units - Other vacant (%)
Vacant housing units - Other vacant (% change since 2000)
Median monthly housing costs ($)
Median household income for houses/condos with a mortgage ($)
Median household income for houses/condos without a mortgage ($)
Median household income ($)
Median household income ($) - White
Median household income ($) - Black or African American
Median household income ($) - Asian
Median household income ($) - Hispanic or Latino
Median household income ($) - American Indian and Alaska Native
Median household income ($) - Multirace
Median household income ($) - Other Race
Mortgage status - with mortgage (%)
Mortgage status - with second mortgage (%)
Mortgage status - with home equity loan (%)
Mortgage status - with both second mortgage and home equity loan (%)
Mortgage status - without a mortgage (%)
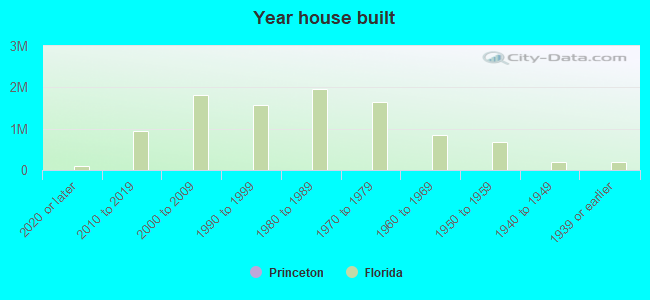
Median year house/condo built
Median year apartment built
Household type by relationship - Male householder living alone (%)
Household type by relationship - Male householder not living alone (%)
Household type by relationship - Female householder living alone (%)
Household type by relationship - Female householder not living alone (%)
Household type by relationship - Opposite-Sex spouse (%)
Household type by relationship - Same-Sex spouse (%)
Household type by relationship - Opposite-Sex unmarried partner (%)
Household type by relationship - Same-Sex unmarried partner (%)
Household type by relationship - In group quarters (%)
Size of family households - 2-person household (%)
Size of family households - 3-person household (%)
Size of family households - 4-person household (%)
Size of family households - 5-person household (%)
Size of family households - 6-person household (%)
Size of family households - 7-or-more-person household (%)
Size of nonfamily households - 1-person household (%)
Size of nonfamily households - 2-person household (%)
Size of nonfamily households - 3-person household (%)
Size of nonfamily households - 4-person household (%)
Size of nonfamily households - 5-person household (%)
Size of nonfamily households - 6-person household (%)
Size of nonfamily households - 7-or-moreperson household (%)
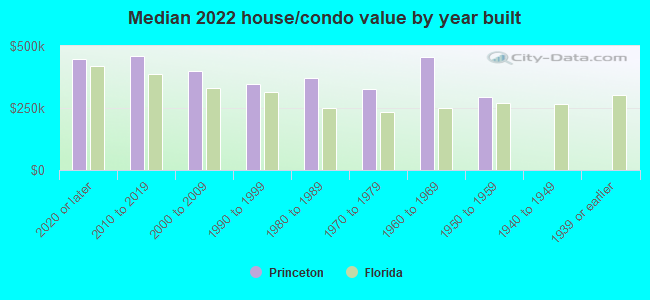
Year house built - Built 2010 or later (%)
Year house built - Built 2000 to 2009 (%)
Year house built - Built 1990 to 1999 (%)
Year house built - Built 1980 to 1989 (%)
Year house built - Built 1970 to 1979 (%)
Year house built - Built 1960 to 1969 (%)
Year house built - Built 1950 to 1959 (%)
Year house built - Built 1940 to 1949 (%)
Year house built - Built 1939 or earlier (%)
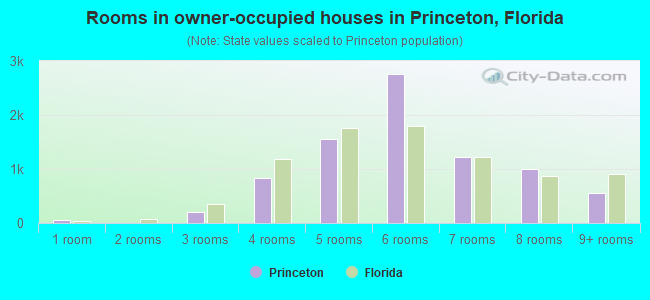
Median number of rooms in houses and condos
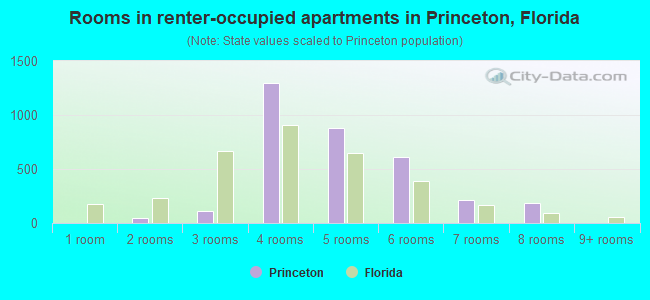
Median number of rooms in apartments
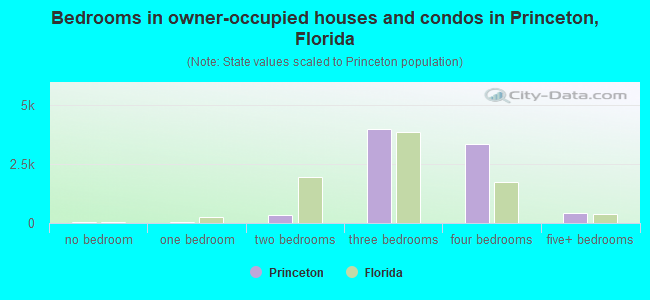
Median number of bedrooms in owner occupied houses
Mean number of bedrooms in owner occupied houses
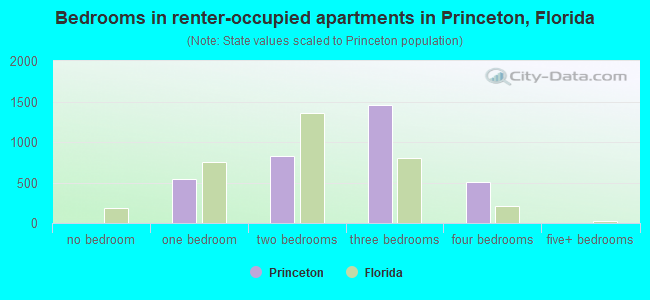
Median number of bedrooms in renter occupied houses
Mean number of bedrooms in renter occupied houses
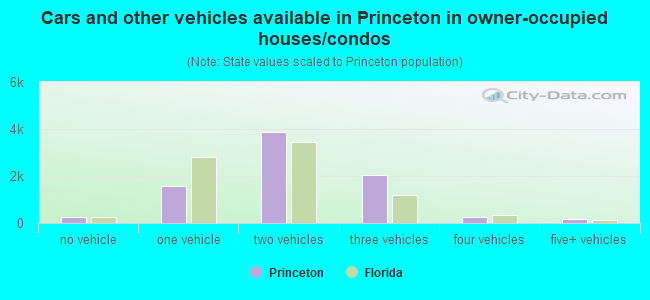
Median number of vehichles in owner occupied houses
Mean number of vehichles in owner occupied houses
Median number of vehichles in renter occupied houses
Mean number of vehichles in renter occupied houses
Rooms in owner-occupied houses - 1 room (%)
Rooms in owner-occupied houses - 2 rooms (%)
Rooms in owner-occupied houses - 3 rooms (%)
Rooms in owner-occupied houses - 4 rooms (%)
Rooms in owner-occupied houses - 5 rooms (%)
Rooms in owner-occupied houses - 6 rooms (%)
Rooms in owner-occupied houses - 7 rooms (%)
Rooms in owner-occupied houses - 8 rooms (%)
Rooms in owner-occupied houses - 9+ rooms (%)
Rooms in renter-occupied houses - 1 room (%)
Rooms in renter-occupied houses - 2 rooms (%)
Rooms in renter-occupied houses - 3 rooms (%)
Rooms in renter-occupied houses - 4 rooms (%)
Rooms in renter-occupied houses - 5 rooms (%)
Rooms in renter-occupied houses - 6 rooms (%)
Rooms in renter-occupied houses - 7 rooms (%)
Rooms in renter-occupied houses - 8 rooms (%)
Rooms in renter-occupied houses - 9+ rooms (%)
Bedrooms in owner-occupied houses - no bedrooms (%)
Bedrooms in owner-occupied houses - 1 bedroom (%)
Bedrooms in owner-occupied houses - 2 bedrooms (%)
Bedrooms in owner-occupied houses - 3 bedrooms (%)
Bedrooms in owner-occupied houses - 4 bedrooms (%)
Bedrooms in owner-occupied houses - 5+ bedrooms (%)
Bedrooms in renter-occupied houses - no bedrooms (%)
Bedrooms in renter-occupied houses - 1 bedroom (%)
Bedrooms in renter-occupied houses - 2 bedrooms (%)
Bedrooms in renter-occupied houses - 3 bedrooms (%)
Bedrooms in renter-occupied houses - 4 bedrooms (%)
Bedrooms in renter-occupied houses - 5+ bedrooms (%)
Vehicles available in owner-occupied houses - no vehicle available (%)
Vehicles available in owner-occupied houses - 1 vehicle available(%)
Vehicles available in owner-occupied houses - 2 Vehicles available (%)
Vehicles available in owner-occupied houses - 3 Vehicles available (%)
Vehicles available in owner-occupied houses - 4 Vehicles available (%)
Vehicles available in owner-occupied houses - 5+ Vehicles available (%)
Vehicles available in renter-occupied houses - no vehicle available (%)
Vehicles available in renter-occupied houses - 1 vehicle available (%)
Vehicles available in renter-occupied houses - 2 Vehicles available (%)
Vehicles available in renter-occupied houses - 3 Vehicles available (%)
Vehicles available in renter-occupied houses - 4 Vehicles available (%)
Vehicles available in renter-occupied houses - 5+ Vehicles available (%)
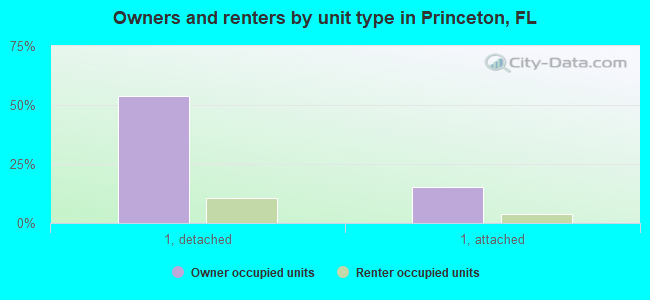
Housing units in structures - 1, detached (%)
Housing units in structures - 1, attached (%)
Housing units in structures - 2 (%)
Housing units in structures - 3 or 4 (%)
Housing units in structures - 5 to 9 (%)
Housing units in structures - 10 to 19 (%)
Housing units in structures - 20 to 49 (%)
Housing units in structures - 50 or more (%)
Housing units in structures - Mobile home (%)
Housing units in structures - Boat, RV, van, etc. (%)
Housing units in structures - Owners - 1, detached (%)
Housing units in structures - Owners - 1, attached (%)
Housing units in structures - Owners - 2 (%)
Housing units in structures - Owners - 3 or 4 (%)
Housing units in structures - Owners - 5 to 9 (%)
Housing units in structures - Owners - 10 to 19 (%)
Housing units in structures - Owners - 20 to 49 (%)
Housing units in structures - Owners - 50 or more (%)
Housing units in structures - Owners - Mobile home (%)
Housing units in structures - Owners - Boat, RV, van, etc. (%)
Housing units in structures - Renters - 1, detached (%)
Housing units in structures - Renters - 1, attached (%)
Housing units in structures - Renters - 2 (%)
Housing units in structures - Renters - 3 or 4 (%)
Housing units in structures - Renters - 5 to 9 (%)
Housing units in structures - Renters - 10 to 19 (%)
Housing units in structures - Renters - 20 to 49 (%)
Housing units in structures - Renters - 50 or more (%)
Housing units in structures - Renters - Mobile home (%)
Housing units in structures - Renters - Boat, RV, van, etc. (%)
House/condo owner moved in on average (years ago)
Renter moved in on average (years ago)
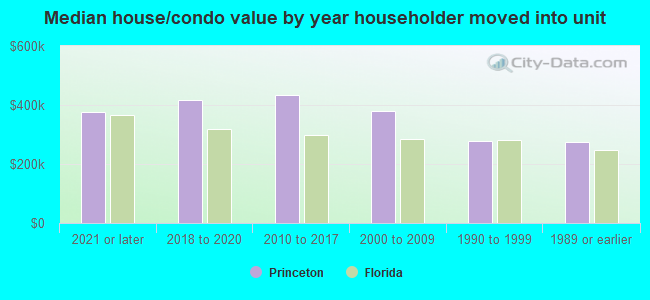
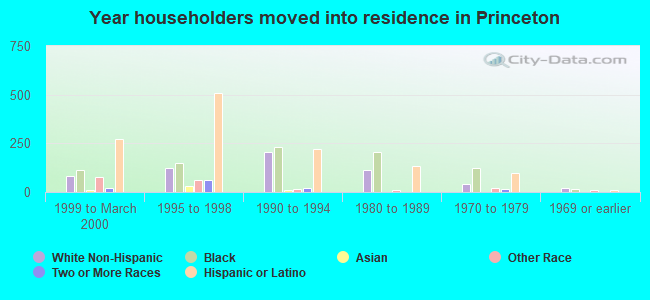
Year householder moved into unit - Moved in 1999 to March 2000 (%)
Year householder moved into unit - Moved in 1999 to March 2000 (%) - White
Year householder moved into unit - Moved in 1999 to March 2000 (%) - Black or African American
Year householder moved into unit - Moved in 1999 to March 2000 (%) - Asian
Year householder moved into unit - Moved in 1999 to March 2000 (%) - Hispanic or Latino
Year householder moved into unit - Moved in 1999 to March 2000 (%) - American Indian and Alaska Native
Year householder moved into unit - Moved in 1999 to March 2000 (%) - Multirace
Year householder moved into unit - Moved in 1999 to March 2000 (%) - Other Race
Year householder moved into unit - Moved in 1995 to 1998 (%)
Year householder moved into unit - Moved in 1995 to 1998 (%) - White
Year householder moved into unit - Moved in 1995 to 1998 (%) - Black or African American
Year householder moved into unit - Moved in 1995 to 1998 (%) - Asian
Year householder moved into unit - Moved in 1995 to 1998 (%) - Hispanic or Latino
Year householder moved into unit - Moved in 1995 to 1998 (%) - American Indian and Alaska Native
Year householder moved into unit - Moved in 1995 to 1998 (%) - Multirace
Year householder moved into unit - Moved in 1995 to 1998 (%) - Other Race
Year householder moved into unit - Moved in 1990 to 1994 (%)
Year householder moved into unit - Moved in 1990 to 1994 (%) - White
Year householder moved into unit - Moved in 1990 to 1994 (%) - Black or African American
Year householder moved into unit - Moved in 1990 to 1994 (%) - Asian
Year householder moved into unit - Moved in 1990 to 1994 (%) - Hispanic or Latino
Year householder moved into unit - Moved in 1990 to 1994 (%) - American Indian and Alaska Native
Year householder moved into unit - Moved in 1990 to 1994 (%) - Multirace
Year householder moved into unit - Moved in 1990 to 1994 (%) - Other Race
Year householder moved into unit - Moved in 1980 to 1989 (%)
Year householder moved into unit - Moved in 1980 to 1989 (%) - White
Year householder moved into unit - Moved in 1980 to 1989 (%) - Black or African American
Year householder moved into unit - Moved in 1980 to 1989 (%) - Asian
Year householder moved into unit - Moved in 1980 to 1989 (%) - Hispanic or Latino
Year householder moved into unit - Moved in 1980 to 1989 (%) - American Indian and Alaska Native
Year householder moved into unit - Moved in 1980 to 1989 (%) - Multirace
Year householder moved into unit - Moved in 1980 to 1989 (%) - Other Race
Year householder moved into unit - Moved in 1970 to 1979 (%)
Year householder moved into unit - Moved in 1970 to 1979 (%) - White
Year householder moved into unit - Moved in 1970 to 1979 (%) - Black or African American
Year householder moved into unit - Moved in 1970 to 1979 (%) - Asian
Year householder moved into unit - Moved in 1970 to 1979 (%) - Hispanic or Latino
Year householder moved into unit - Moved in 1970 to 1979 (%) - American Indian and Alaska Native
Year householder moved into unit - Moved in 1970 to 1979 (%) - Multirace
Year householder moved into unit - Moved in 1970 to 1979 (%) - Other Race
Year householder moved into unit - Moved in 1969 or earlier (%)
Year householder moved into unit - Moved in 1969 or earlier (%) - White
Year householder moved into unit - Moved in 1969 or earlier (%) - Black or African American
Year householder moved into unit - Moved in 1969 or earlier (%) - Asian
Year householder moved into unit - Moved in 1969 or earlier (%) - Hispanic or Latino
Year householder moved into unit - Moved in 1969 or earlier (%) - American Indian and Alaska Native
Year householder moved into unit - Moved in 1969 or earlier (%) - Multirace
Year householder moved into unit - Moved in 1969 or earlier (%) - Other Race
Housing units lacking complete plumbing facilities (%)
Housing units lacking complete kitchen facilities (%)
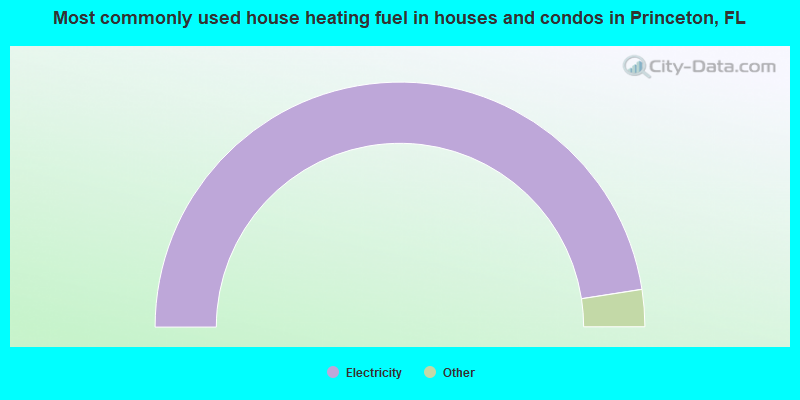
House heating fuel used in houses and condos - Utility gas (%)
House heating fuel used in houses and condos - Bottled, tank, or LP gas (%)
House heating fuel used in houses and condos - Electricity (%)
House heating fuel used in houses and condos - Fuel oil, kerosene, etc. (%)
House heating fuel used in houses and condos - Coal or coke (%)
House heating fuel used in houses and condos - Wood (%)
House heating fuel used in houses and condos - Solar energy (%)
House heating fuel used in houses and condos - Other fuel (%)
House heating fuel used in houses and condos - No fuel used (%)
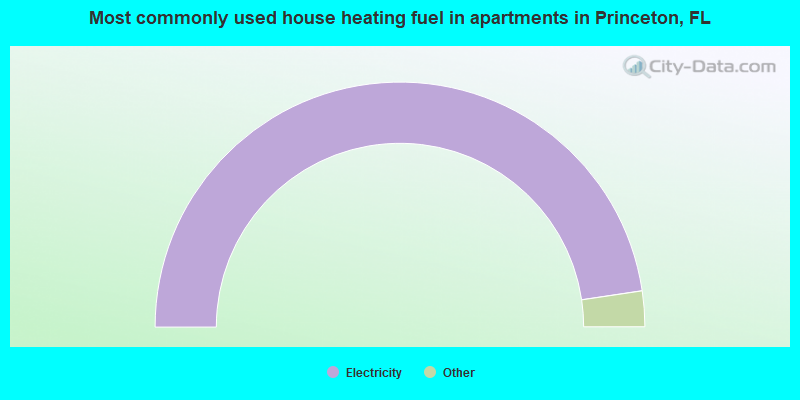
House heating fuel used in apartments - Utility gas (%)
House heating fuel used in apartments - Bottled, tank, or LP gas (%)
House heating fuel used in apartments - Electricity (%)
House heating fuel used in apartments - Fuel oil, kerosene, etc. (%)
House heating fuel used in apartments - Coal or coke (%)
House heating fuel used in apartments - Wood (%)
House heating fuel used in apartments - Solar energy (%)
House heating fuel used in apartments - Other fuel (%)
House heating fuel used in apartments - No fuel used (%)
Latest news about housing in Princeton, FL collected exclusively by city-data.com from local newspapers, TV, and radio stations
Median year house/condo built: 2007Median year apartment built: 2012Household type by relationship:
Households: 37,750
Male householders: 5,956 (450 living alone ), Female householders: 5,132 (781 living alone )5,683 spouses (5,564 opposite-sex spouses ), 1,403 unmarried partners , (1,356 opposite-sex unmarried partners ), 12,973 children (12,181 natural , 67 adopted , 724 stepchildren ), 471 grandchildren , 1,107 brothers or sisters , 1,971 parents , 298 foster children , 1,624 other relatives , 1,031 non-relatives In group quarters: 97
Size of family households: 1,940 2-persons , 2,376 3-persons , 2,862 4-persons , 1,245 5-persons , 527 6-persons , 291 7-or-more-persons .
Size of nonfamily households: 1,320 1-person , 626 2-persons , 174 3-persons , 60 4-persons , 10 5-persons .
5,659 married couples with children. single-parent households (854 men , 2,140 women ).
26.3% of residents of Princeton speak English at home. of residents speak Spanish at home (54% speak English very well , 17% speak English well , 19% speak English not well , 10% don't speak English at all ).of residents speak other Indo-European language at home (73% speak English very well , 16% speak English well , 8% speak English not well , 3% don't speak English at all ).of residents speak Asian or Pacific Island language at home (72% speak English very well , 21% speak English well , 8% don't speak English at all ).
Foreign born population: 18,461 (48.9%)of them are naturalized citizens )
Median number of rooms in houses and condos:
Median number of rooms in apartments
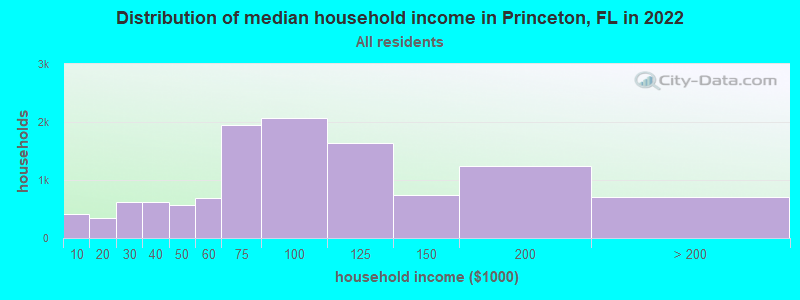
Princeton, FL household income distribution 421 Less than $10,000344 $10,000 to $19,999619 $20,000 to $29,999628 $30,000 to $39,999571 $40,000 to $49,999685 $50,000 to $59,9991,949 $60,000 to $74,9992,076 $75,000 to $99,9991,634 $100,000 to $124,999747 $125,000 to $149,9991,237 $150,000 to $199,999704 $200,000 or more
Home value of owner - occupied houses in 2022 in Princeton, FL 141 Less than $10,00027 $25,000 to $29,99928 $30,000 to $34,99943 $40,000 to $49,99963 $50,000 to $59,99914 $100,000 to $124,99924 $125,000 to $149,99982 $150,000 to $174,999503 $200,000 to $249,999673 $250,000 to $299,9992,788 $300,000 to $399,9991,982 $400,000 to $499,999854 $500,000 to $749,99927 $750,000 to $999,99947 $1,000,000 to $1,499,99916 $2,000,000 or moreRent paid by renters in 2022 in Princeton, FL 94 $150 to $19912 $250 to $29942 $600 to $649162 $650 to $69926 $750 to $799173 $900 to $999776 $1,000 to $1,249459 $1,250 to $1,499947 $1,500 to $1,999426 $2,000 to $2,49991 $2,500 to $2,99951 No cash rent
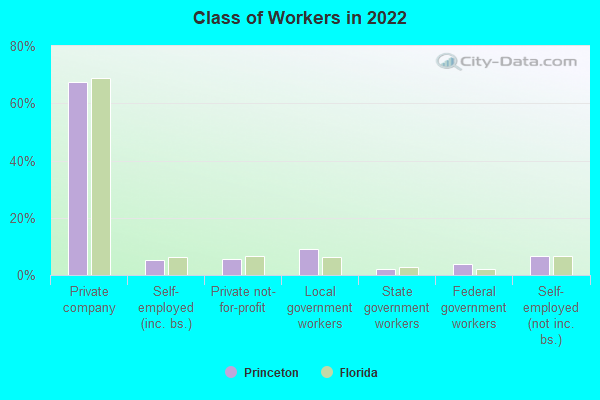
Percentage of workers working in this county: 96.6%Number of people working at home: 2,220 (11.0% of all workers )
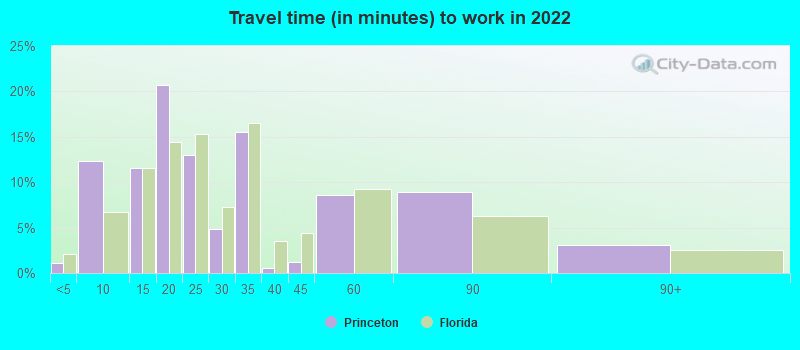
Travel time to work (commute)
Less than 5 minutes: 1775 to 9 minutes: 29810 to 14 minutes: 78515 to 19 minutes: 1,87320 to 24 minutes: 1,82125 to 29 minutes: 1,09130 to 34 minutes: 2,79335 to 39 minutes: 48640 to 44 minutes: 1,05645 to 59 minutes: 2,42560 to 89 minutes: 2,75790 or more minutes: 1,716
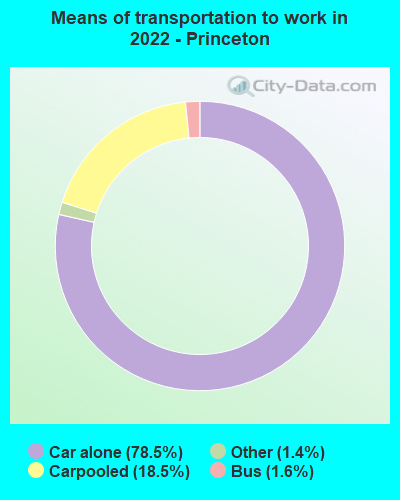
Means of transportation to work:
Drove a car alone: 1,506 (41.9%)Carpooled: 400 (11.1%)Bus : 29 (0.8%)Taxi: 33 (0.9%)Worked at home: 2,220 (61.8%)
Unemployment by race in 2022
Unemployment rate for White non-Hispanic residents 0.9% Males5.3% FemalesUnemployment rate for Black residents 2.0% Males1.4% FemalesUnemployment rate for other race residents 20.6% FemalesUnemployment rate for two or more race residents 3.5% Males5.4% FemalesUnemployment rate for Hispanic or Latino residents 3.2% Males5.6% Females
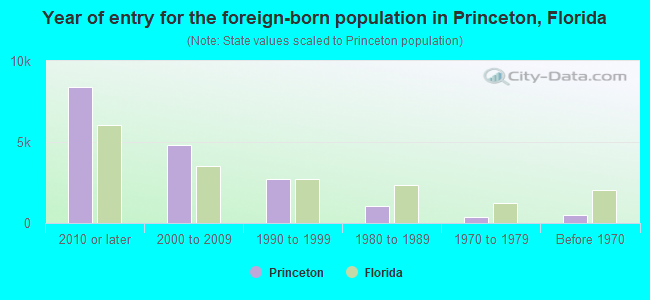
Year of entry for the foreign-born population in Princeton, Florida
8,408 2010 or later 4,844 2000 to 2009 2,695 1990 to 1999 1,051 1980 to 1989 395 1970 to 1979 509 Before 1970
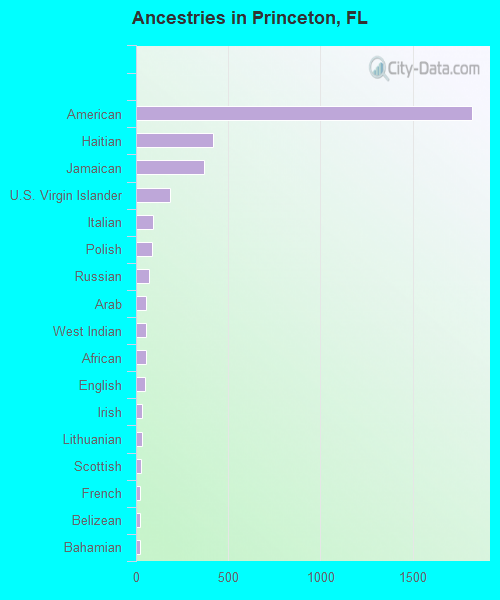
First ancestries reported:
American: 1,823 (6.9%)
Haitian: 418 (1.6%)
Jamaican: 368 (1.4%)
U.S. Virgin Islander: 183 (0.7%)
Italian: 91 (0.3%)
Polish: 88 (0.3%)
Russian: 68 (0.3%)
Arab: 56 (0.2%)
West Indian: 55 (0.2%)
African: 54 (0.2%)
English: 50 (0.2%)
Irish: 34 (0.1%)
Lithuanian: 30 (0.1%)
Scottish: 26 (0.10%)
French: 23 (0.09%)
Belizean: 23 (0.09%)
Bahamian: 19 (0.07%)
Czech: 16 (0.06%)
German: 11 (0.04%)
Welsh: 9 (0.03%)
Brazilian: 8 (0.03%)
Nigerian: 8 (0.03%)
Guyanese: 5 (0.02%)
Trinidadian and Tobagonian: 3 (0.01%) Most common places of birth for foreign-born residents (%): Cuba Princeton:
53.4% (9,858)Florida:
22.0% (1,006,576)
Nicaragua Princeton:
7.1% (1,319)Florida:
2.3% (105,066)
Colombia Princeton:
6.2% (1,140)Florida:
6.5% (298,669)
Venezuela Princeton:
4.9% (908)Florida:
5.7% (262,042)
El Salvador Princeton:
4.4% (818)Florida:
1.1% (49,838)
Dominican Republic Princeton:
4.0% (740)Florida:
3.0% (137,727)
Honduras Princeton:
2.7% (490)Florida:
2.3% (107,160)
Haiti Princeton:
2.4% (438)Florida:
7.5% (342,375)
Peru Princeton:
2.3% (416)Florida:
2.1% (96,693)
Cambodia Princeton:
1.9% (345)Florida:
0.1% (3,268)
Mexico Princeton:
1.8% (332)Florida:
5.6% (257,152)
Guatemala Princeton:
1.6% (288)Florida:
2.1% (97,632)
Place of birth for U.S.-born residents:
This state: 13,462Other state: 3,943Northeast: 2,595Midwest: 207South: 761West: 373 90.4% of Princeton residents lived in the same house 1 years ago.
Out of people who lived in different houses, 46.3% lived in this county.
Out of people who lived in different counties, 61.9% lived in Florida.
Princeton:
90.4%State average:
86.3%
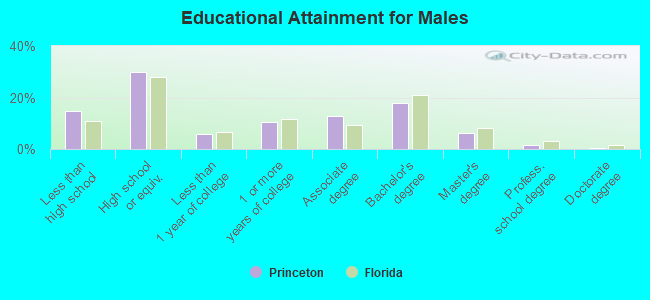
Education attainment for males 25 years and older:
No schooling: 394Nursery to 4th grade: 05th and 6th grade: 1567th and 8th grade: 2199th grade: 16410th grade: 4211th grade: 23212th grade, no diploma: 588High school graduate (or equivalency): 3,617Less than 1 year of college: 722Some college more than 1 year, no degree: 1,256Associate degree: 1,567Bachelor's degree: 2,167Master's degree: 733Professional school degree: 197Doctorate degree: 54
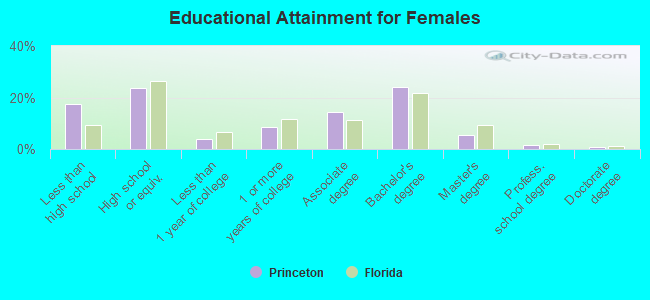
Education attainment for females 25 years and older:
No schooling: 589Nursery to 4th grade: 1395th and 6th grade: 857th and 8th grade: 569th grade: 12010th grade: 22211th grade: 25212th grade, no diploma: 803High school graduate (or equivalency): 3,054Less than 1 year of college: 498Some college more than 1 year, no degree: 1,084Associate degree: 1,870Bachelor's degree: 3,105Master's degree: 706Professional school degree: 216Doctorate degree: 82
Housing units in structures:
One, detached: 7,958One, attached: 2,025Two: 1213 or 4: 245 to 9: 16310 to 19: 67820 to 49: 29550 or more: 292Mobile homes: 180Housing units lacking complete kitchen facilities in 2022: 0.2%House/condo owner moved in on average 6 years ago
Renter moved in on average 3 years ago
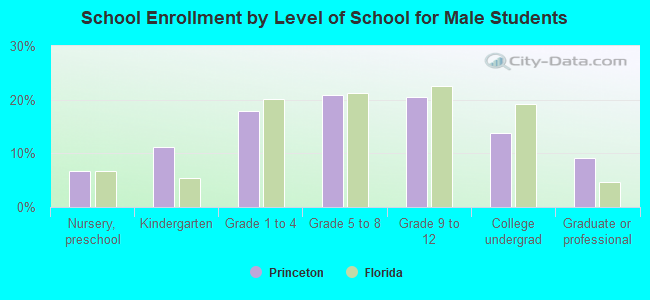
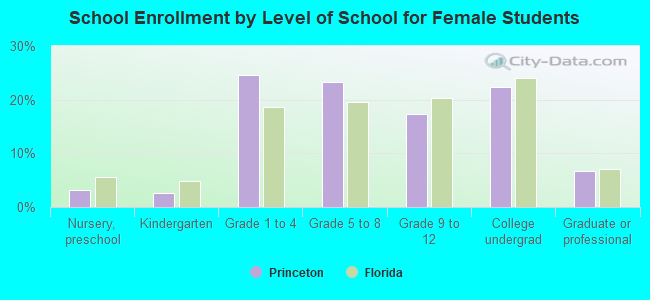
Private vs. public school enrollment:
Students in private schools in grades 1 to 8 (elementary and middle school): 670 Students in private schools in grades 9 to 12 (high school): 223 Students in private undergraduate colleges: 275