Rahway, NJ (New Jersey) Houses and Residents
Estimated median house or condo value in 2022: $374,448 (it was $144,100 in 2000 )
Rahway:
$374,448New Jersey:
$428,900
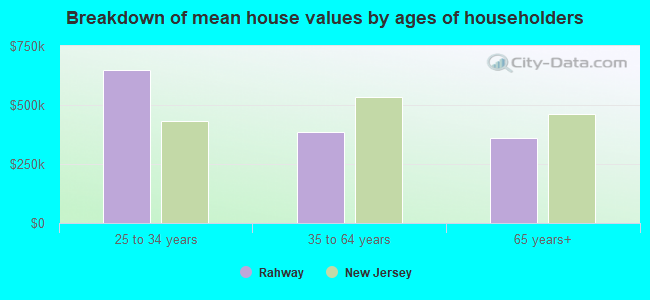
Lower value quartile - upper value quartile: $306,028 - $424,151Mean price in 2022: Detached houses: $377,364 Here:
$377,364State:
$537,591
Townhouses or other attached units: $289,320 Here:
$289,320State:
$381,113
In 2-unit structures: $297,277 Here:
$297,277State:
$444,476
In 3-to-4-unit structures: $643,930 Here:
$643,930State:
$457,463
In 5-or-more-unit structures: $282,363 Here:
$282,363State:
$368,745
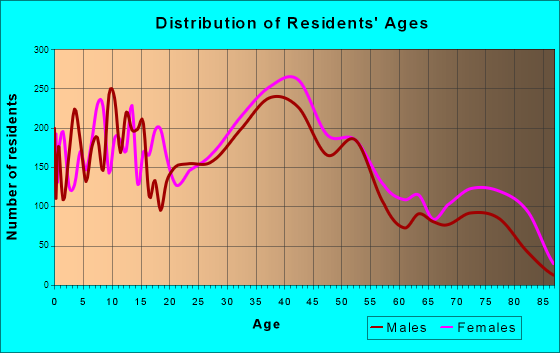
Total population: 28,528 (Urban population: 26,500, Rural population: 0)
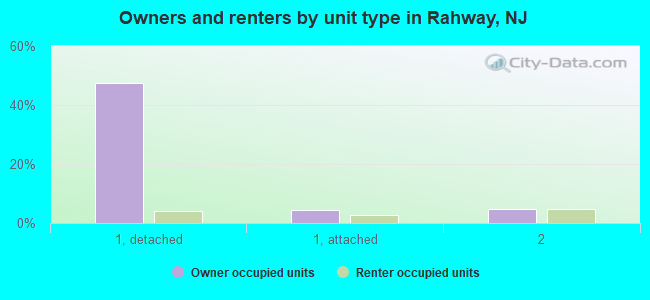
Houses: 12,894 (12,192 occupied: 6,740 owner occupied, 5,493 renter occupied )
% of renters here:
45%State:
35%
Housing density: 3,232 houses/condos per square mile
Median price asked for vacant for-sale houses and condos in 2022: $390,007.
Median contract rent in 2022: $1,470 (lower quartile is $1,095, upper quartile is $1,998)
Median rent asked for vacant for-rent units in 2022: $2,810
Median gross rent in Rahway, NJ in 2022: $1,694
Housing units in Rahway with a mortgage: 4,568 (167 second mortgage, 6 home equity loan, 123 both second mortgage and home equity loan )Houses without a mortgage: 256
Median household income for houses/condos with a mortgage: $119,338
Median household income for apartments without a mortgage: $86,560
Median monthly housing costs: $1,910
Data:
Median house or condo value ($)
Median house or condo value ($ change since 2000)
Median house or condo value ($) - White
Median house or condo value ($) - Black or African American
Median house or condo value ($) - Asian
Median house or condo value ($) - Hispanic or Latino
Median house or condo value ($) - American Indian and Alaska Native
Median house or condo value ($) - Multirace
Median house or condo value ($) - Other Race
Median price asked for mobile homes ($)
Household density (households per square mile)
Mean house or condo value by units in structure - 1, detached ($)
Mean house or condo value by units in structure - 1, attached ($)
Mean house or condo value by units in structure - 2 ($)
Mean house or condo value by units in structure by units in structure - 3 or 4 ($)
Mean house or condo value by units in structure - 5 or more ($)
Mean house or condo value by units in structure - Boat, RV, van, etc. ($)
Mean house or condo value by units in structure - Mobile home ($)
Median contract rent ($)
Median contract rent - Lower quartile ($)
Median contract rent - Upper quartile ($)
Median gross rent ($)
Urban houses (%)
Rural houses (%)
Houses occupied (%)
Houses occupied (% change since 2000)
Houses owner occupied (%)
Houses owner occupied (% change since 2000)
Houses renter occupied (%)
Houses renter occupied (% change since 2000)
Vacant housing units - For rent (%)
Vacant housing units - For rent (% change since 2000)
Vacant housing units - For sale only (%)
Vacant housing units - For sale only (% change since 2000)
Vacant housing units - Rented or sold, not occupied (%)
Vacant housing units - Rented or sold, not occupied (% change since 2000)
Vacant housing units - For seasonal, recreational, or occasional use (%)
Vacant housing units - For seasonal, recreational, or occasional use (% change since 2000)
Vacant housing units - For migrant workers (%)
Vacant housing units - For migrant workers (% change since 2000)
Vacant housing units - Other vacant (%)
Vacant housing units - Other vacant (% change since 2000)
Median monthly housing costs ($)
Median household income for houses/condos with a mortgage ($)
Median household income for houses/condos without a mortgage ($)
Median household income ($)
Median household income ($) - White
Median household income ($) - Black or African American
Median household income ($) - Asian
Median household income ($) - Hispanic or Latino
Median household income ($) - American Indian and Alaska Native
Median household income ($) - Multirace
Median household income ($) - Other Race
Mortgage status - with mortgage (%)
Mortgage status - with second mortgage (%)
Mortgage status - with home equity loan (%)
Mortgage status - with both second mortgage and home equity loan (%)
Mortgage status - without a mortgage (%)
Median year house/condo built
Median year apartment built
Household type by relationship - Male householder living alone (%)
Household type by relationship - Male householder not living alone (%)
Household type by relationship - Female householder living alone (%)
Household type by relationship - Female householder not living alone (%)
Household type by relationship - Opposite-Sex spouse (%)
Household type by relationship - Same-Sex spouse (%)
Household type by relationship - Opposite-Sex unmarried partner (%)
Household type by relationship - Same-Sex unmarried partner (%)
Household type by relationship - In group quarters (%)
Size of family households - 2-person household (%)
Size of family households - 3-person household (%)
Size of family households - 4-person household (%)
Size of family households - 5-person household (%)
Size of family households - 6-person household (%)
Size of family households - 7-or-more-person household (%)
Size of nonfamily households - 1-person household (%)
Size of nonfamily households - 2-person household (%)
Size of nonfamily households - 3-person household (%)
Size of nonfamily households - 4-person household (%)
Size of nonfamily households - 5-person household (%)
Size of nonfamily households - 6-person household (%)
Size of nonfamily households - 7-or-moreperson household (%)
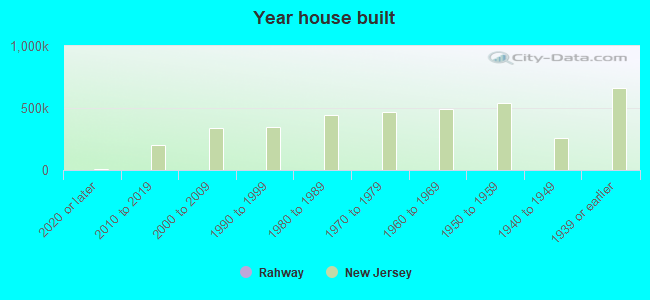
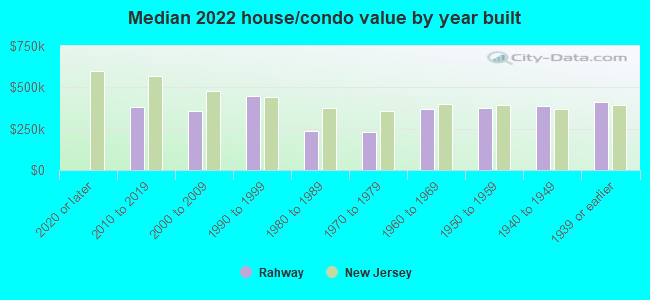
Year house built - Built 2010 or later (%)
Year house built - Built 2000 to 2009 (%)
Year house built - Built 1990 to 1999 (%)
Year house built - Built 1980 to 1989 (%)
Year house built - Built 1970 to 1979 (%)
Year house built - Built 1960 to 1969 (%)
Year house built - Built 1950 to 1959 (%)
Year house built - Built 1940 to 1949 (%)
Year house built - Built 1939 or earlier (%)
Median number of rooms in houses and condos
Median number of rooms in apartments
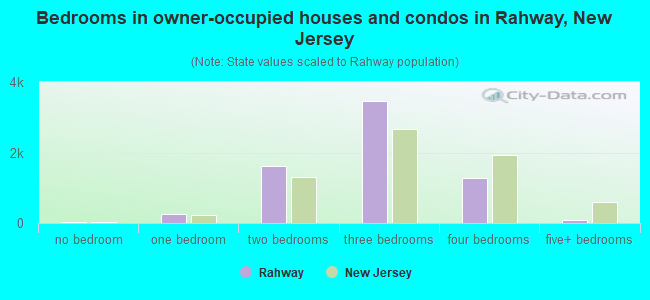
Median number of bedrooms in owner occupied houses
Mean number of bedrooms in owner occupied houses
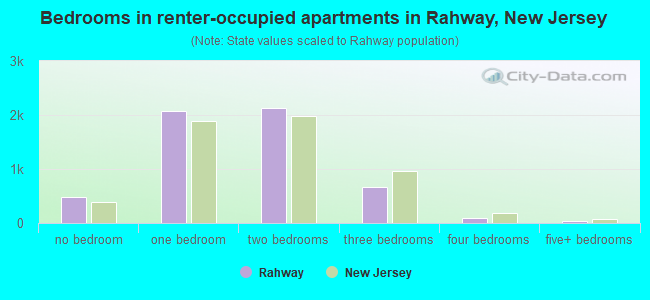
Median number of bedrooms in renter occupied houses
Mean number of bedrooms in renter occupied houses
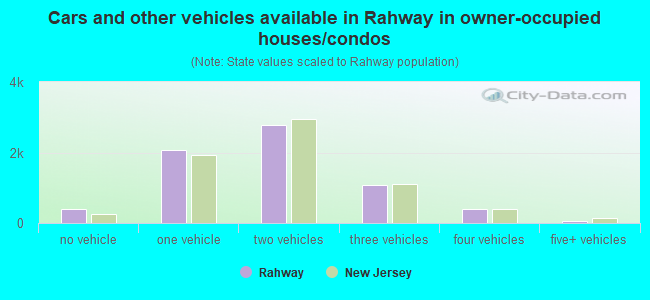
Median number of vehichles in owner occupied houses
Mean number of vehichles in owner occupied houses
Median number of vehichles in renter occupied houses
Mean number of vehichles in renter occupied houses
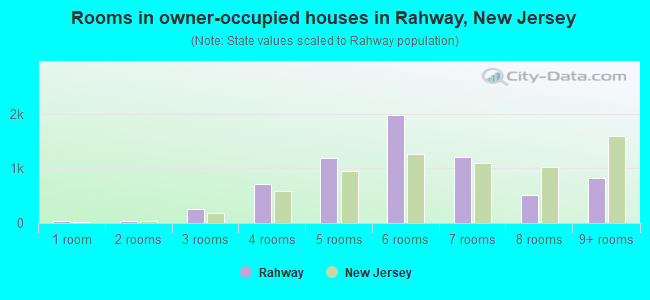
Rooms in owner-occupied houses - 1 room (%)
Rooms in owner-occupied houses - 2 rooms (%)
Rooms in owner-occupied houses - 3 rooms (%)
Rooms in owner-occupied houses - 4 rooms (%)
Rooms in owner-occupied houses - 5 rooms (%)
Rooms in owner-occupied houses - 6 rooms (%)
Rooms in owner-occupied houses - 7 rooms (%)
Rooms in owner-occupied houses - 8 rooms (%)
Rooms in owner-occupied houses - 9+ rooms (%)
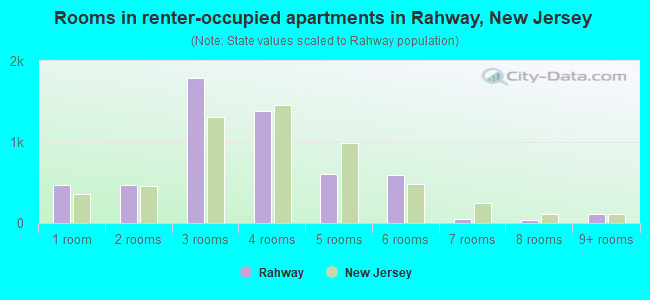
Rooms in renter-occupied houses - 1 room (%)
Rooms in renter-occupied houses - 2 rooms (%)
Rooms in renter-occupied houses - 3 rooms (%)
Rooms in renter-occupied houses - 4 rooms (%)
Rooms in renter-occupied houses - 5 rooms (%)
Rooms in renter-occupied houses - 6 rooms (%)
Rooms in renter-occupied houses - 7 rooms (%)
Rooms in renter-occupied houses - 8 rooms (%)
Rooms in renter-occupied houses - 9+ rooms (%)
Bedrooms in owner-occupied houses - no bedrooms (%)
Bedrooms in owner-occupied houses - 1 bedroom (%)
Bedrooms in owner-occupied houses - 2 bedrooms (%)
Bedrooms in owner-occupied houses - 3 bedrooms (%)
Bedrooms in owner-occupied houses - 4 bedrooms (%)
Bedrooms in owner-occupied houses - 5+ bedrooms (%)
Bedrooms in renter-occupied houses - no bedrooms (%)
Bedrooms in renter-occupied houses - 1 bedroom (%)
Bedrooms in renter-occupied houses - 2 bedrooms (%)
Bedrooms in renter-occupied houses - 3 bedrooms (%)
Bedrooms in renter-occupied houses - 4 bedrooms (%)
Bedrooms in renter-occupied houses - 5+ bedrooms (%)
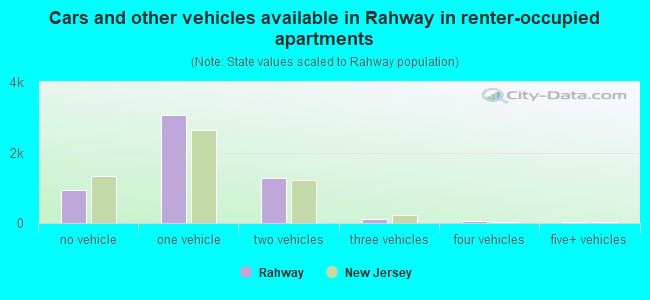
Vehicles available in owner-occupied houses - no vehicle available (%)
Vehicles available in owner-occupied houses - 1 vehicle available(%)
Vehicles available in owner-occupied houses - 2 Vehicles available (%)
Vehicles available in owner-occupied houses - 3 Vehicles available (%)
Vehicles available in owner-occupied houses - 4 Vehicles available (%)
Vehicles available in owner-occupied houses - 5+ Vehicles available (%)
Vehicles available in renter-occupied houses - no vehicle available (%)
Vehicles available in renter-occupied houses - 1 vehicle available (%)
Vehicles available in renter-occupied houses - 2 Vehicles available (%)
Vehicles available in renter-occupied houses - 3 Vehicles available (%)
Vehicles available in renter-occupied houses - 4 Vehicles available (%)
Vehicles available in renter-occupied houses - 5+ Vehicles available (%)
Housing units in structures - 1, detached (%)
Housing units in structures - 1, attached (%)
Housing units in structures - 2 (%)
Housing units in structures - 3 or 4 (%)
Housing units in structures - 5 to 9 (%)
Housing units in structures - 10 to 19 (%)
Housing units in structures - 20 to 49 (%)
Housing units in structures - 50 or more (%)
Housing units in structures - Mobile home (%)
Housing units in structures - Boat, RV, van, etc. (%)
Housing units in structures - Owners - 1, detached (%)
Housing units in structures - Owners - 1, attached (%)
Housing units in structures - Owners - 2 (%)
Housing units in structures - Owners - 3 or 4 (%)
Housing units in structures - Owners - 5 to 9 (%)
Housing units in structures - Owners - 10 to 19 (%)
Housing units in structures - Owners - 20 to 49 (%)
Housing units in structures - Owners - 50 or more (%)
Housing units in structures - Owners - Mobile home (%)
Housing units in structures - Owners - Boat, RV, van, etc. (%)
Housing units in structures - Renters - 1, detached (%)
Housing units in structures - Renters - 1, attached (%)
Housing units in structures - Renters - 2 (%)
Housing units in structures - Renters - 3 or 4 (%)
Housing units in structures - Renters - 5 to 9 (%)
Housing units in structures - Renters - 10 to 19 (%)
Housing units in structures - Renters - 20 to 49 (%)
Housing units in structures - Renters - 50 or more (%)
Housing units in structures - Renters - Mobile home (%)
Housing units in structures - Renters - Boat, RV, van, etc. (%)
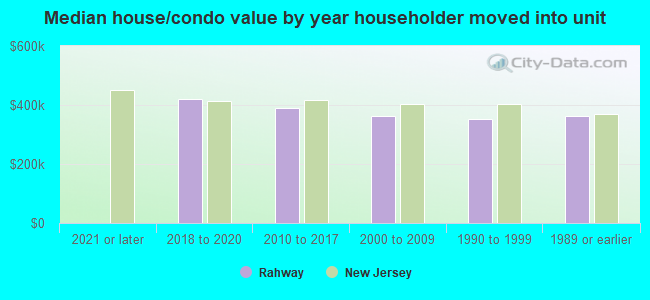
House/condo owner moved in on average (years ago)
Renter moved in on average (years ago)
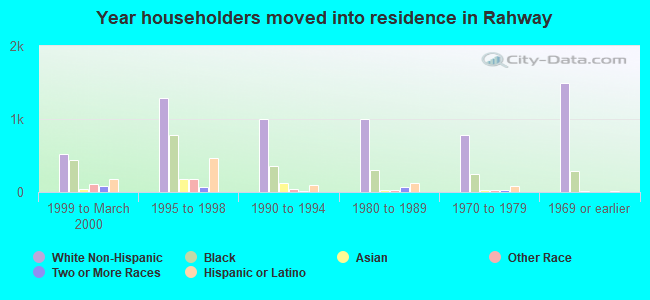
Year householder moved into unit - Moved in 1999 to March 2000 (%)
Year householder moved into unit - Moved in 1999 to March 2000 (%) - White
Year householder moved into unit - Moved in 1999 to March 2000 (%) - Black or African American
Year householder moved into unit - Moved in 1999 to March 2000 (%) - Asian
Year householder moved into unit - Moved in 1999 to March 2000 (%) - Hispanic or Latino
Year householder moved into unit - Moved in 1999 to March 2000 (%) - American Indian and Alaska Native
Year householder moved into unit - Moved in 1999 to March 2000 (%) - Multirace
Year householder moved into unit - Moved in 1999 to March 2000 (%) - Other Race
Year householder moved into unit - Moved in 1995 to 1998 (%)
Year householder moved into unit - Moved in 1995 to 1998 (%) - White
Year householder moved into unit - Moved in 1995 to 1998 (%) - Black or African American
Year householder moved into unit - Moved in 1995 to 1998 (%) - Asian
Year householder moved into unit - Moved in 1995 to 1998 (%) - Hispanic or Latino
Year householder moved into unit - Moved in 1995 to 1998 (%) - American Indian and Alaska Native
Year householder moved into unit - Moved in 1995 to 1998 (%) - Multirace
Year householder moved into unit - Moved in 1995 to 1998 (%) - Other Race
Year householder moved into unit - Moved in 1990 to 1994 (%)
Year householder moved into unit - Moved in 1990 to 1994 (%) - White
Year householder moved into unit - Moved in 1990 to 1994 (%) - Black or African American
Year householder moved into unit - Moved in 1990 to 1994 (%) - Asian
Year householder moved into unit - Moved in 1990 to 1994 (%) - Hispanic or Latino
Year householder moved into unit - Moved in 1990 to 1994 (%) - American Indian and Alaska Native
Year householder moved into unit - Moved in 1990 to 1994 (%) - Multirace
Year householder moved into unit - Moved in 1990 to 1994 (%) - Other Race
Year householder moved into unit - Moved in 1980 to 1989 (%)
Year householder moved into unit - Moved in 1980 to 1989 (%) - White
Year householder moved into unit - Moved in 1980 to 1989 (%) - Black or African American
Year householder moved into unit - Moved in 1980 to 1989 (%) - Asian
Year householder moved into unit - Moved in 1980 to 1989 (%) - Hispanic or Latino
Year householder moved into unit - Moved in 1980 to 1989 (%) - American Indian and Alaska Native
Year householder moved into unit - Moved in 1980 to 1989 (%) - Multirace
Year householder moved into unit - Moved in 1980 to 1989 (%) - Other Race
Year householder moved into unit - Moved in 1970 to 1979 (%)
Year householder moved into unit - Moved in 1970 to 1979 (%) - White
Year householder moved into unit - Moved in 1970 to 1979 (%) - Black or African American
Year householder moved into unit - Moved in 1970 to 1979 (%) - Asian
Year householder moved into unit - Moved in 1970 to 1979 (%) - Hispanic or Latino
Year householder moved into unit - Moved in 1970 to 1979 (%) - American Indian and Alaska Native
Year householder moved into unit - Moved in 1970 to 1979 (%) - Multirace
Year householder moved into unit - Moved in 1970 to 1979 (%) - Other Race
Year householder moved into unit - Moved in 1969 or earlier (%)
Year householder moved into unit - Moved in 1969 or earlier (%) - White
Year householder moved into unit - Moved in 1969 or earlier (%) - Black or African American
Year householder moved into unit - Moved in 1969 or earlier (%) - Asian
Year householder moved into unit - Moved in 1969 or earlier (%) - Hispanic or Latino
Year householder moved into unit - Moved in 1969 or earlier (%) - American Indian and Alaska Native
Year householder moved into unit - Moved in 1969 or earlier (%) - Multirace
Year householder moved into unit - Moved in 1969 or earlier (%) - Other Race
Housing units lacking complete plumbing facilities (%)
Housing units lacking complete kitchen facilities (%)
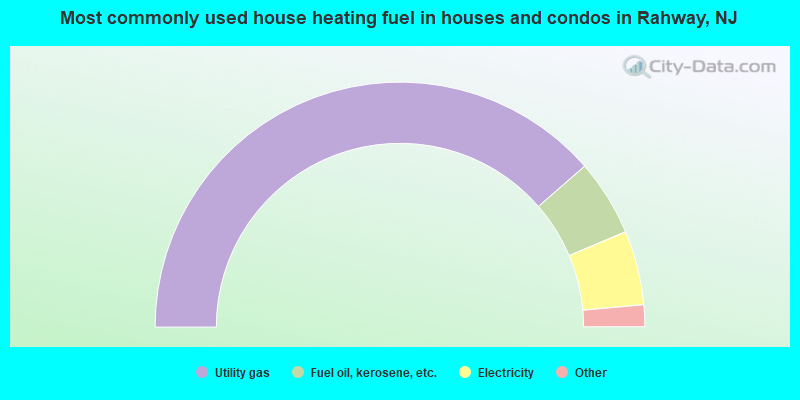
House heating fuel used in houses and condos - Utility gas (%)
House heating fuel used in houses and condos - Bottled, tank, or LP gas (%)
House heating fuel used in houses and condos - Electricity (%)
House heating fuel used in houses and condos - Fuel oil, kerosene, etc. (%)
House heating fuel used in houses and condos - Coal or coke (%)
House heating fuel used in houses and condos - Wood (%)
House heating fuel used in houses and condos - Solar energy (%)
House heating fuel used in houses and condos - Other fuel (%)
House heating fuel used in houses and condos - No fuel used (%)
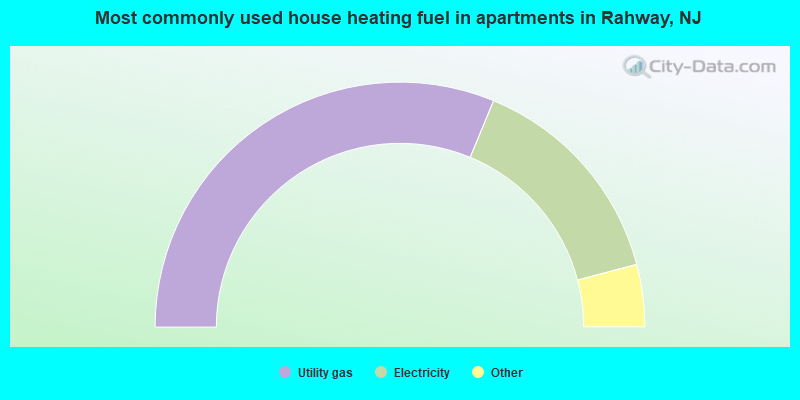
House heating fuel used in apartments - Utility gas (%)
House heating fuel used in apartments - Bottled, tank, or LP gas (%)
House heating fuel used in apartments - Electricity (%)
House heating fuel used in apartments - Fuel oil, kerosene, etc. (%)
House heating fuel used in apartments - Coal or coke (%)
House heating fuel used in apartments - Wood (%)
House heating fuel used in apartments - Solar energy (%)
House heating fuel used in apartments - Other fuel (%)
House heating fuel used in apartments - No fuel used (%)
Latest news about housing in Rahway, NJ collected exclusively by city-data.com from local newspapers, TV, and radio stations
Median year house/condo built: 1955Median year apartment built: 1986Household type by relationship:
Households: 29,546
Male householders: 5,356 (1,425 living alone ), Female householders: 6,674 (2,272 living alone )4,980 spouses (4,794 opposite-sex spouses ), 715 unmarried partners , (691 opposite-sex unmarried partners ), 9,217 children (8,469 natural , 292 adopted , 455 stepchildren ), 344 grandchildren , 323 brothers or sisters , 843 parents , 8 foster children , 554 other relatives , 407 non-relatives In group quarters: 119
Size of family households: 3,313 2-persons , 1,773 3-persons , 1,509 4-persons , 802 5-persons , 185 6-persons , 113 7-or-more-persons .
Size of nonfamily households: 3,591 1-person , 816 2-persons , 67 3-persons .
3,386 married couples with children. single-parent households (1,118 men , 1,184 women ).
68.4% of residents of Rahway speak English at home. of residents speak Spanish at home (64% speak English very well , 15% speak English well , 16% speak English not well , 5% don't speak English at all ).of residents speak other Indo-European language at home (68% speak English very well , 21% speak English well , 11% speak English not well ).of residents speak Asian or Pacific Island language at home (92% speak English very well , 5% speak English well , 2% speak English not well , 1% don't speak English at all ).of residents speak other language at home (50% speak English very well , 26% speak English well , 23% speak English not well ).
Foreign born population: 6,431 (21.8%)of them are naturalized citizens )
Median number of rooms in houses and condos:
Median number of rooms in apartments
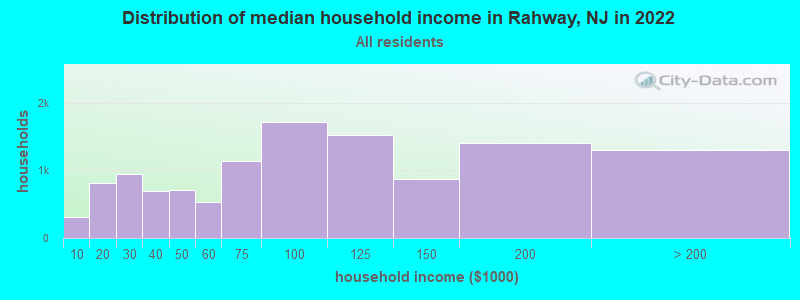
Rahway, NJ household income distribution 313 Less than $10,000817 $10,000 to $19,999939 $20,000 to $29,999693 $30,000 to $39,999708 $40,000 to $49,999536 $50,000 to $59,9991,139 $60,000 to $74,9991,715 $75,000 to $99,9991,523 $100,000 to $124,999874 $125,000 to $149,9991,409 $150,000 to $199,9991,302 $200,000 or more
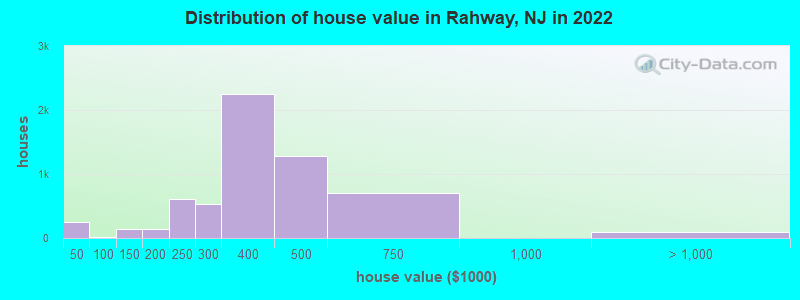
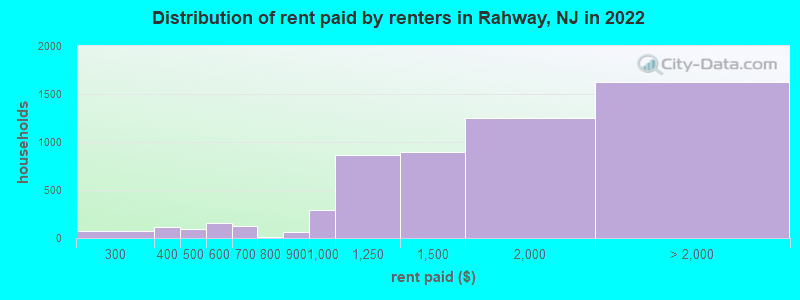
Home value of owner - occupied houses in 2022 in Rahway, NJ 103 Less than $10,00074 $10,000 to $14,99915 $25,000 to $29,99946 $30,000 to $34,9998 $35,000 to $39,9994 $80,000 to $89,9997 $90,000 to $99,99920 $100,000 to $124,999123 $125,000 to $149,99938 $150,000 to $174,999101 $175,000 to $199,999612 $200,000 to $249,999535 $250,000 to $299,9992,251 $300,000 to $399,9991,274 $400,000 to $499,999707 $500,000 to $749,99910 $1,000,000 to $1,499,99988 $2,000,000 or moreRent paid by renters in 2022 in Rahway, NJ 18 $200 to $24953 $250 to $29936 $300 to $34974 $350 to $39994 $450 to $499119 $500 to $54940 $550 to $599109 $600 to $64915 $650 to $69914 $750 to $79965 $800 to $899291 $900 to $999862 $1,000 to $1,249899 $1,250 to $1,4991,245 $1,500 to $1,9991,097 $2,000 to $2,499333 $2,500 to $2,999196 No cash rent
Percentage of workers working in this county: 47.3%Number of people working at home: 2,036 (13.9% of all workers )
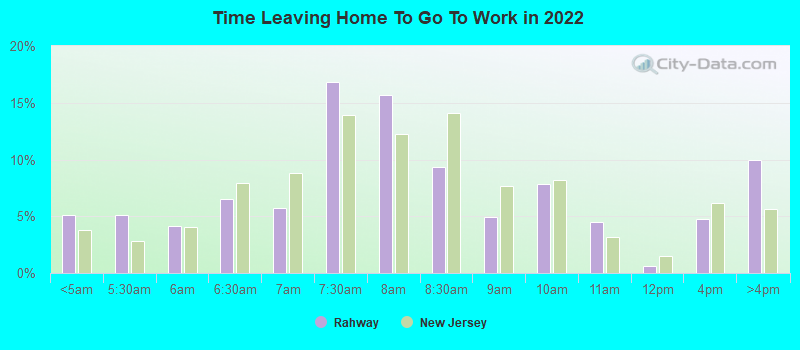
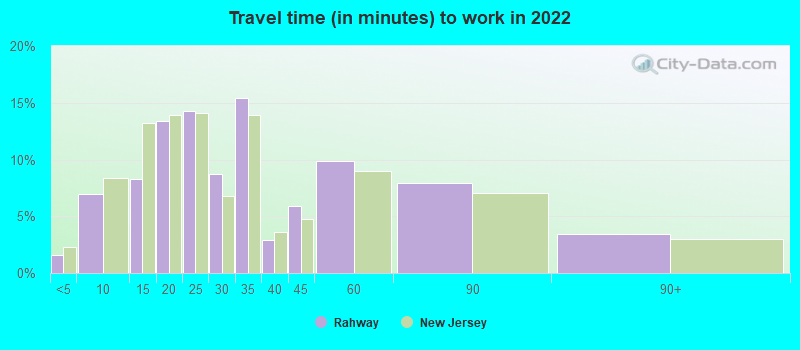
Travel time to work (commute)
Less than 5 minutes: 1625 to 9 minutes: 1,08210 to 14 minutes: 1,28215 to 19 minutes: 1,06520 to 24 minutes: 1,47525 to 29 minutes: 96530 to 34 minutes: 1,83435 to 39 minutes: 34940 to 44 minutes: 1,29645 to 59 minutes: 1,36060 to 89 minutes: 1,07490 or more minutes: 660
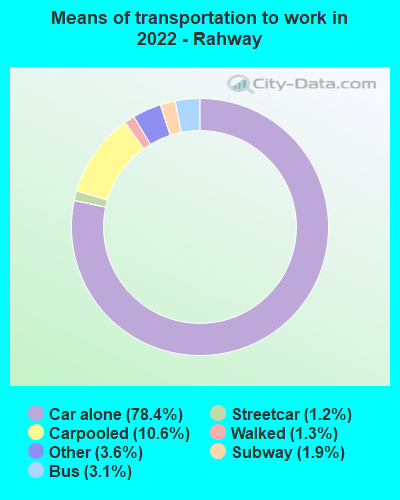
Means of transportation to work:
Drove a car alone: 8,564 (64.6%)Carpooled: 1,399 (10.5%)Bus : 377 (2.8%)Subway or elevated rail : 121 (0.9%)Long-distance train or commuter rail : 255 (1.9%)Taxi: 348 (2.6%)Walked: 161 (1.2%)Worked at home: 2,036 (15.3%)
Unemployment by race in 2022
Unemployment rate for White non-Hispanic residents 4.0% Males9.0% FemalesUnemployment rate for Black residents 17.5% Males4.9% FemalesUnemployment rate for Asian residents 1.5% Males1.4% FemalesUnemployment rate for other race residents 3.4% Males14.6% FemalesUnemployment rate for two or more race residents 1.8% Males18.6% FemalesUnemployment rate for Hispanic or Latino residents 2.4% Males17.8% Females
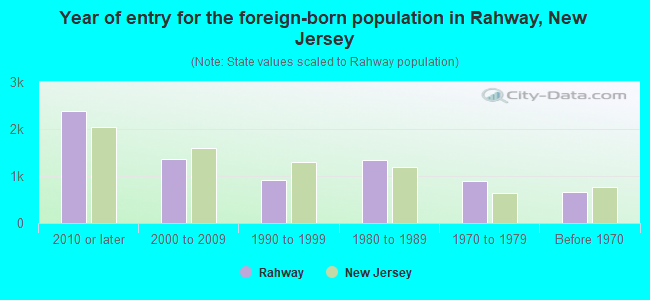
Year of entry for the foreign-born population in Rahway, New Jersey
2,388 2010 or later 1,353 2000 to 2009 916 1990 to 1999 1,333 1980 to 1989 895 1970 to 1979 653 Before 1970
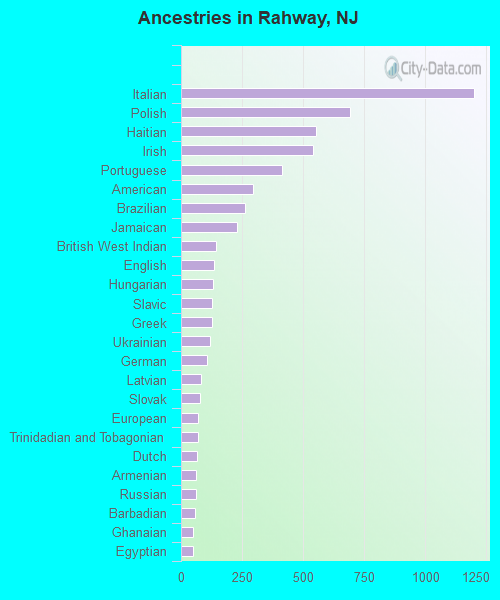
First ancestries reported:
Italian: 1,201 (7.2%)
Polish: 691 (4.2%)
Haitian: 553 (3.3%)
Irish: 542 (3.3%)
Portuguese: 412 (2.5%)
American: 294 (1.8%)
Brazilian: 261 (1.6%)
Jamaican: 231 (1.4%)
British West Indian: 143 (0.9%)
English: 134 (0.8%)
Hungarian: 132 (0.8%)
Slavic: 128 (0.8%)
Greek: 126 (0.8%)
Ukrainian: 119 (0.7%)
German: 105 (0.6%)
Latvian: 82 (0.5%)
Slovak: 79 (0.5%)
European: 70 (0.4%)
Trinidadian and Tobagonian: 69 (0.4%)
Dutch: 67 (0.4%)
Armenian: 63 (0.4%)
Russian: 60 (0.4%)
Barbadian: 56 (0.3%)
Ghanaian: 51 (0.3%)
Egyptian: 48 (0.3%)
Scotch-Irish: 46 (0.3%)
African: 36 (0.2%)
Swedish: 26 (0.2%)
Lithuanian: 25 (0.2%)
Moroccan: 19 (0.1%)
Israeli: 18 (0.1%)
West Indian: 16 (0.10%)
Guyanese: 15 (0.09%)
Belgian: 12 (0.07%)
Nigerian: 12 (0.07%)
British: 12 (0.07%)
Czech: 8 (0.05%)
French Canadian: 7 (0.04%) Most common places of birth for foreign-born residents (%): India Rahway:
10.0% (625)New Jersey:
12.8% (274,609)
Peru Rahway:
8.4% (523)New Jersey:
2.7% (58,563)
Haiti Rahway:
8.0% (502)New Jersey:
2.3% (49,491)
Dominican Republic Rahway:
8.0% (499)New Jersey:
9.7% (209,055)
Cuba Rahway:
5.7% (354)New Jersey:
2.1% (45,435)
Philippines Rahway:
5.2% (327)New Jersey:
4.0% (85,934)
Poland Rahway:
4.7% (295)New Jersey:
2.3% (48,811)
Brazil Rahway:
4.6% (289)New Jersey:
2.1% (46,020)
Honduras Rahway:
4.4% (277)New Jersey:
1.7% (37,335)
Portugal Rahway:
3.9% (241)New Jersey:
1.3% (28,871)
Trinidad and Tobago Rahway:
3.0% (190)New Jersey:
0.7% (15,533)
China, excluding Hong Kong and Taiwan Rahway:
2.5% (159)New Jersey:
3.7% (78,969)
Korea Rahway:
2.3% (143)New Jersey:
3.3% (70,512)
Jamaica Rahway:
2.1% (133)New Jersey:
2.2% (47,365)
Colombia Rahway:
2.1% (132)New Jersey:
4.2% (90,817)
Latvia Rahway:
1.8% (115)New Jersey:
0.1% (1,789)
Uruguay Rahway:
1.8% (114)New Jersey:
0.3% (6,972)
Venezuela Rahway:
1.8% (113)New Jersey:
0.6% (12,929)
El Salvador Rahway:
1.6% (102)New Jersey:
2.3% (48,885)
Italy Rahway:
1.6% (97)New Jersey:
1.5% (33,198)
Place of birth for U.S.-born residents:
This state: 16,317Other state: 5,734Northeast: 4,264Midwest: 229South: 1,226West: 92 85.2% of Rahway residents lived in the same house 1 years ago.
Out of people who lived in different houses, 33.5% lived in this county.
Out of people who lived in different counties, 76.3% lived in New Jersey.
Rahway:
85.2%State average:
90.4%
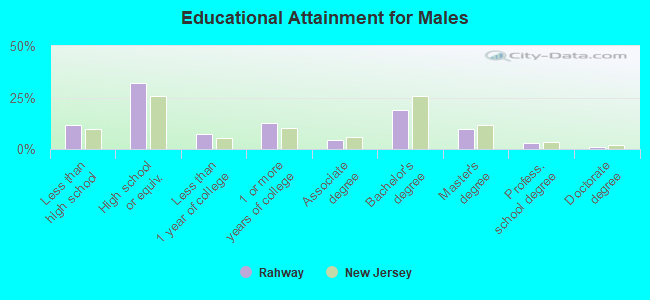
Education attainment for males 25 years and older:
No schooling: 141Nursery to 4th grade: 675th and 6th grade: 937th and 8th grade: 1969th grade: 2710th grade: 13511th grade: 13612th grade, no diploma: 289High school graduate (or equivalency): 3,026Less than 1 year of college: 668Some college more than 1 year, no degree: 1,194Associate degree: 414Bachelor's degree: 1,798Master's degree: 939Professional school degree: 275Doctorate degree: 95
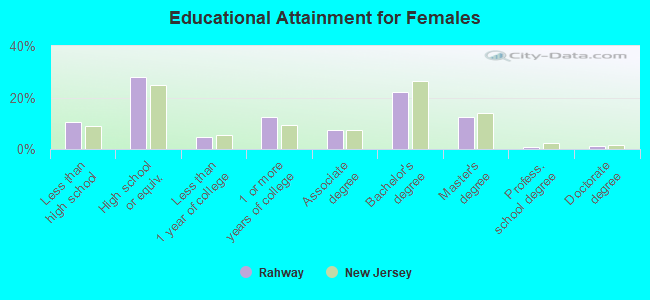
Education attainment for females 25 years and older:
No schooling: 245Nursery to 4th grade: 625th and 6th grade: 187th and 8th grade: 499th grade: 11210th grade: 7611th grade: 28812th grade, no diploma: 359High school graduate (or equivalency): 3,186Less than 1 year of college: 544Some college more than 1 year, no degree: 1,424Associate degree: 867Bachelor's degree: 2,555Master's degree: 1,445Professional school degree: 92Doctorate degree: 131
Housing units in structures:
One, detached: 6,170One, attached: 891Two: 1,4923 or 4: 3725 to 9: 37810 to 19: 45920 to 49: 88950 or more: 2,055Boats, RVs, vans, etc.: 184Housing units lacking complete plumbing facilities in 2022: 0.7%Housing units lacking complete kitchen facilities in 2022: 0.6%House/condo owner moved in on average 17 years ago
Renter moved in on average 2 years ago
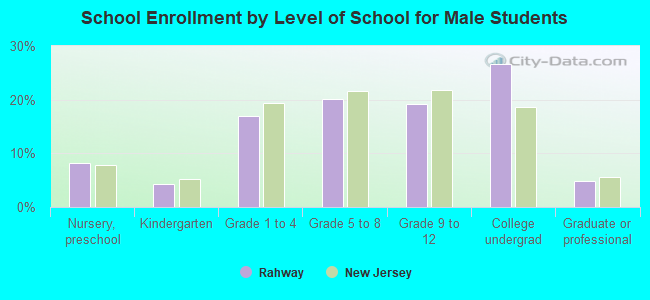
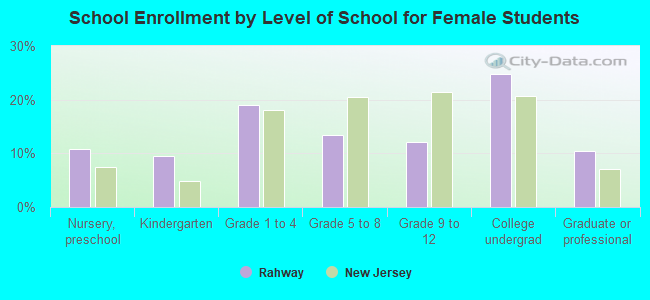
Private vs. public school enrollment:
Students in private schools in grades 1 to 8 (elementary and middle school): 327 Here:
14.0%New Jersey:
12.3%
Students in private schools in grades 9 to 12 (high school): 180 Here:
17.4%New Jersey:
13.1%
Students in private undergraduate colleges: 908 Here:
52.7%New Jersey:
33.2%