Robstown, TX (Texas) Houses and Residents
| Robstown: | $91,894 |
| Texas: | $275,400 |
Mean price in 2022:
Detached houses: $119,382
Here: $119,382 State: $369,058 Mobile homes: $69,497
Here: $69,497 State: $124,413
Total population: 11,657 (All urban)
Houses: 4,431 (3,835 occupied: 2,701 owner occupied, 1,118 renter occupied)
| % of renters here: | 29% |
| State: | 38% |
Housing density: 367 houses/condos per square mile
Median price asked for vacant for-sale houses and condos in 2022 in this county: $348,519.
Median contract rent in 2022: $620 (lower quartile is $368, upper quartile is $990)
Median rent asked for vacant for-rent units in 2022: $2,631
Median gross rent in Robstown, TX in 2022: $939
Housing units in Robstown with a mortgage: 634 (0 second mortgage, 0 home equity loan, 0 both second mortgage and home equity loan)
Houses without a mortgage: 0
Median household income for houses/condos with a mortgage: $77,402
Median household income for apartments without a mortgage: $23,499
Median monthly housing costs: $705
Compare current foreclosures near Robstown, TX:
| Photo | Address | Area | Beds / Baths | Price | Details |
|---|---|---|---|---|---|

|
#1
Paisano Trl
Robstown, TX 78380
|
1,655 sq. feet
|
2 baths 3 beds |
$359,900
|
show details |

|
#2
Beechcraft Rd
Robstown, TX 78380
|
1,371 sq. feet
|
2 baths 3 beds |
show details | |

|
#3
Falcon Ln
Robstown, TX 78380
|
1,854 sq. feet
|
- baths - beds |
show details | |

|
#4
N Grando Circle Dr
Robstown, TX 78380
|
- sq. feet
|
- baths - beds |
show details | |

|
#5
Sweet Water Rd
Robstown, TX 78380
|
800 sq. feet
|
- baths - beds |
show details | |

|
#6
Ashburn Ave
Robstown, TX 78380
|
1,584 sq. feet
|
- baths - beds |
show details | |

|
#7
N Horizon Trl
Robstown, TX 78380
|
- sq. feet
|
- baths - beds |
show details | |

|
#8
Amanda Ln
Robstown, TX 78380
|
- sq. feet
|
- baths - beds |
show details | |

|
#9
N 2nd St
Robstown, TX 78380
|
1,160 sq. feet
|
- baths - beds |
show details | |

|
#10
Mesquite Ln # B
Robstown, TX 78380
|
- sq. feet
|
- baths - beds |
show details |
| Photo | Address | Area | Beds / Baths | Price | Details |
|---|---|---|---|---|---|

|
#11
Cactus St
Robstown, TX 78380
|
1,110 sq. feet
|
- baths - beds |
show details | |

|
#12
Ih 60 Access Rd, Lot 31
Robstown, TX 78380
|
- sq. feet
|
- baths - beds |
show details | |

|
#13
N Grando Circle Dr
Robstown, TX 78380
|
- sq. feet
|
- baths - beds |
show details | |

|
#14
Oak Ln
Robstown, TX 78380
|
- sq. feet
|
- baths - beds |
show details | |

|
#15
Annapolis Dr
Corpus Christi, TX 78415
|
- sq. feet
|
1 baths 3 beds |
show details | |

|
#16
Navarro St
Corpus Christi, TX 78415
|
1,435 sq. feet
|
2 baths 4 beds |
show details | |

|
#17
Elgin St
Corpus Christi, TX 78405
|
2,357 sq. feet
|
3 baths 4 beds |
show details | |

|
#18
Hemlock Rd
Corpus Christi, TX 78410
|
1,412 sq. feet
|
2 baths 4 beds |
show details | |

|
#19
Green Trail Dr
Corpus Christi, TX 78405
|
990 sq. feet
|
2 baths 3 beds |
show details | |

|
#20
Randolph Cir
Corpus Christi, TX 78410
|
3,766 sq. feet
|
4 baths 3 beds |
show details |
| Photo | Address | Area | Beds / Baths | Price | Details |
|---|---|---|---|---|---|

|
#21
Barlow Trl
Corpus Christi, TX 78410
|
- sq. feet
|
2 baths 4 beds |
show details | |

|
#22
Maverick Drive
Corpus Christi, TX 78410
|
1,621 sq. feet
|
2 baths 3 beds |
show details | |

|
#23
Carreta Park
Bishop, TX 78343
|
2,146 sq. feet
|
2 baths 3 beds |
show details | |

|
#24
Red River Dr
Corpus Christi, TX 78410
|
2,586 sq. feet
|
2 baths 4 beds |
show details | |

|
#25
Calle San Miguel
Corpus Christi, TX 78417
|
1,354 sq. feet
|
- baths 3 beds |
show details | |

|
#26
Crestlea Dr
Corpus Christi, TX 78415
|
1,310 sq. feet
|
- baths 3 beds |
show details | |

|
#27
Annapolis Dr
Corpus Christi, TX 78404
|
876 sq. feet
|
- baths - beds |
show details | |

|
#28
Beal Dr
Corpus Christi, TX 78410
|
5,090 sq. feet
|
- baths 6 beds |
show details | |

|
#29
Big Cyprus Byu
Corpus Christi, TX 78410
|
- sq. feet
|
- baths - beds |
show details | |

|
#30
Santa Lucia St
Corpus Christi, TX 78415
|
1,159 sq. feet
|
- baths - beds |
show details |
| Photo | Address | Area | Beds / Baths | Price | Details |
|---|---|---|---|---|---|

|
#31
Crest Veil Dr
Corpus Christi, TX 78415
|
1,385 sq. feet
|
- baths - beds |
show details | |

|
#32
Fig St
Corpus Christi, TX 78404
|
1,504 sq. feet
|
- baths - beds |
show details | |

|
#33
Ellis Dr
Corpus Christi, TX 78415
|
- sq. feet
|
- baths - beds |
show details | |

|
#34
Franklin Dr
Corpus Christi, TX 78415
|
1,064 sq. feet
|
- baths - beds |
show details | |

|
#35
Ellis Dr
Corpus Christi, TX 78415
|
1,092 sq. feet
|
- baths - beds |
show details | |

|
#36
Santa Lucia St
Corpus Christi, TX 78415
|
1,186 sq. feet
|
- baths - beds |
show details | |

|
#37
Oglethorpe Dr
Corpus Christi, TX 78410
|
1,037 sq. feet
|
- baths - beds |
show details | |

|
#38
Dinn St
Corpus Christi, TX 78415
|
1,964 sq. feet
|
- baths - beds |
show details | |

|
#39
Candace St
Corpus Christi, TX 78415
|
1,805 sq. feet
|
- baths - beds |
show details | |

|
#40
Arlington Dr
Corpus Christi, TX 78415
|
- sq. feet
|
- baths - beds |
show details |
| Photo | Address | Area | Beds / Baths | Price | Details |
|---|---|---|---|---|---|

|
#41
Carlton St
Corpus Christi, TX 78415
|
1,065 sq. feet
|
- baths - beds |
show details | |

|
#42
Green Grove Dr
Corpus Christi, TX 78415
|
1,188 sq. feet
|
- baths - beds |
show details | |

|
#43
County Road 77
Bishop, TX 78343
|
3,489 sq. feet
|
- baths - beds |
show details | |

|
#44
S Bluntzer St
Corpus Christi, TX 78405
|
1,497 sq. feet
|
- baths - beds |
show details | |

|
#45
Ayers St Lot 64
Corpus Christi, TX 78415
|
2,128 sq. feet
|
- baths - beds |
show details | |

|
#46
Sarita St
Corpus Christi, TX 78405
|
1,256 sq. feet
|
- baths - beds |
show details | |

|
#47
Palm Dr
Corpus Christi, TX 78407
|
1,077 sq. feet
|
- baths - beds |
show details | |

|
#48
Camway Dr
Corpus Christi, TX 78415
|
1,237 sq. feet
|
- baths - beds |
show details | |

|
#49
Persimmon St
Corpus Christi, TX 78415
|
1,280 sq. feet
|
- baths - beds |
show details | |

|
Check over 1 million property listings on Foreclosure.com!
|
browse all offers | |||

Latest news about housing in Robstown, TX collected exclusively by city-data.com from local newspapers, TV, and radio stations

 | Looking to relocate...where should we look at homes and is it the right area for us. (21 replies) |
| Kingsville info needed (6 replies) |
| homeowners ins cost (6 replies) |
| Gone but not forgotten- Old Corpus Christi (571 replies) |
| San Antonio Restaurants - Best Barbecue (Barbeque,BBQ) ? (59 replies) |
| Texas Trivia (1626 replies) |

Median year apartment built: 1972
Household type by relationship:
Households: 10,200- Male householders: 1,061 (277 living alone), Female householders: 2,687 (874 living alone)
1,122 spouses (1,115 opposite-sex spouses), 129 unmarried partners, (129 opposite-sex unmarried partners), 3,291 children (3,291 natural, 0 adopted, 0 stepchildren), 811 grandchildren, 173 brothers or sisters, 55 parents, 0 foster children, 492 other relatives, 273 non-relatives
- In group quarters: 100
Size of family households: 1,082 2-persons, 655 3-persons, 424 4-persons, 115 5-persons, 102 6-persons, 215 7-or-more-persons.
Size of nonfamily households: 1,178 1-person, 90 2-persons.
637 married couples with children.
923 single-parent households (63 men, 860 women).
38.8% of residents of Robstown speak English at home.
62.1% of residents speak Spanish at home (70% speak English very well, 18% speak English well, 11% speak English not well, 1% don't speak English at all).
Foreign born population: 420 (4.1%)
(23.6% of them are naturalized citizens)
| Here: | 5.2 |
| State: | 6.3 |
| Here: | 5.0 |
| State: | 4.0 |

- Bedrooms in owner-occupied houses and condos in Robstown, Texas
- 0no bedroom
- 651 bedroom
- 6942 bedrooms
- 1,8293 bedrooms
- 1144 bedrooms
- 05+ bedrooms

- Bedrooms in renter-occupied apartments in Robstown, Texas
- 20no bedroom
- 2361 bedroom
- 1672 bedrooms
- 4153 bedrooms
- 2274 bedrooms
- 535+ bedrooms

- Cars and other vehicles available in Robstown in owner-occupied houses/condos
- 275no vehicle
- 1,1691 vehicle
- 9282 vehicles
- 1343 vehicles
- 1304 vehicles
- 665+ vehicles

- Cars and other vehicles available in Robstown in renter-occupied apartments
- 117no vehicle
- 5391 vehicle
- 3872 vehicles
- 763 vehicles
- 04 vehicles
- 05+ vehicles

- Rooms in owner-occupied houses in Robstown, Texas
- 01 room
- 02 rooms
- 643 rooms
- 6474 rooms
- 9845 rooms
- 3916 rooms
- 187 rooms
- 2058 rooms
- 3939+ rooms

- Rooms in renter-occupied apartments in Robstown, Texas
- 201 room
- 222 rooms
- 1373 rooms
- 1594 rooms
- 3855 rooms
- 1636 rooms
- 1477 rooms
- 318 rooms
- 539+ rooms


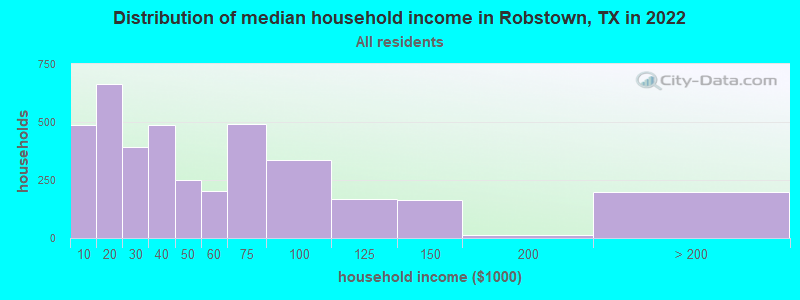
Robstown, TX household income distribution

- 488Less than $10,000
- 663$10,000 to $19,999
- 394$20,000 to $29,999
- 485$30,000 to $39,999
- 250$40,000 to $49,999
- 203$50,000 to $59,999
- 490$60,000 to $74,999
- 335$75,000 to $99,999
- 166$100,000 to $124,999
- 163$125,000 to $149,999
- 13$150,000 to $199,999
- 197$200,000 or more
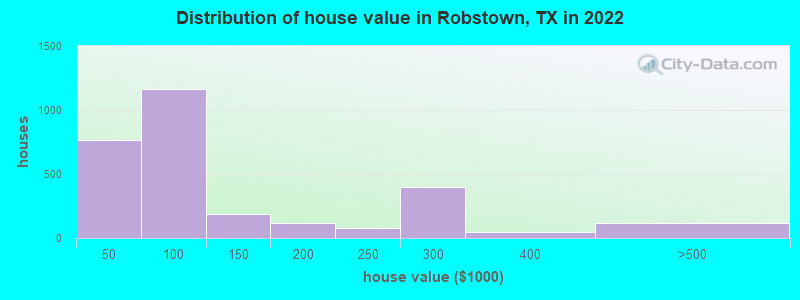
Home value of owner - occupied houses in 2022 in Robstown, TX
-
- 44Less than $10,000
- 49$10,000 to $14,999
- 15$20,000 to $24,999
- 119$25,000 to $29,999
- 85$30,000 to $34,999
- 128$35,000 to $39,999
- 320$40,000 to $49,999
- 115$50,000 to $59,999
- 91$60,000 to $69,999
- 203$70,000 to $79,999
- 292$80,000 to $89,999
- 143$90,000 to $99,999
- 111$100,000 to $124,999
- 77$125,000 to $149,999
- 99$150,000 to $174,999
- 19$175,000 to $199,999
- 81$200,000 to $249,999
- 402$250,000 to $299,999
- 45$300,000 to $399,999
- 117$400,000 to $499,999
Rent paid by renters in 2022 in Robstown, TX
-
- 74Less than $100
- 28$100 to $149
- 27$150 to $199
- 76$200 to $249
- 39$300 to $349
- 66$350 to $399
- 140$500 to $549
- 67$550 to $599
- 38$600 to $649
- 46$650 to $699
- 33$700 to $749
- 41$750 to $799
- 39$800 to $899
- 76$900 to $999
- 252$1,000 to $1,249
- 70No cash rent


Percentage of workers working in this county: 93.9%
Number of people working at home: 186 (4.6% of all workers)
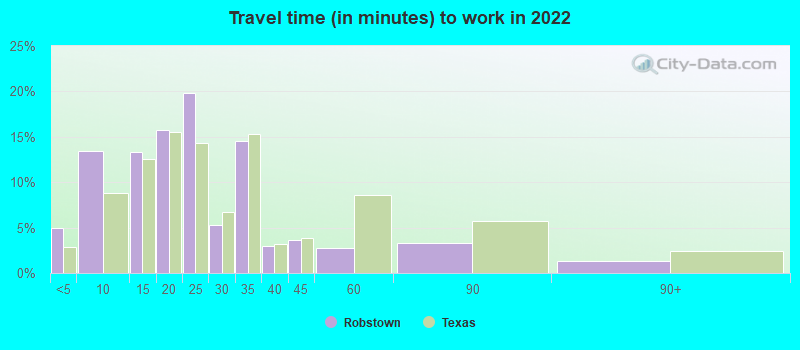
Travel time to work (commute)
- Less than 5 minutes: 329
- 5 to 9 minutes: 735
- 10 to 14 minutes: 325
- 15 to 19 minutes: 575
- 20 to 24 minutes: 530
- 25 to 29 minutes: 0
- 30 to 34 minutes: 944
- 35 to 39 minutes: 112
- 40 to 44 minutes: 0
- 45 to 59 minutes: 132
- 60 to 89 minutes: 27
- 90 or more minutes: 214
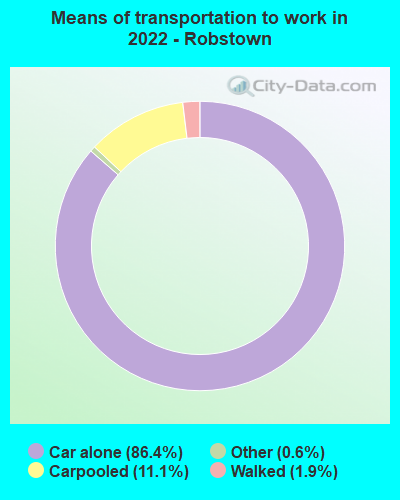
Means of transportation to work:
- Drove a car alone: 2,985 (82.5%)
- Carpooled: 375 (10.4%)
- Taxi: 17 (0.5%)
- Walked: 76 (2.1%)
- Worked at home: 186 (5.1%)

- Unemployment by race in 2022
- Unemployment rate for White non-Hispanic residents
- 21.2%Males
- Unemployment rate for Black residents
- 100.0%Males
- Unemployment rate for two or more race residents
- 6.3%Males
- Unemployment rate for Hispanic or Latino residents
- 9.5%Males
- 6.8%Females

- Year of entry for the foreign-born population in Robstown, Texas
- 262010 or later
- 1302000 to 2009
- 1011990 to 1999
- 2411980 to 1989
- 1511970 to 1979
- 122Before 1970

First ancestries reported:
- English: 131 (1.9%)
- American: 106 (1.5%)
- Czech: 20 (0.3%)
- Egyptian: 3 (0.04%)
- Italian: 2 (0.03%)
- Turkish: 2 (0.03%)
Most common places of birth for foreign-born residents (%):
| Robstown: | 79.6% (390) |
| Texas: | 48.4% (2,411,723) |
| Robstown: | 15.1% (74) |
| Texas: | 3.0% (147,182) |
| Robstown: | 2.4% (12) |
| Texas: | 1.8% (87,382) |
Place of birth for U.S.-born residents:
- This state: 9,346
- Other state: 441
- Northeast: 22
- Midwest: 150
- South: 187
- West: 74
96.3% of Robstown residents lived in the same house 1 years ago.
Out of people who lived in different houses, 33.1% lived in this county.
Out of people who lived in different counties, 98.6% lived in Texas.
| Robstown: | 96.3% |
| State average: | 85.7% |
Education attainment for males 25 years and older:
- No schooling: 0
- Nursery to 4th grade: 74
- 5th and 6th grade: 50
- 7th and 8th grade: 119
- 9th grade: 169
- 10th grade: 94
- 11th grade: 190
- 12th grade, no diploma: 124
- High school graduate (or equivalency): 1,050
- Less than 1 year of college: 76
- Some college more than 1 year, no degree: 303
- Associate degree: 257
- Bachelor's degree: 177
- Master's degree: 111
- Professional school degree: 0
- Doctorate degree: 26

Education attainment for females 25 years and older:
- No schooling: 237
- Nursery to 4th grade: 199
- 5th and 6th grade: 94
- 7th and 8th grade: 92
- 9th grade: 248
- 10th grade: 67
- 11th grade: 183
- 12th grade, no diploma: 96
- High school graduate (or equivalency): 1,013
- Less than 1 year of college: 180
- Some college more than 1 year, no degree: 774
- Associate degree: 241
- Bachelor's degree: 154
- Master's degree: 52
- Professional school degree: 67
- Doctorate degree: 49


Housing units in structures:
- One, detached: 3,794
- One, attached: 85
- Two: 131
- 3 or 4: 72
- 5 to 9: 56
- 20 to 49: 82
- 50 or more: 51
- Mobile homes: 156
Median worth of mobile homes: $81,004
Housing units lacking complete kitchen facilities in 2022: 5.8%
House/condo owner moved in on average 27 years ago
Renter moved in on average 8 years ago

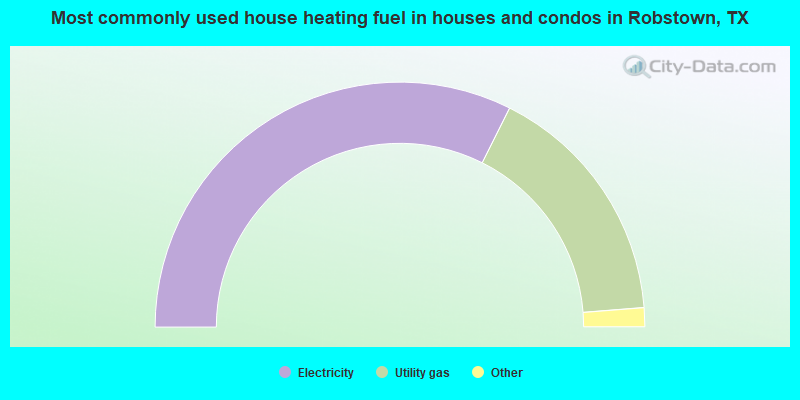
- 64.8%Electricity
- 32.7%Utility gas
- 1.0%Other fuel
- 0.8%No fuel used
- 0.7%Bottled, tank, or LP gas
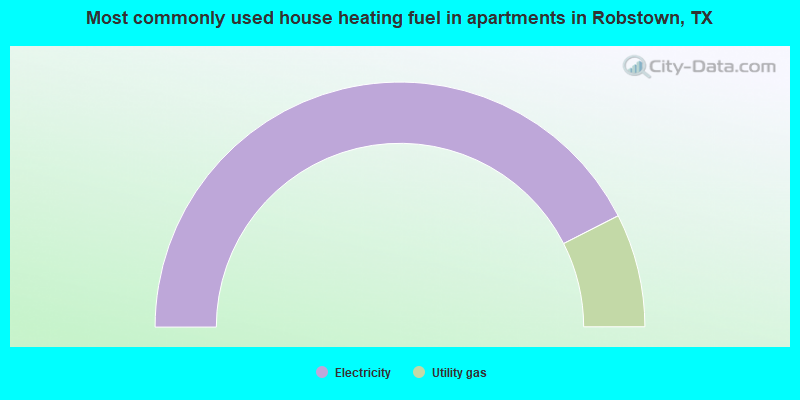
- 85.0%Electricity
- 15.0%Utility gas
Private vs. public school enrollment:
| Here: | 0.0% |
| Texas: | 8.8% |
| Here: | 25.6% |
| Texas: | 8.0% |
| Here: | 0.0% |
| Texas: | 16.2% |


