Rock Creek, TN (Tennessee) Houses and Residents
| Rock Creek: | $271,897 |
| Tennessee: | $284,800 |
Total population: 5,035 (Urban population: 0, Rural population: 4,607 (269 farm, 4,338 nonfarm))
Houses: 1,875 (1,707 occupied: 1,447 owner occupied, 260 renter occupied)
| % of renters here: | 15% |
| State: | 33% |
Housing density: 19 houses/condos per square mile
Median price asked for vacant for-sale houses and condos in 2022 in this county: $195,826.
Median contract rent in 2022: $718 (lower quartile is $623, upper quartile is $839)
Median rent asked for vacant for-rent units in 2022: $634
Median gross rent in Rock Creek, TN in 2022: $945
Housing units in Rock Creek with a mortgage: 449 (19 second mortgage, 0 home equity loan, 0 both second mortgage and home equity loan)
Houses without a mortgage: 208


Household type by relationship:
Households: 30,258- In family households: 26,196 (5,966 male householders, 2,491 female householders)
6,271 spouses, 8,716 children (7,873 natural, 216 adopted, 627 stepchildren), 908 grandchildren, 273 brothers or sisters, 241 parents, foster children, 339 other relatives, 753 non-relatives
- In nonfamily households: 4,062 (1,599 male householders (1,306 living alone)), 1,794 female householders (1,587 living alone)), 669 nonrelatives
- In group quarters: 359 (277 institutionalized population)
4,576 married couples with children.
1,493 single-parent households (321 men, 1,172 women).
98.3% of residents of Rock Creek speak English at home.
1.3% of residents speak Spanish at home (67% speak English very well, 24% speak English well, 9% speak English not well).
0.4% of residents speak other Indo-European language at home (100% speak English very well).
Foreign born population: 14 (0.3%)
(121.4% of them are naturalized citizens)
| Here: | 6.3 |
| State: | 6.5 |
| Here: | 4.9 |
| State: | 4.4 |

- Bedrooms in owner-occupied houses and condos in Rock Creek, Tennessee
- 0no bedroom
- 451 bedroom
- 2682 bedrooms
- 9223 bedrooms
- 1494 bedrooms
- 635+ bedrooms

- Bedrooms in renter-occupied apartments in Rock Creek, Tennessee
- 0no bedroom
- 91 bedroom
- 1482 bedrooms
- 863 bedrooms
- 174 bedrooms
- 05+ bedrooms

- Cars and other vehicles available in Rock Creek in owner-occupied houses/condos
- 6no vehicle
- 3651 vehicle
- 6142 vehicles
- 3293 vehicles
- 774 vehicles
- 565+ vehicles

- Cars and other vehicles available in Rock Creek in renter-occupied apartments
- 0no vehicle
- 691 vehicle
- 1112 vehicles
- 483 vehicles
- 324 vehicles
- 05+ vehicles

- Rooms in owner-occupied houses in Rock Creek, Tennessee
- 01 room
- 122 rooms
- 243 rooms
- 1814 rooms
- 4005 rooms
- 3346 rooms
- 2607 rooms
- 1488 rooms
- 889+ rooms

- Rooms in renter-occupied apartments in Rock Creek, Tennessee
- 01 room
- 02 rooms
- 93 rooms
- 1184 rooms
- 405 rooms
- 686 rooms
- 257 rooms
- 08 rooms
- 09+ rooms


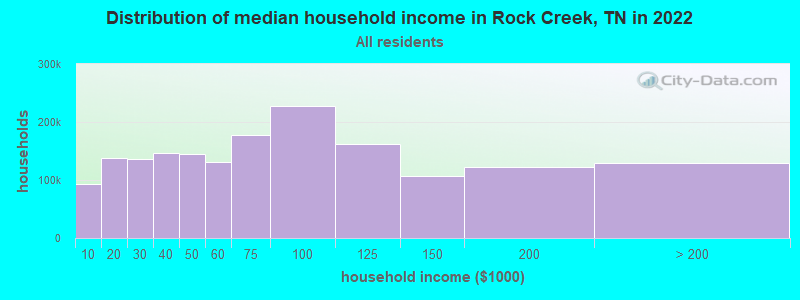
Rock Creek, TN household income distribution

- 61,729Less than $10,000
- 103,538$10,000 to $19,999
- 98,192$20,000 to $29,999
- 100,397$30,000 to $39,999
- 97,071$40,000 to $49,999
- 89,847$50,000 to $59,999
- 122,497$60,000 to $74,999
- 156,136$75,000 to $99,999
- 116,772$100,000 to $124,999
- 69,555$125,000 to $149,999
- 76,343$150,000 to $199,999
- 64,537$200,000 or more
Percentage of workers working in this county: 66.9%
Number of people working at home: 246 (9.8% of all workers)
Travel time to work (commute)
- Less than 5 minutes: 96
- 5 to 9 minutes: 181
- 10 to 14 minutes: 233
- 15 to 19 minutes: 540
- 20 to 24 minutes: 203
- 25 to 29 minutes: 74
- 30 to 34 minutes: 281
- 35 to 39 minutes: 48
- 40 to 44 minutes: 24
- 45 to 59 minutes: 201
- 60 to 89 minutes: 181
- 90 or more minutes: 107
Means of transportation to work:
- Drove a car alone: 1,815 (80.9%)
- Carpooled: 279 (12.4%)
- Bus or trolley bus: 29 (1.3%)
- Taxi: 6 (0.3%)
- Motorcycle: 7 (0.3%)
- Walked: 33 (1.5%)
- Worked at home: 74 (3.3%)


- Year of entry for the foreign-born population in Rock Creek, Tennessee
- 01995 to March 2000
- 01990 to 1994
- 01985 to 1989
- 71980 to 1984
- 01975 to 1979
- 01970 to 1974
- 01965 to 1969
- 0Before 1965
Most common places of birth for foreign-born residents (%):
| Rock Creek: | 100.0% (7) |
| Tennessee: | 0.6% (1,012) |
Place of birth for U.S.-born residents:
- This state: 3,004
- Other state: 1,576
- Northeast: 167
- Midwest: 732
- South: 575
- West: 102
54% of Rock Creek residents lived in the same house 5 years ago.
Out of people who lived in different houses, 52% lived in this county.
Out of people who lived in different counties, 52% lived in Tennessee.
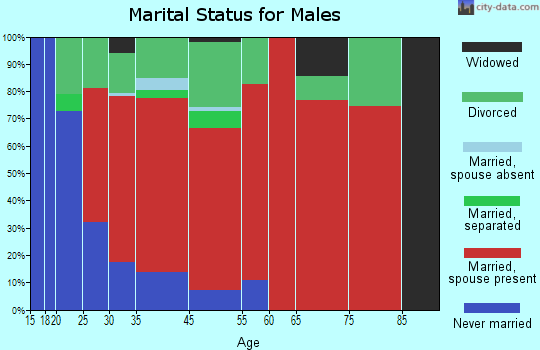
Education attainment for males 25 years and older:
- No schooling: 6
- Nursery to 4th grade: 7
- 5th and 6th grade: 42
- 7th and 8th grade: 97
- 9th grade: 34
- 10th grade: 72
- 11th grade: 85
- 12th grade, no diploma: 81
- High school graduate (or equivalency): 657
- Less than 1 year of college: 102
- Some college more than 1 year, no degree: 143
- Associate degree: 43
- Bachelor's degree: 120
- Master's degree: 28
- Professional school degree: 8
- Doctorate degree: 0

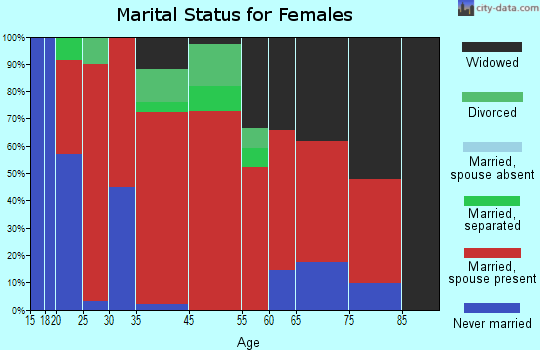
Education attainment for females 25 years and older:
- No schooling: 6
- Nursery to 4th grade: 0
- 5th and 6th grade: 24
- 7th and 8th grade: 84
- 9th grade: 69
- 10th grade: 82
- 11th grade: 75
- 12th grade, no diploma: 68
- High school graduate (or equivalency): 694
- Less than 1 year of college: 111
- Some college more than 1 year, no degree: 158
- Associate degree: 75
- Bachelor's degree: 58
- Master's degree: 63
- Professional school degree: 0
- Doctorate degree: 0

Housing units in structures:
- One, detached: 1,239
- One, attached: 16
- 3 or 4: 6
- Mobile homes: 614
Median worth of mobile homes: $114,623
Housing units lacking complete kitchen facilities: 1.2%

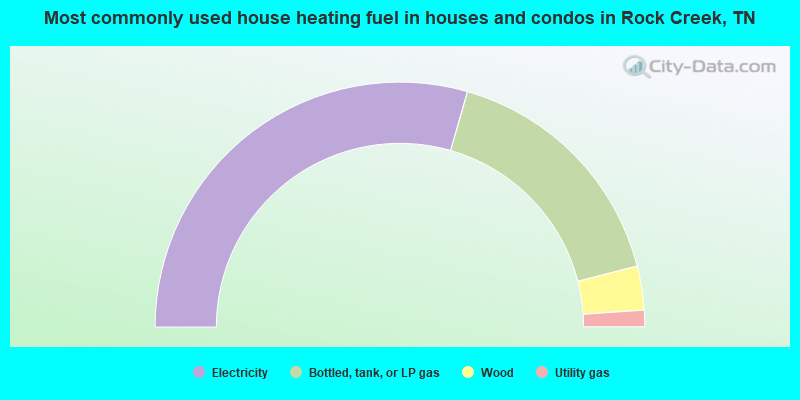
- 58.9%Electricity
- 33.1%Bottled, tank, or LP gas
- 5.8%Wood
- 2.2%Utility gas
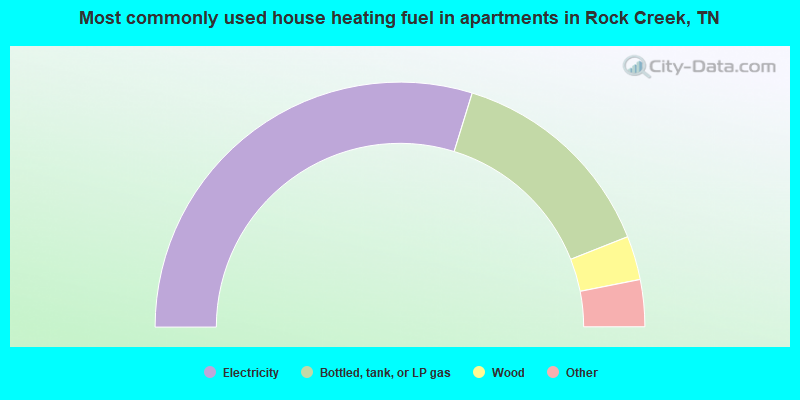
- 59.6%Electricity
- 28.5%Bottled, tank, or LP gas
- 5.8%Wood
- 3.5%Fuel oil, kerosene, etc.
- 2.7%Utility gas
Private vs. public school enrollment:
| Here: | 2.8% |
| Tennessee: | 9.5% |
| Here: | 7.8% |
| Tennessee: | 10.4% |
| Here: | 23.8% |
| Tennessee: | 22.8% |


