Rock Spring, GA (Georgia) Houses and Residents
| Rock Spring: | $215,457 |
| Georgia: | $297,400 |
Total population: 4,809 (Urban population: 0, Rural population: 4,601 (131 farm, 4,470 nonfarm))
Houses: 1,735 (1,617 occupied: 1,406 owner occupied, 211 renter occupied)
| % of renters here: | 13% |
| State: | 34% |
Housing density: 65 houses/condos per square mile
Median price asked for vacant for-sale houses and condos in 2022 in this county: $156,996.
Median contract rent in 2022: $711 (lower quartile is $705, upper quartile is $760)
Median gross rent in Rock Spring, GA in 2022: $921
Housing units in Rock Spring with a mortgage: 579 (48 second mortgage, 23 home equity loan, 0 both second mortgage and home equity loan)
Houses without a mortgage: 350


Household type by relationship:
Households: 67,433- In family households: 58,470 (13,100 male householders, 5,798 female householders)
14,073 spouses, 18,869 children (16,746 natural, 570 adopted, 1,553 stepchildren), 2,523 grandchildren, 555 brothers or sisters, 598 parents, foster children, 820 other relatives, 1,604 non-relatives
- In nonfamily households: 8,963 (3,407 male householders (2,811 living alone)), 4,192 female householders (3,737 living alone)), 1,364 nonrelatives
- In group quarters: 1,323 (1,249 institutionalized population)
10,192 married couples with children.
3,163 single-parent households (771 men, 2,392 women).
97.2% of residents of Rock Spring speak English at home.
1.3% of residents speak Spanish at home (68% speak English very well, 16% speak English well, 16% speak English not well).
1.5% of residents speak other Indo-European language at home (62% speak English very well, 38% speak English well).
Foreign born population: 89 (1.7%)
(0.0% of them are naturalized citizens)
| Here: | 6.2 |
| State: | 6.8 |
| Here: | 5.1 |
| State: | 4.6 |

- Bedrooms in owner-occupied houses and condos in Rock Spring, Georgia
- 0no bedroom
- 61 bedroom
- 3282 bedrooms
- 8673 bedrooms
- 1724 bedrooms
- 335+ bedrooms

- Bedrooms in renter-occupied apartments in Rock Spring, Georgia
- 0no bedroom
- 171 bedroom
- 1252 bedrooms
- 513 bedrooms
- 64 bedrooms
- 125+ bedrooms

- Cars and other vehicles available in Rock Spring in owner-occupied houses/condos
- 54no vehicle
- 2761 vehicle
- 6102 vehicles
- 3723 vehicles
- 414 vehicles
- 535+ vehicles

- Cars and other vehicles available in Rock Spring in renter-occupied apartments
- 16no vehicle
- 891 vehicle
- 892 vehicles
- 143 vehicles
- 34 vehicles
- 05+ vehicles

- Rooms in owner-occupied houses in Rock Spring, Georgia
- 01 room
- 02 rooms
- 183 rooms
- 1074 rooms
- 4075 rooms
- 4766 rooms
- 2277 rooms
- 1138 rooms
- 589+ rooms

- Rooms in renter-occupied apartments in Rock Spring, Georgia
- 01 room
- 52 rooms
- 233 rooms
- 664 rooms
- 555 rooms
- 326 rooms
- 127 rooms
- 68 rooms
- 129+ rooms


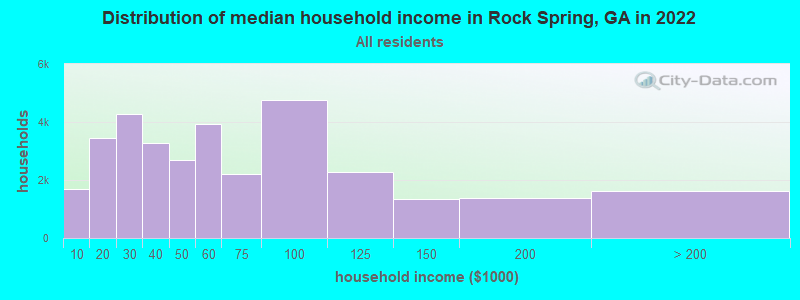
Rock Spring, GA household income distribution

- 1,678Less than $10,000
- 3,449$10,000 to $19,999
- 4,263$20,000 to $29,999
- 3,269$30,000 to $39,999
- 2,685$40,000 to $49,999
- 3,915$50,000 to $59,999
- 2,190$60,000 to $74,999
- 4,759$75,000 to $99,999
- 2,260$100,000 to $124,999
- 1,349$125,000 to $149,999
- 1,373$150,000 to $199,999
- 1,622$200,000 or more
Percentage of workers working in this county: 41.9%
Number of people working at home: 249 (10.5% of all workers)
Travel time to work (commute)
- Less than 5 minutes: 24
- 5 to 9 minutes: 133
- 10 to 14 minutes: 222
- 15 to 19 minutes: 296
- 20 to 24 minutes: 236
- 25 to 29 minutes: 97
- 30 to 34 minutes: 338
- 35 to 39 minutes: 71
- 40 to 44 minutes: 55
- 45 to 59 minutes: 321
- 60 to 89 minutes: 85
- 90 or more minutes: 73
Means of transportation to work:
- Drove a car alone: 1,654 (83.3%)
- Carpooled: 266 (13.4%)
- Bus or trolley bus: 4 (0.2%)
- Walked: 11 (0.6%)
- Other means: 16 (0.8%)
- Worked at home: 35 (1.8%)


- Year of entry for the foreign-born population in Rock Spring, Georgia
- 151995 to March 2000
- 151990 to 1994
- 01985 to 1989
- 141980 to 1984
- 01975 to 1979
- 01970 to 1974
- 01965 to 1969
- 0Before 1965
Most common places of birth for foreign-born residents (%):
| Rock Spring: | 34.1% (15) |
| Georgia: | 4.8% (27,834) |
| Rock Spring: | 20.5% (9) |
| Georgia: | 0.5% (3,064) |
| Rock Spring: | 20.5% (9) |
| Georgia: | 0.1% (504) |
| Rock Spring: | 13.6% (6) |
| Georgia: | 2.9% (16,457) |
| Rock Spring: | 11.4% (5) |
| Georgia: | 2.4% (14,026) |
Place of birth for U.S.-born residents:
- This state: 2,719
- Other state: 1,819
- Northeast: 62
- Midwest: 133
- South: 1,577
- West: 47
65% of Rock Spring residents lived in the same house 5 years ago.
Out of people who lived in different houses, 42% lived in this county.
Out of people who lived in different counties, 53% lived in Georgia.
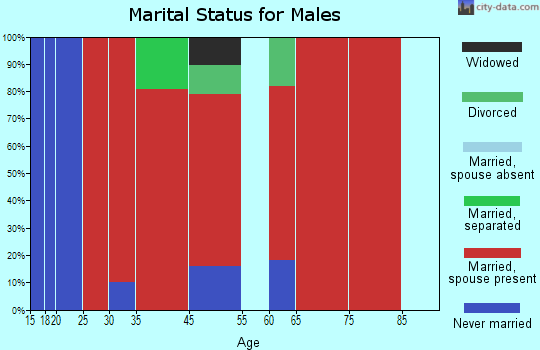
Education attainment for males 25 years and older:
- No schooling: 15
- Nursery to 4th grade: 16
- 5th and 6th grade: 37
- 7th and 8th grade: 104
- 9th grade: 89
- 10th grade: 106
- 11th grade: 80
- 12th grade, no diploma: 71
- High school graduate (or equivalency): 700
- Less than 1 year of college: 100
- Some college more than 1 year, no degree: 172
- Associate degree: 74
- Bachelor's degree: 126
- Master's degree: 40
- Professional school degree: 12
- Doctorate degree: 0

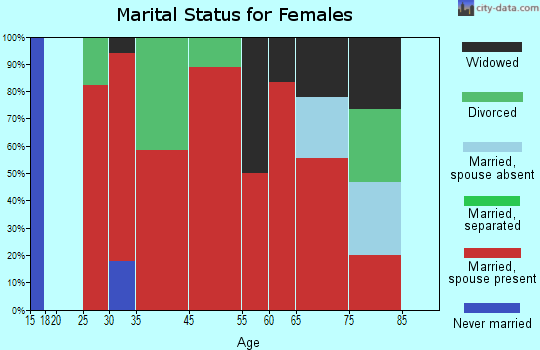
Education attainment for females 25 years and older:
- No schooling: 17
- Nursery to 4th grade: 6
- 5th and 6th grade: 41
- 7th and 8th grade: 99
- 9th grade: 59
- 10th grade: 139
- 11th grade: 43
- 12th grade, no diploma: 11
- High school graduate (or equivalency): 569
- Less than 1 year of college: 119
- Some college more than 1 year, no degree: 185
- Associate degree: 80
- Bachelor's degree: 109
- Master's degree: 44
- Professional school degree: 11
- Doctorate degree: 0

Housing units in structures:
- One, detached: 1,480
- Two: 5
- 3 or 4: 23
- 5 to 9: 5
- Mobile homes: 222
Median worth of mobile homes: $69,637
Housing units lacking complete kitchen facilities: 0.3%

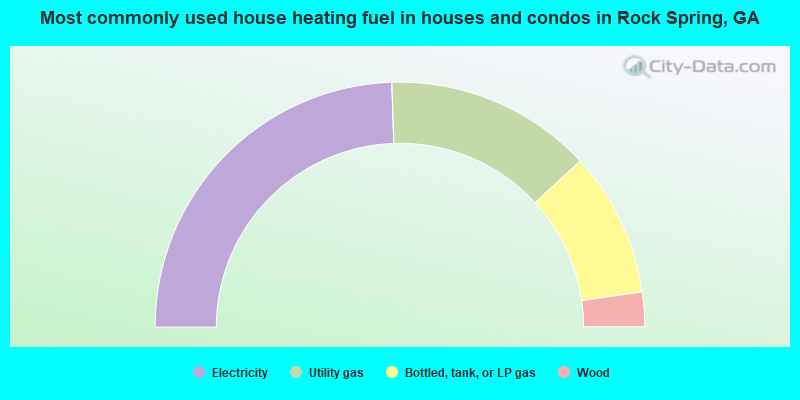
- 49.0%Electricity
- 27.4%Utility gas
- 19.1%Bottled, tank, or LP gas
- 4.6%Wood
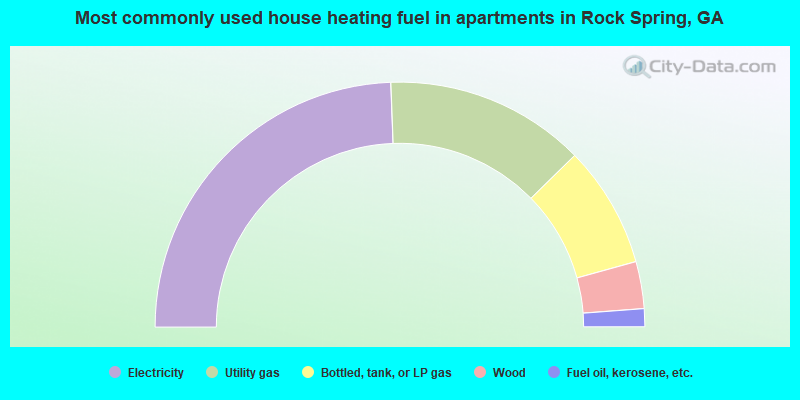
- 48.8%Electricity
- 26.5%Utility gas
- 16.1%Bottled, tank, or LP gas
- 6.2%Wood
- 2.4%Fuel oil, kerosene, etc.
Private vs. public school enrollment:
| Here: | 27.3% |
| Georgia: | 8.4% |
| Here: | 7.5% |
| Georgia: | 8.5% |
| Here: | 35.3% |
| Georgia: | 22.9% |


