Rome, GA (Georgia) Houses and Residents
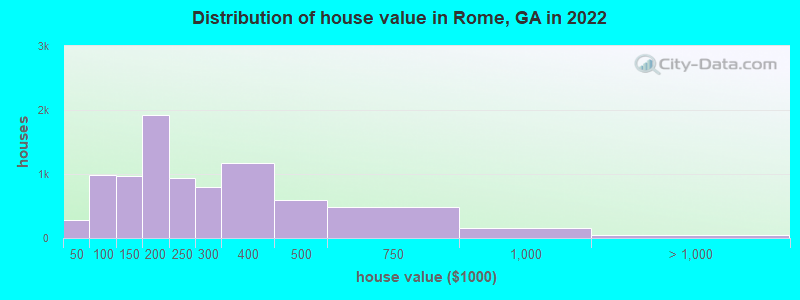
Estimated median house or condo value in 2022: $208,094 (it was $86,600 in 2000 )
Rome:
$208,094Georgia:
$297,400
Lower value quartile - upper value quartile: $147,351 - $342,194Mean price in 2022: Detached houses: $222,033 Here:
$222,033State:
$376,364
Townhouses or other attached units: $277,269 Here:
$277,269State:
$341,709
In 2-unit structures: $132,827 Here:
$132,827State:
$269,631
In 5-or-more-unit structures: $172,804 Here:
$172,804State:
$370,730
Mobile homes: $63,084 Here:
$63,084State:
$102,413
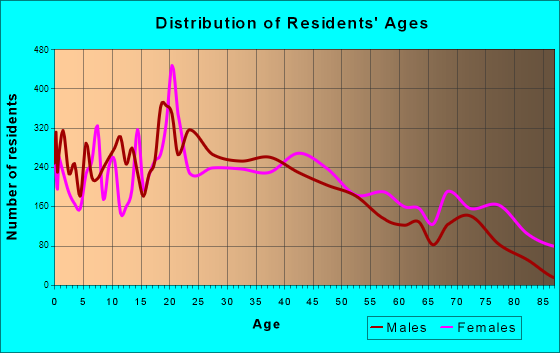
Total population: 35,997 (Urban population: 34,582, Rural population: 473 (all nonfarm) )
Houses: 16,394 (14,622 occupied: 7,807 owner occupied, 7,535 renter occupied )
% of renters here:
49%State:
34%
Housing density: 558 houses/condos per square mile
Median price asked for vacant for-sale houses and condos in 2022: $123,375.
Median contract rent in 2022: $708 (lower quartile is $481, upper quartile is $945)
Median rent asked for vacant for-rent units in 2022: $1,049
Median gross rent in Rome, GA in 2022: $919
Housing units in Rome with a mortgage: 4,713 (265 second mortgage, 0 home equity loan, 300 both second mortgage and home equity loan )Houses without a mortgage: 160
Median household income for houses/condos with a mortgage: $95,869
Median household income for apartments without a mortgage: $54,873
Median monthly housing costs: $970
Data:
Median house or condo value ($)
Median house or condo value ($ change since 2000)
Median house or condo value ($) - White
Median house or condo value ($) - Black or African American
Median house or condo value ($) - Asian
Median house or condo value ($) - Hispanic or Latino
Median house or condo value ($) - American Indian and Alaska Native
Median house or condo value ($) - Multirace
Median house or condo value ($) - Other Race
Median price asked for mobile homes ($)
Household density (households per square mile)
Mean house or condo value by units in structure - 1, detached ($)
Mean house or condo value by units in structure - 1, attached ($)
Mean house or condo value by units in structure - 2 ($)
Mean house or condo value by units in structure by units in structure - 3 or 4 ($)
Mean house or condo value by units in structure - 5 or more ($)
Mean house or condo value by units in structure - Boat, RV, van, etc. ($)
Mean house or condo value by units in structure - Mobile home ($)
Median contract rent ($)
Median contract rent - Lower quartile ($)
Median contract rent - Upper quartile ($)
Median gross rent ($)
Urban houses (%)
Rural houses (%)
Houses occupied (%)
Houses occupied (% change since 2000)
Houses owner occupied (%)
Houses owner occupied (% change since 2000)
Houses renter occupied (%)
Houses renter occupied (% change since 2000)
Vacant housing units - For rent (%)
Vacant housing units - For rent (% change since 2000)
Vacant housing units - For sale only (%)
Vacant housing units - For sale only (% change since 2000)
Vacant housing units - Rented or sold, not occupied (%)
Vacant housing units - Rented or sold, not occupied (% change since 2000)
Vacant housing units - For seasonal, recreational, or occasional use (%)
Vacant housing units - For seasonal, recreational, or occasional use (% change since 2000)
Vacant housing units - For migrant workers (%)
Vacant housing units - For migrant workers (% change since 2000)
Vacant housing units - Other vacant (%)
Vacant housing units - Other vacant (% change since 2000)
Median monthly housing costs ($)
Median household income for houses/condos with a mortgage ($)
Median household income for houses/condos without a mortgage ($)
Median household income ($)
Median household income ($) - White
Median household income ($) - Black or African American
Median household income ($) - Asian
Median household income ($) - Hispanic or Latino
Median household income ($) - American Indian and Alaska Native
Median household income ($) - Multirace
Median household income ($) - Other Race
Mortgage status - with mortgage (%)
Mortgage status - with second mortgage (%)
Mortgage status - with home equity loan (%)
Mortgage status - with both second mortgage and home equity loan (%)
Mortgage status - without a mortgage (%)
Median year house/condo built
Median year apartment built
Household type by relationship - Male householder living alone (%)
Household type by relationship - Male householder not living alone (%)
Household type by relationship - Female householder living alone (%)
Household type by relationship - Female householder not living alone (%)
Household type by relationship - Opposite-Sex spouse (%)
Household type by relationship - Same-Sex spouse (%)
Household type by relationship - Opposite-Sex unmarried partner (%)
Household type by relationship - Same-Sex unmarried partner (%)
Household type by relationship - In group quarters (%)
Size of family households - 2-person household (%)
Size of family households - 3-person household (%)
Size of family households - 4-person household (%)
Size of family households - 5-person household (%)
Size of family households - 6-person household (%)
Size of family households - 7-or-more-person household (%)
Size of nonfamily households - 1-person household (%)
Size of nonfamily households - 2-person household (%)
Size of nonfamily households - 3-person household (%)
Size of nonfamily households - 4-person household (%)
Size of nonfamily households - 5-person household (%)
Size of nonfamily households - 6-person household (%)
Size of nonfamily households - 7-or-moreperson household (%)
Year house built - Built 2010 or later (%)
Year house built - Built 2000 to 2009 (%)
Year house built - Built 1990 to 1999 (%)
Year house built - Built 1980 to 1989 (%)
Year house built - Built 1970 to 1979 (%)
Year house built - Built 1960 to 1969 (%)
Year house built - Built 1950 to 1959 (%)
Year house built - Built 1940 to 1949 (%)
Year house built - Built 1939 or earlier (%)
Median number of rooms in houses and condos
Median number of rooms in apartments
Median number of bedrooms in owner occupied houses
Mean number of bedrooms in owner occupied houses
Median number of bedrooms in renter occupied houses
Mean number of bedrooms in renter occupied houses
Median number of vehichles in owner occupied houses
Mean number of vehichles in owner occupied houses
Median number of vehichles in renter occupied houses
Mean number of vehichles in renter occupied houses
Rooms in owner-occupied houses - 1 room (%)
Rooms in owner-occupied houses - 2 rooms (%)
Rooms in owner-occupied houses - 3 rooms (%)
Rooms in owner-occupied houses - 4 rooms (%)
Rooms in owner-occupied houses - 5 rooms (%)
Rooms in owner-occupied houses - 6 rooms (%)
Rooms in owner-occupied houses - 7 rooms (%)
Rooms in owner-occupied houses - 8 rooms (%)
Rooms in owner-occupied houses - 9+ rooms (%)
Rooms in renter-occupied houses - 1 room (%)
Rooms in renter-occupied houses - 2 rooms (%)
Rooms in renter-occupied houses - 3 rooms (%)
Rooms in renter-occupied houses - 4 rooms (%)
Rooms in renter-occupied houses - 5 rooms (%)
Rooms in renter-occupied houses - 6 rooms (%)
Rooms in renter-occupied houses - 7 rooms (%)
Rooms in renter-occupied houses - 8 rooms (%)
Rooms in renter-occupied houses - 9+ rooms (%)
Bedrooms in owner-occupied houses - no bedrooms (%)
Bedrooms in owner-occupied houses - 1 bedroom (%)
Bedrooms in owner-occupied houses - 2 bedrooms (%)
Bedrooms in owner-occupied houses - 3 bedrooms (%)
Bedrooms in owner-occupied houses - 4 bedrooms (%)
Bedrooms in owner-occupied houses - 5+ bedrooms (%)
Bedrooms in renter-occupied houses - no bedrooms (%)
Bedrooms in renter-occupied houses - 1 bedroom (%)
Bedrooms in renter-occupied houses - 2 bedrooms (%)
Bedrooms in renter-occupied houses - 3 bedrooms (%)
Bedrooms in renter-occupied houses - 4 bedrooms (%)
Bedrooms in renter-occupied houses - 5+ bedrooms (%)
Vehicles available in owner-occupied houses - no vehicle available (%)
Vehicles available in owner-occupied houses - 1 vehicle available(%)
Vehicles available in owner-occupied houses - 2 Vehicles available (%)
Vehicles available in owner-occupied houses - 3 Vehicles available (%)
Vehicles available in owner-occupied houses - 4 Vehicles available (%)
Vehicles available in owner-occupied houses - 5+ Vehicles available (%)
Vehicles available in renter-occupied houses - no vehicle available (%)
Vehicles available in renter-occupied houses - 1 vehicle available (%)
Vehicles available in renter-occupied houses - 2 Vehicles available (%)
Vehicles available in renter-occupied houses - 3 Vehicles available (%)
Vehicles available in renter-occupied houses - 4 Vehicles available (%)
Vehicles available in renter-occupied houses - 5+ Vehicles available (%)
Housing units in structures - 1, detached (%)
Housing units in structures - 1, attached (%)
Housing units in structures - 2 (%)
Housing units in structures - 3 or 4 (%)
Housing units in structures - 5 to 9 (%)
Housing units in structures - 10 to 19 (%)
Housing units in structures - 20 to 49 (%)
Housing units in structures - 50 or more (%)
Housing units in structures - Mobile home (%)
Housing units in structures - Boat, RV, van, etc. (%)
Housing units in structures - Owners - 1, detached (%)
Housing units in structures - Owners - 1, attached (%)
Housing units in structures - Owners - 2 (%)
Housing units in structures - Owners - 3 or 4 (%)
Housing units in structures - Owners - 5 to 9 (%)
Housing units in structures - Owners - 10 to 19 (%)
Housing units in structures - Owners - 20 to 49 (%)
Housing units in structures - Owners - 50 or more (%)
Housing units in structures - Owners - Mobile home (%)
Housing units in structures - Owners - Boat, RV, van, etc. (%)
Housing units in structures - Renters - 1, detached (%)
Housing units in structures - Renters - 1, attached (%)
Housing units in structures - Renters - 2 (%)
Housing units in structures - Renters - 3 or 4 (%)
Housing units in structures - Renters - 5 to 9 (%)
Housing units in structures - Renters - 10 to 19 (%)
Housing units in structures - Renters - 20 to 49 (%)
Housing units in structures - Renters - 50 or more (%)
Housing units in structures - Renters - Mobile home (%)
Housing units in structures - Renters - Boat, RV, van, etc. (%)
House/condo owner moved in on average (years ago)
Renter moved in on average (years ago)
Year householder moved into unit - Moved in 1999 to March 2000 (%)
Year householder moved into unit - Moved in 1999 to March 2000 (%) - White
Year householder moved into unit - Moved in 1999 to March 2000 (%) - Black or African American
Year householder moved into unit - Moved in 1999 to March 2000 (%) - Asian
Year householder moved into unit - Moved in 1999 to March 2000 (%) - Hispanic or Latino
Year householder moved into unit - Moved in 1999 to March 2000 (%) - American Indian and Alaska Native
Year householder moved into unit - Moved in 1999 to March 2000 (%) - Multirace
Year householder moved into unit - Moved in 1999 to March 2000 (%) - Other Race
Year householder moved into unit - Moved in 1995 to 1998 (%)
Year householder moved into unit - Moved in 1995 to 1998 (%) - White
Year householder moved into unit - Moved in 1995 to 1998 (%) - Black or African American
Year householder moved into unit - Moved in 1995 to 1998 (%) - Asian
Year householder moved into unit - Moved in 1995 to 1998 (%) - Hispanic or Latino
Year householder moved into unit - Moved in 1995 to 1998 (%) - American Indian and Alaska Native
Year householder moved into unit - Moved in 1995 to 1998 (%) - Multirace
Year householder moved into unit - Moved in 1995 to 1998 (%) - Other Race
Year householder moved into unit - Moved in 1990 to 1994 (%)
Year householder moved into unit - Moved in 1990 to 1994 (%) - White
Year householder moved into unit - Moved in 1990 to 1994 (%) - Black or African American
Year householder moved into unit - Moved in 1990 to 1994 (%) - Asian
Year householder moved into unit - Moved in 1990 to 1994 (%) - Hispanic or Latino
Year householder moved into unit - Moved in 1990 to 1994 (%) - American Indian and Alaska Native
Year householder moved into unit - Moved in 1990 to 1994 (%) - Multirace
Year householder moved into unit - Moved in 1990 to 1994 (%) - Other Race
Year householder moved into unit - Moved in 1980 to 1989 (%)
Year householder moved into unit - Moved in 1980 to 1989 (%) - White
Year householder moved into unit - Moved in 1980 to 1989 (%) - Black or African American
Year householder moved into unit - Moved in 1980 to 1989 (%) - Asian
Year householder moved into unit - Moved in 1980 to 1989 (%) - Hispanic or Latino
Year householder moved into unit - Moved in 1980 to 1989 (%) - American Indian and Alaska Native
Year householder moved into unit - Moved in 1980 to 1989 (%) - Multirace
Year householder moved into unit - Moved in 1980 to 1989 (%) - Other Race
Year householder moved into unit - Moved in 1970 to 1979 (%)
Year householder moved into unit - Moved in 1970 to 1979 (%) - White
Year householder moved into unit - Moved in 1970 to 1979 (%) - Black or African American
Year householder moved into unit - Moved in 1970 to 1979 (%) - Asian
Year householder moved into unit - Moved in 1970 to 1979 (%) - Hispanic or Latino
Year householder moved into unit - Moved in 1970 to 1979 (%) - American Indian and Alaska Native
Year householder moved into unit - Moved in 1970 to 1979 (%) - Multirace
Year householder moved into unit - Moved in 1970 to 1979 (%) - Other Race
Year householder moved into unit - Moved in 1969 or earlier (%)
Year householder moved into unit - Moved in 1969 or earlier (%) - White
Year householder moved into unit - Moved in 1969 or earlier (%) - Black or African American
Year householder moved into unit - Moved in 1969 or earlier (%) - Asian
Year householder moved into unit - Moved in 1969 or earlier (%) - Hispanic or Latino
Year householder moved into unit - Moved in 1969 or earlier (%) - American Indian and Alaska Native
Year householder moved into unit - Moved in 1969 or earlier (%) - Multirace
Year householder moved into unit - Moved in 1969 or earlier (%) - Other Race
Housing units lacking complete plumbing facilities (%)
Housing units lacking complete kitchen facilities (%)
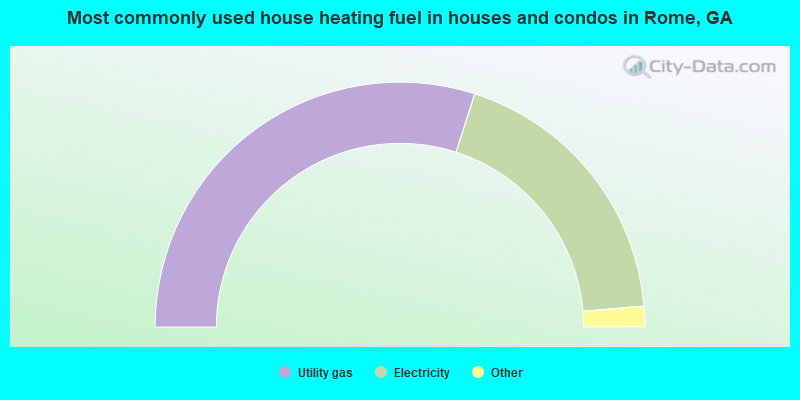
House heating fuel used in houses and condos - Utility gas (%)
House heating fuel used in houses and condos - Bottled, tank, or LP gas (%)
House heating fuel used in houses and condos - Electricity (%)
House heating fuel used in houses and condos - Fuel oil, kerosene, etc. (%)
House heating fuel used in houses and condos - Coal or coke (%)
House heating fuel used in houses and condos - Wood (%)
House heating fuel used in houses and condos - Solar energy (%)
House heating fuel used in houses and condos - Other fuel (%)
House heating fuel used in houses and condos - No fuel used (%)
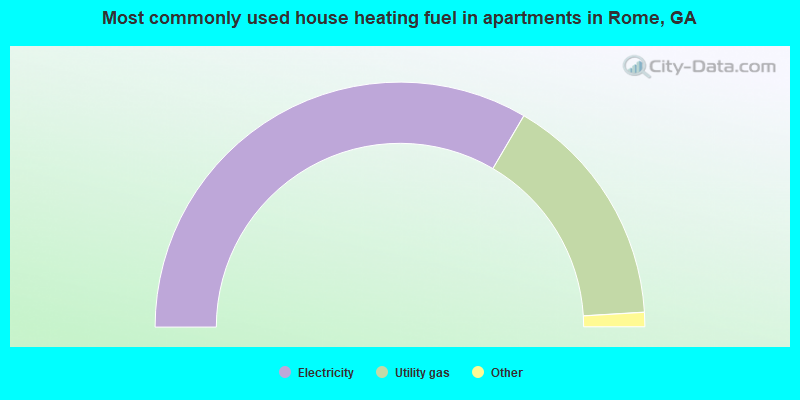
House heating fuel used in apartments - Utility gas (%)
House heating fuel used in apartments - Bottled, tank, or LP gas (%)
House heating fuel used in apartments - Electricity (%)
House heating fuel used in apartments - Fuel oil, kerosene, etc. (%)
House heating fuel used in apartments - Coal or coke (%)
House heating fuel used in apartments - Wood (%)
House heating fuel used in apartments - Solar energy (%)
House heating fuel used in apartments - Other fuel (%)
House heating fuel used in apartments - No fuel used (%)
Latest news about housing in Rome, GA collected exclusively by city-data.com from local newspapers, TV, and radio stations
Median year house/condo built: 1970Median year apartment built: 1979Household type by relationship:
Households: 37,965
Male householders: 6,517 (2,092 living alone ), Female householders: 8,116 (3,077 living alone )5,373 spouses (5,373 opposite-sex spouses ), 870 unmarried partners , (756 opposite-sex unmarried partners ), 12,463 children (12,085 natural , 163 adopted , 213 stepchildren ), 622 grandchildren , 634 brothers or sisters , 564 parents , 0 foster children , 458 other relatives , 776 non-relatives In group quarters: 1,568
Size of family households: 3,749 2-persons , 2,221 3-persons , 1,692 4-persons , 949 5-persons , 208 6-persons , 187 7-or-more-persons .
Size of nonfamily households: 5,409 1-person , 771 2-persons , 64 3-persons , 36 4-persons .
5,591 married couples with children. single-parent households (478 men , 2,557 women ).
80.2% of residents of Rome speak English at home. of residents speak Spanish at home (48% speak English very well , 20% speak English well , 17% speak English not well , 16% don't speak English at all ).of residents speak other Indo-European language at home (76% speak English very well , 21% speak English well , 3% speak English not well ).of residents speak Asian or Pacific Island language at home (46% speak English very well , 24% speak English well , 21% speak English not well , 8% don't speak English at all ).of residents speak other language at home (98% speak English very well , 1% speak English well , 1% don't speak English at all ).
Foreign born population: 5,135 (13.5%)of them are naturalized citizens )
Median number of rooms in houses and condos:
Median number of rooms in apartments
Owner-occupied Renter-occupied
Rooms in owner-occupied houses in Rome, Georgia
38 1 room 2 2 rooms 135 3 rooms 192 4 rooms 1,382 5 rooms 2,034 6 rooms 1,251 7 rooms 1,008 8 rooms 1,766 9+ rooms
Rooms in renter-occupied apartments in Rome, Georgia
609 1 room 561 2 rooms 1,158 3 rooms 1,959 4 rooms 1,654 5 rooms 843 6 rooms 346 7 rooms 336 8 rooms 70 9+ rooms
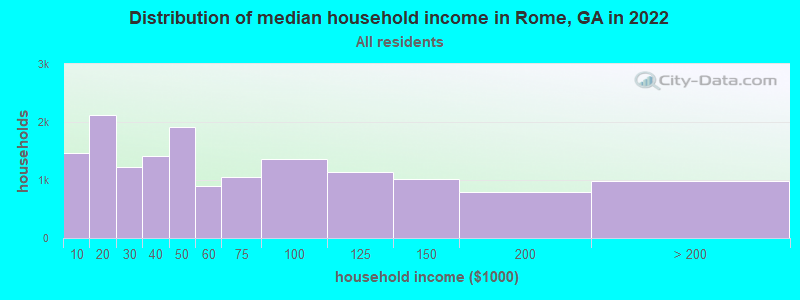
Rome, GA household income distribution 1,457 Less than $10,0002,127 $10,000 to $19,9991,222 $20,000 to $29,9991,418 $30,000 to $39,9991,907 $40,000 to $49,999902 $50,000 to $59,9991,057 $60,000 to $74,9991,367 $75,000 to $99,9991,133 $100,000 to $124,9991,017 $125,000 to $149,999794 $150,000 to $199,999980 $200,000 or more
Home value of owner - occupied houses in 2022 in Rome, GA 8 Less than $10,00060 $10,000 to $14,99941 $15,000 to $19,99929 $20,000 to $24,9999 $25,000 to $29,99950 $30,000 to $34,99913 $35,000 to $39,99966 $40,000 to $49,999158 $50,000 to $59,999143 $60,000 to $69,99955 $70,000 to $79,999124 $80,000 to $89,999440 $90,000 to $99,999508 $100,000 to $124,999454 $125,000 to $149,9991,235 $150,000 to $174,999688 $175,000 to $199,999930 $200,000 to $249,999793 $250,000 to $299,9991,174 $300,000 to $399,999594 $400,000 to $499,999485 $500,000 to $749,999159 $750,000 to $999,99914 $1,500,000 to $1,999,99934 $2,000,000 or moreRent paid by renters in 2022 in Rome, GA 243 Less than $10057 $100 to $149343 $150 to $19941 $200 to $249237 $250 to $299359 $300 to $349211 $350 to $399291 $400 to $449194 $450 to $499310 $500 to $549419 $550 to $599448 $600 to $649486 $650 to $699258 $700 to $749664 $750 to $799397 $800 to $899705 $900 to $999623 $1,000 to $1,249192 $1,250 to $1,499228 $1,500 to $1,9994 $2,000 to $2,49915 $2,500 to $2,9999 $3,000 to $3,49986 $3,500 or more243 No cash rent
Percentage of workers working in this county: 78.5%Number of people working at home: 1,363 (8.6% of all workers )
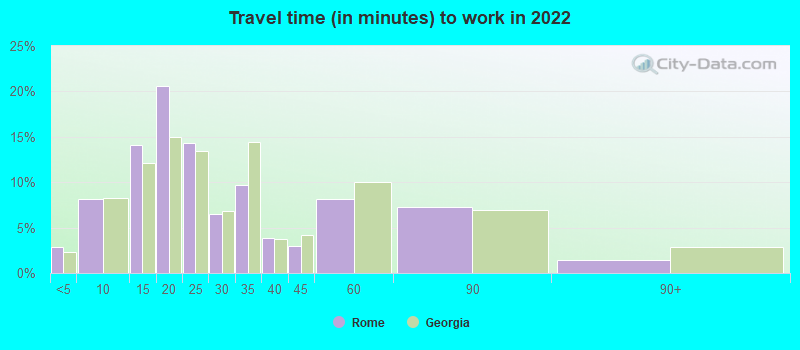
Travel time to work (commute)
Less than 5 minutes: 5685 to 9 minutes: 1,47310 to 14 minutes: 2,64915 to 19 minutes: 3,42420 to 24 minutes: 1,47225 to 29 minutes: 26230 to 34 minutes: 1,42035 to 39 minutes: 44240 to 44 minutes: 26245 to 59 minutes: 67160 to 89 minutes: 63090 or more minutes: 864
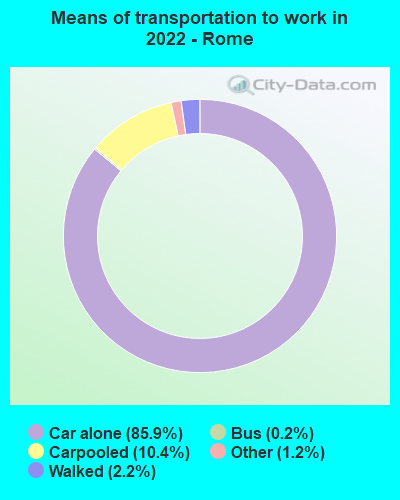
Means of transportation to work:
Drove a car alone: 24,551 (79.1%)Carpooled: 3,114 (10.0%)Bus : 49 (0.2%)Taxi: 377 (1.2%)Walked: 661 (2.1%)Worked at home: 1,363 (4.4%)
Unemployment by race in 2022
Unemployment rate for White non-Hispanic residents 4.9% Males1.9% FemalesUnemployment rate for Black residents 11.5% Males2.5% FemalesUnemployment rate for other race residents 0.9% FemalesUnemployment rate for two or more race residents 1.9% Males7.5% FemalesUnemployment rate for Hispanic or Latino residents 3.4% Males4.1% Females
Year of entry for the foreign-born population in Rome, Georgia
1,796 2010 or later 1,497 2000 to 2009 1,158 1990 to 1999 818 1980 to 1989 184 1970 to 1979 76 Before 1970
First ancestries reported:
American: 3,448 (14.2%)
English: 2,880 (11.9%)
Irish: 1,348 (5.6%)
German: 482 (2.0%)
Scotch-Irish: 241 (1.0%)
European: 222 (0.9%)
Italian: 205 (0.8%)
Scottish: 144 (0.6%)
Israeli: 136 (0.6%)
Palestinian: 93 (0.4%)
French: 80 (0.3%)
British: 69 (0.3%)
African: 65 (0.3%)
Northern European: 51 (0.2%)
Greek: 40 (0.2%)
Eastern European: 32 (0.1%)
Polish: 29 (0.1%)
Welsh: 28 (0.1%)
Dutch: 26 (0.1%)
Belgian: 19 (0.08%)
Scandinavian: 15 (0.06%)
Hungarian: 14 (0.06%)
Lebanese: 10 (0.04%)
Swedish: 10 (0.04%)
Brazilian: 8 (0.03%)
Croatian: 8 (0.03%)
Norwegian: 8 (0.03%)
Danish: 7 (0.03%)
Portuguese: 6 (0.02%)
Australian: 5 (0.02%) Most common places of birth for foreign-born residents (%): Guatemala Rome:
54.1% (2,629)Georgia:
3.6% (39,974)
Mexico Rome:
25.4% (1,231)Georgia:
20.0% (223,400)
India Rome:
7.8% (379)Georgia:
9.2% (103,325)
El Salvador Rome:
3.6% (175)Georgia:
2.5% (27,794)
Vietnam Rome:
3.1% (152)Georgia:
4.1% (45,797)
Korea Rome:
2.4% (117)Georgia:
3.9% (43,756)
Place of birth for U.S.-born residents:
This state: 24,988Other state: 7,733Northeast: 1,124Midwest: 1,446South: 4,094West: 1,077 84.5% of Rome residents lived in the same house 1 years ago.
Out of people who lived in different houses, 34.2% lived in this county.
Out of people who lived in different counties, 85.3% lived in Georgia.
Rome:
84.5%State average:
86.6%
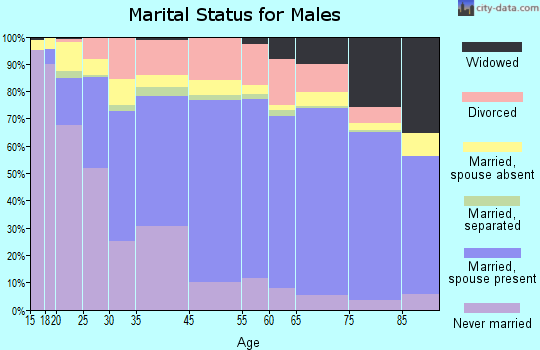
Education attainment for males 25 years and older:
No schooling: 364Nursery to 4th grade: 1415th and 6th grade: 1437th and 8th grade: 1469th grade: 13110th grade: 38511th grade: 26712th grade, no diploma: 665High school graduate (or equivalency): 3,898Less than 1 year of college: 490Some college more than 1 year, no degree: 1,164Associate degree: 613Bachelor's degree: 1,720Master's degree: 917Professional school degree: 244Doctorate degree: 202
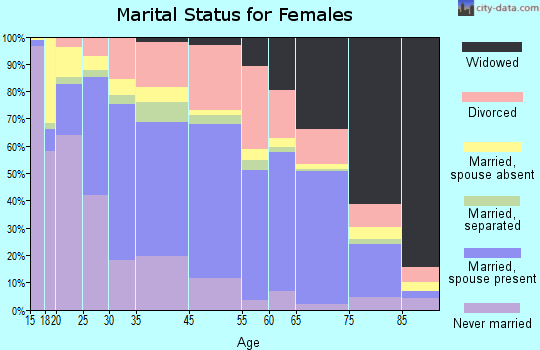
Education attainment for females 25 years and older:
No schooling: 528Nursery to 4th grade: 2135th and 6th grade: 3407th and 8th grade: 2359th grade: 26710th grade: 20011th grade: 60512th grade, no diploma: 343High school graduate (or equivalency): 3,166Less than 1 year of college: 847Some college more than 1 year, no degree: 1,820Associate degree: 1,217Bachelor's degree: 1,872Master's degree: 1,464Professional school degree: 388Doctorate degree: 191
Housing units in structures:
One, detached: 10,500One, attached: 432Two: 1,1963 or 4: 7555 to 9: 91310 to 19: 75920 to 49: 58850 or more: 1,156Mobile homes: 90Housing units lacking complete plumbing facilities in 2022: 2.7%Housing units lacking complete kitchen facilities in 2022: 6.1%House/condo owner moved in on average 11 years ago
Renter moved in on average 2 years ago
Private vs. public school enrollment:
Students in private schools in grades 1 to 8 (elementary and middle school): 601 Students in private schools in grades 9 to 12 (high school): 407 Students in private undergraduate colleges: 198