Rose Valley, WA (Washington) Houses and Residents
| Rose Valley: | $506,380 |
| Washington: | $569,500 |
Total population: 5,031 (Urban population: 18, Rural population: 4,646 (42 farm, 4,604 nonfarm))
Houses: 1,698 (1,642 occupied: 1,525 owner occupied, 117 renter occupied)
| % of renters here: | 7% |
| State: | 36% |
Housing density: 11 houses/condos per square mile
Median price asked for vacant for-sale houses and condos in 2022 in this county: $545,876.
Median contract rent in 2022: $1,418 (lower quartile is $1,065, upper quartile is $1,678)
Median rent asked for vacant for-rent units in 2022: $1,073
Median gross rent in Rose Valley, WA in 2022: $1,592
Housing units in Rose Valley with a mortgage: 790 (55 second mortgage, 129 home equity loan, 0 both second mortgage and home equity loan)
Houses without a mortgage: 205
Compare current foreclosures near Rose Valley, WA:
| Photo | Address | Area | Beds / Baths | Price | Details |
|---|---|---|---|---|---|

|
#1
Owens Rd
Silverlake, WA 98645
|
2,368 sq. feet
|
2 baths 3 beds |
show details | |

|
#2
Ocean Beach Hwy
Longview, WA 98632
|
- sq. feet
|
1 baths 3 beds |
show details | |

|
#3
Clark St
Kelso, WA 98626
|
- sq. feet
|
1 baths 2 beds |
show details | |

|
#4
Lomor Dr
Longview, WA 98632
|
1,504 sq. feet
|
2 baths 3 beds |
show details | |

|
#5
Allen Ave SE
Castle Rock, WA 98611
|
1,334 sq. feet
|
2 baths 3 beds |
show details | |

|
#6
Maple St
Longview, WA 98632
|
1,090 sq. feet
|
2 baths 3 beds |
show details | |

|
#7
Vermillion Rd
Kelso, WA 98626
|
1,948 sq. feet
|
2 baths 3 beds |
show details | |

|
#8
Alpha Dr
Longview, WA 98632
|
1,782 sq. feet
|
2 baths 3 beds |
show details | |

|
#9
Louise St
Kelso, WA 98626
|
1,830 sq. feet
|
2 baths 3 beds |
show details | |

|
#10
Cimerron St
Woodland, WA 98674
|
- sq. feet
|
2 baths 3 beds |
show details |
| Photo | Address | Area | Beds / Baths | Price | Details |
|---|---|---|---|---|---|

|
#11
Insel Rd
Woodland, WA 98674
|
1,056 sq. feet
|
2 baths 3 beds |
show details | |

|
#12
Hansen Rd
Kalama, WA 98625
|
1,656 sq. feet
|
2 baths 3 beds |
show details | |

|
#13
Sunset Pl
Longview, WA 98632
|
2,658 sq. feet
|
3 baths 4 beds |
show details | |

|
#14
Ocean Beach Hwy
Longview, WA 98632
|
1,200 sq. feet
|
1 baths 3 beds |
show details | |

|
#15
Coal Creek Rd
Longview, WA 98632
|
912 sq. feet
|
1 baths 2 beds |
show details | |

|
#16
Ph 10
Castle Rock, WA 98611
|
2,054 sq. feet
|
2 baths 3 beds |
show details | |

|
#17
Pine St
Longview, WA 98632
|
982 sq. feet
|
1 baths 4 beds |
show details | |

|
#18
Oregon Way
Longview, WA 98632
|
600 sq. feet
|
1 baths 2 beds |
show details | |

|
#19
Ocean Beach Hwy
Longview, WA 98632
|
3,155 sq. feet
|
3 baths 4 beds |
show details | |

|
#20
21st Ave
Longview, WA 98632
|
1,036 sq. feet
|
1 baths 3 beds |
show details |
| Photo | Address | Area | Beds / Baths | Price | Details |
|---|---|---|---|---|---|

|
#21
Spirit Lake Hwy
Castle Rock, WA 98611
|
1,620 sq. feet
|
2 baths 3 beds |
show details | |

|
#22
Dublin Dr
Castle Rock, WA 98611
|
1,770 sq. feet
|
2 baths 3 beds |
show details | |

|
#23
Dover St
Longview, WA 98632
|
948 sq. feet
|
1 baths 2 beds |
show details | |

|
#24
48th Ave
Longview, WA 98632
|
1,376 sq. feet
|
2 baths 3 beds |
show details | |

|
#25
Harrison Rd
Kelso, WA 98626
|
2,024 sq. feet
|
2 baths 2 beds |
show details | |

|
#26
Hazel Dell Rd
Castle Rock, WA 98611
|
1,100 sq. feet
|
1 baths 2 beds |
show details | |

|
#27
Terry Ave
Longview, WA 98632
|
2,056 sq. feet
|
2 baths 4 beds |
show details | |

|
#28
Cedar Dr
Rainier, OR 97048
|
2,000 sq. feet
|
2 baths 3 beds |
show details | |

|
#29
Fir St
Longview, WA 98632
|
1,426 sq. feet
|
1 baths 4 beds |
show details | |

|
#30
Maple St
Longview, WA 98632
|
1,414 sq. feet
|
2 baths 3 beds |
show details |
| Photo | Address | Area | Beds / Baths | Price | Details |
|---|---|---|---|---|---|

|
#31
Debast Rd
Rainier, OR 97048
|
1,752 sq. feet
|
1 baths 2 beds |
show details | |

|
#32
Dorothy St
Longview, WA 98632
|
1,655 sq. feet
|
2 baths 4 beds |
show details | |

|
#33
Studebaker Pl
Castle Rock, WA 98611
|
1,484 sq. feet
|
1 baths 3 beds |
show details | |

|
#34
Great Northern Rd
Kalama, WA 98625
|
2,010 sq. feet
|
2 baths 3 beds |
show details | |

|
#35
Clark Creek Rd
Longview, WA 98632
|
1,290 sq. feet
|
1 baths 3 beds |
show details | |

|
#36
Schaffran Rd
Castle Rock, WA 98611
|
1,394 sq. feet
|
2 baths 3 beds |
show details | |

|
#37
31st Ave
Longview, WA 98632
|
1,056 sq. feet
|
1 baths 3 beds |
show details | |

|
#38
Selix Ln
Longview, WA 98632
|
2,032 sq. feet
|
2 baths 4 beds |
show details | |

|
#39
16th Ave
Longview, WA 98632
|
1,406 sq. feet
|
1 baths 3 beds |
show details | |

|
#40
Stewart Creek Rd
Longview, WA 98632
|
1,278 sq. feet
|
1 baths 3 beds |
show details |
| Photo | Address | Area | Beds / Baths | Price | Details |
|---|---|---|---|---|---|

|
#41
Sunrise St
Kelso, WA 98626
|
2,592 sq. feet
|
1 baths 2 beds |
show details | |

|
#42
Ostrander Rd
Kelso, WA 98626
|
1,568 sq. feet
|
2 baths 3 beds |
show details | |

|
#43
N 3rd Ave
Kelso, WA 98626
|
740 sq. feet
|
1 baths 2 beds |
show details | |

|
#44
N 2nd Ave
Kelso, WA 98626
|
930 sq. feet
|
1 baths 2 beds |
show details | |

|
#45
Whitney Rd
Rainier, OR 97048
|
1,568 sq. feet
|
2 baths 3 beds |
show details | |

|
#46
Delena Mayger Rd
Clatskanie, OR 97016
|
1,725 sq. feet
|
2 baths 3 beds |
show details | |

|
#47
Clinton St
Kelso, WA 98626
|
984 sq. feet
|
1 baths 2 beds |
show details | |

|
#48
Victoria St
Longview, WA 98632
|
1,611 sq. feet
|
1 baths 3 beds |
show details | |

|
#49
Old Rainier Rd
Rainier, OR 97048
|
1,485 sq. feet
|
2 baths 2 beds |
show details | |

|
Check over 1 million property listings on Foreclosure.com!
|
browse all offers | |||

Household type by relationship:
Households: 101,203- In family households: 84,856 (19,630 male householders, 7,611 female householders)
20,196 spouses, 28,479 children (25,432 natural, 1,048 adopted, 1,999 stepchildren), 2,263 grandchildren, 761 brothers or sisters, 655 parents, foster children, 1,182 other relatives, 3,488 non-relatives
- In nonfamily households: 16,347 (6,347 male householders (4,789 living alone)), 6,656 female householders (5,610 living alone)), 3,344 nonrelatives
- In group quarters: 1,207 (892 institutionalized population)
15,948 married couples with children.
6,518 single-parent households (1,760 men, 4,758 women).
97.5% of residents of Rose Valley speak English at home.
1.4% of residents speak Spanish at home (72% speak English very well, 19% speak English well, 9% speak English not well).
0.8% of residents speak other Indo-European language at home (84% speak English very well, 16% speak English well).
0.2% of residents speak Asian or Pacific Island language at home (100% speak English well).
Foreign born population: 80 (1.4%)
(123.8% of them are naturalized citizens)
| Here: | 6.4 |
| State: | 6.5 |
| Here: | 5.8 |
| State: | 3.9 |

- Bedrooms in owner-occupied houses and condos in Rose Valley, Washington
- 0no bedroom
- 971 bedroom
- 1652 bedrooms
- 9613 bedrooms
- 2534 bedrooms
- 495+ bedrooms

- Bedrooms in renter-occupied apartments in Rose Valley, Washington
- 0no bedroom
- 121 bedroom
- 402 bedrooms
- 373 bedrooms
- 284 bedrooms
- 05+ bedrooms

- Cars and other vehicles available in Rose Valley in owner-occupied houses/condos
- 31no vehicle
- 1741 vehicle
- 6642 vehicles
- 4043 vehicles
- 1654 vehicles
- 875+ vehicles

- Cars and other vehicles available in Rose Valley in renter-occupied apartments
- 29no vehicle
- 131 vehicle
- 342 vehicles
- 333 vehicles
- 84 vehicles
- 05+ vehicles

- Rooms in owner-occupied houses in Rose Valley, Washington
- 01 room
- 562 rooms
- 493 rooms
- 764 rooms
- 1975 rooms
- 3746 rooms
- 3237 rooms
- 2458 rooms
- 2059+ rooms

- Rooms in renter-occupied apartments in Rose Valley, Washington
- 01 room
- 02 rooms
- 123 rooms
- 294 rooms
- 135 rooms
- 266 rooms
- 197 rooms
- 188 rooms
- 09+ rooms


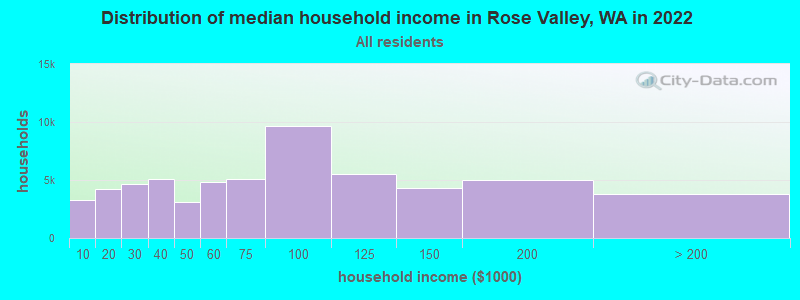
Rose Valley, WA household income distribution

- 3,240Less than $10,000
- 4,207$10,000 to $19,999
- 4,668$20,000 to $29,999
- 5,044$30,000 to $39,999
- 3,074$40,000 to $49,999
- 4,860$50,000 to $59,999
- 5,058$60,000 to $74,999
- 9,620$75,000 to $99,999
- 5,524$100,000 to $124,999
- 4,340$125,000 to $149,999
- 4,982$150,000 to $199,999
- 3,829$200,000 or more
Percentage of workers working in this county: 76.5%
Number of people working at home: 429 (15.8% of all workers)
Travel time to work (commute)
- Less than 5 minutes: 32
- 5 to 9 minutes: 81
- 10 to 14 minutes: 224
- 15 to 19 minutes: 702
- 20 to 24 minutes: 469
- 25 to 29 minutes: 108
- 30 to 34 minutes: 265
- 35 to 39 minutes: 56
- 40 to 44 minutes: 15
- 45 to 59 minutes: 86
- 60 to 89 minutes: 105
- 90 or more minutes: 41
Means of transportation to work:
- Drove a car alone: 1,912 (85.2%)
- Carpooled: 234 (10.4%)
- Bus or trolley bus: 7 (0.3%)
- Taxi: 6 (0.3%)
- Walked: 15 (0.7%)
- Other means: 10 (0.4%)
- Worked at home: 61 (2.7%)


- Year of entry for the foreign-born population in Rose Valley, Washington
- 01995 to March 2000
- 51990 to 1994
- 01985 to 1989
- 01980 to 1984
- 171975 to 1979
- 111970 to 1974
- 141965 to 1969
- 15Before 1965
Most common places of birth for foreign-born residents (%):
| Rose Valley: | 25.8% (16) |
| Washington: | 7.7% (47,568) |
| Rose Valley: | 16.1% (10) |
| Washington: | 0.5% (3,096) |
| Rose Valley: | 11.3% (7) |
| Washington: | 3.3% (20,321) |
| Rose Valley: | 11.3% (7) |
| Washington: | 24.1% (148,115) |
| Rose Valley: | 9.7% (6) |
| Washington: | 6.2% (38,172) |
| Rose Valley: | 9.7% (6) |
| Washington: | 0.3% (1,804) |
| Rose Valley: | 8.1% (5) |
| Washington: | 6.7% (40,879) |
| Rose Valley: | 8.1% (5) |
| Washington: | 0.1% (713) |
Place of birth for U.S.-born residents:
- This state: 2,934
- Other state: 1,643
- Northeast: 65
- Midwest: 388
- South: 201
- West: 989
64% of Rose Valley residents lived in the same house 5 years ago.
Out of people who lived in different houses, 76% lived in this county.
Out of people who lived in different counties, 47% lived in Washington.
Education attainment for males 25 years and older:
- No schooling: 0
- Nursery to 4th grade: 0
- 5th and 6th grade: 0
- 7th and 8th grade: 40
- 9th grade: 13
- 10th grade: 32
- 11th grade: 21
- 12th grade, no diploma: 56
- High school graduate (or equivalency): 536
- Less than 1 year of college: 164
- Some college more than 1 year, no degree: 314
- Associate degree: 153
- Bachelor's degree: 145
- Master's degree: 55
- Professional school degree: 25
- Doctorate degree: 14

Education attainment for females 25 years and older:
- No schooling: 0
- Nursery to 4th grade: 12
- 5th and 6th grade: 0
- 7th and 8th grade: 6
- 9th grade: 13
- 10th grade: 22
- 11th grade: 43
- 12th grade, no diploma: 43
- High school graduate (or equivalency): 517
- Less than 1 year of college: 298
- Some college more than 1 year, no degree: 276
- Associate degree: 108
- Bachelor's degree: 102
- Master's degree: 69
- Professional school degree: 31
- Doctorate degree: 0


Housing units in structures:
- One, detached: 1,260
- One, attached: 6
- Two: 5
- 3 or 4: 6
- Mobile homes: 409
- Boats, RVs, vans, etc.: 12
Median worth of mobile homes: $311,621
Housing units lacking complete kitchen facilities: 0.9%

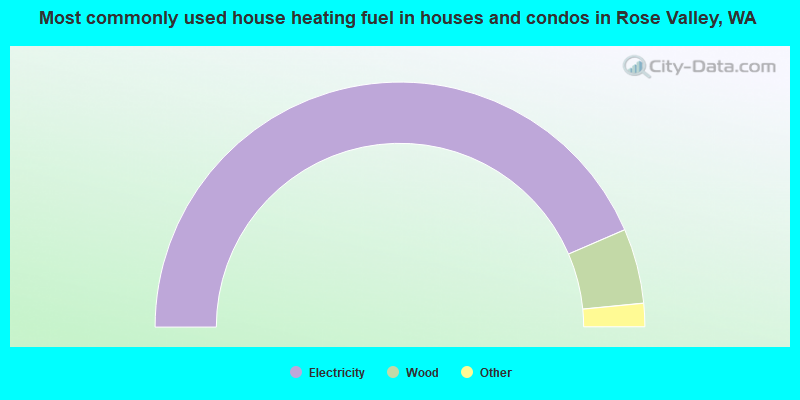
- 87.0%Electricity
- 9.9%Wood
- 1.8%Fuel oil, kerosene, etc.
- 1.2%Bottled, tank, or LP gas
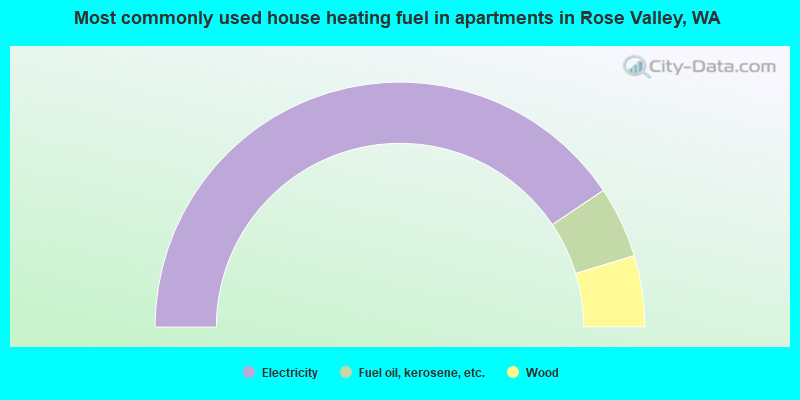
- 81.2%Electricity
- 9.4%Fuel oil, kerosene, etc.
- 9.4%Wood
Private vs. public school enrollment:
| Here: | 3.0% |
| Washington: | 9.2% |
| Here: | 3.0% |
| Washington: | 7.0% |
| Here: | 7.7% |
| Washington: | 15.7% |


