Rosemount, MN (Minnesota) Houses and Residents
| Rosemount: | $404,791 |
| Minnesota: | $314,600 |
Mean price in 2022:
Detached houses: $475,939
Here: $475,939 State: $374,552 Townhouses or other attached units: $304,594
Here: $304,594 State: $312,049 In 3-to-4-unit structures: $237,304
Here: $237,304 State: $238,971 In 5-or-more-unit structures: $197,364
Here: $197,364 State: $258,516 Mobile homes: $52,708
Here: $52,708 State: $94,605
Total population: 22,998 (Urban population: 13,742, Rural population: 873 (35 farm, 838 nonfarm))
Houses: 9,744 (9,503 occupied: 8,268 owner occupied, 1,272 renter occupied)
| % of renters here: | 13% |
| State: | 28% |
Housing density: 289 houses/condos per square mile
Median price asked for vacant for-sale houses and condos in 2022: $506,740.
Median contract rent in 2022: $1,400 (lower quartile is $1,015, upper quartile is $1,796)
Median rent asked for vacant for-rent units in 2022: $546
Median gross rent in Rosemount, MN in 2022: $1,572
Housing units in Rosemount with a mortgage: 5,708 (694 second mortgage, 32 home equity loan, 655 both second mortgage and home equity loan)
Houses without a mortgage: 87
Median household income for houses/condos with a mortgage: $157,609
Median household income for apartments without a mortgage: $96,876
Median monthly housing costs: $1,711
Compare current foreclosures in Rosemount, MN:
| Photo | Address | Area | Beds / Baths | Price | Details |
|---|---|---|---|---|---|

|
#1
Lower 161st St W
Rosemount, MN 55068
|
1,227 sq. feet
|
2 baths 4 beds |
show details | |

|
#2
Lower 147th St W
Rosemount, MN 55068
|
- sq. feet
|
2 baths 4 beds |
show details | |

|
#3
Frazer Way W
Rosemount, MN 55068
|
- sq. feet
|
2 baths 4 beds |
show details | |

|
#4
Boxwood Path
Rosemount, MN 55068
|
- sq. feet
|
3 baths 4 beds |
show details | |

|
#5
Cobbler Ave
Rosemount, MN 55068
|
- sq. feet
|
2 baths 4 beds |
show details | |

|
#6
154th St W
Rosemount, MN 55068
|
- sq. feet
|
2 baths 3 beds |
show details | |

|
#7
152nd Ct W
Rosemount, MN 55068
|
- sq. feet
|
2 baths 3 beds |
show details | |

|
#8
144th St W
Rosemount, MN 55068
|
- sq. feet
|
2 baths 5 beds |
show details | |

|
#9
158th St W
Rosemount, MN 55068
|
- sq. feet
|
2 baths 4 beds |
show details | |

|
#10
Azalea Ave
Rosemount, MN 55068
|
- sq. feet
|
3 baths 4 beds |
show details |
| Photo | Address | Area | Beds / Baths | Price | Details |
|---|---|---|---|---|---|

|
#11
Coleshire Path
Rosemount, MN 55068
|
- sq. feet
|
1 baths 2 beds |
show details | |

|
#12
Cimarron Way
Rosemount, MN 55068
|
- sq. feet
|
2 baths 3 beds |
show details | |

|
#13
Camero Ln
Rosemount, MN 55068
|
- sq. feet
|
2 baths 3 beds |
show details | |

|
#14
Claret Cir
Rosemount, MN 55068
|
- sq. feet
|
2 baths 3 beds |
show details | |

|
#15
133rd Ct W
Rosemount, MN 55068
|
- sq. feet
|
2 baths 4 beds |
show details | |

|
#16
133rd St W
Rosemount, MN 55068
|
- sq. feet
|
2 baths 3 beds |
show details | |

|
#17
Azalea Ave
Rosemount, MN 55068
|
- sq. feet
|
3 baths 4 beds |
show details | |

|
#18
Delft Ave W
Rosemount, MN 55068
|
- sq. feet
|
2 baths 3 beds |
show details | |

|
#19
Colorado Ave
Rosemount, MN 55068
|
- sq. feet
|
2 baths 4 beds |
show details | |

|
#20
S Robert Trl
Rosemount, MN 55068
|
- sq. feet
|
2 baths 4 beds |
show details |
| Photo | Address | Area | Beds / Baths | Price | Details |
|---|---|---|---|---|---|

|
#21
Bloomfield Path
Rosemount, MN 55068
|
- sq. feet
|
1 baths 2 beds |
show details | |

|
#22
Cobalt Ave
Rosemount, MN 55068
|
- sq. feet
|
1 baths 2 beds |
show details | |

|
#23
130th St W
Rosemount, MN 55068
|
- sq. feet
|
2 baths 5 beds |
show details | |

|
#24
Florida Way W
Rosemount, MN 55068
|
- sq. feet
|
1 baths 3 beds |
show details | |

|
#25
Cascade Path
Rosemount, MN 55068
|
- sq. feet
|
1 baths 3 beds |
show details | |

|
#26
Cornell Trl
Rosemount, MN 55068
|
- sq. feet
|
2 baths 2 beds |
show details | |

|
#27
Blackberry Way
Rosemount, MN 55068
|
- sq. feet
|
2 baths 4 beds |
show details | |

|
#28
Belfast St W
Rosemount, MN 55068
|
- sq. feet
|
2 baths 4 beds |
show details | |

|
#29
Galena Ave W
Rosemount, MN 55068
|
- sq. feet
|
2 baths 4 beds |
show details | |

|
#30
147th St W
Rosemount, MN 55068
|
- sq. feet
|
1 baths 3 beds |
show details |
| Photo | Address | Area | Beds / Baths | Price | Details |
|---|---|---|---|---|---|

|
#31
146th St W Apt 240
Rosemount, MN 55068
|
- sq. feet
|
- baths - beds |
show details | |

|
#32
Ashley Ct
Rosemount, MN 55068
|
- sq. feet
|
- baths - beds |
show details | |

|
#33
Bronze Pkwy
Rosemount, MN 55068
|
- sq. feet
|
- baths - beds |
show details | |

|
#34
Claret Ave W
Rosemount, MN 55068
|
- sq. feet
|
- baths - beds |
show details | |

|
#35
Caffrey Ave
Rosemount, MN 55068
|
- sq. feet
|
- baths - beds |
show details | |

|
#36
Alma Ave
Rosemount, MN 55068
|
- sq. feet
|
- baths - beds |
show details | |

|
#37
Apollo Ave
Rosemount, MN 55068
|
- sq. feet
|
- baths - beds |
show details | |

|
#38
145th St W # 113
Rosemount, MN 55068
|
- sq. feet
|
- baths - beds |
show details | |

|
#39
Shannon Pkwy Apt 608
Rosemount, MN 55068
|
- sq. feet
|
- baths - beds |
show details | |

|
#40
Upper 138th St W
Rosemount, MN 55068
|
- sq. feet
|
- baths - beds |
show details |
| Photo | Address | Area | Beds / Baths | Price | Details |
|---|---|---|---|---|---|

|
#41
146th St W Apt 332
Rosemount, MN 55068
|
- sq. feet
|
- baths - beds |
show details | |

|
#42
Aberdeen Way
Rosemount, MN 55068
|
- sq. feet
|
- baths - beds |
show details | |

|
Check over 1 million property listings on Foreclosure.com!
|
browse all offers | |||

Latest news about housing in Rosemount, MN collected exclusively by city-data.com from local newspapers, TV, and radio stations

 | Help with finding a rental home/area to live (7 replies) |
| New Homes in AppleVally/Rosemount (20 replies) |
| Rosemount or Lakeville? (31 replies) |
| Ultra-Early Stages of House-hunting: City vs. 'Burbs (37 replies) |
| House Hunting Next Week - Need Suburb Help (5 replies) |
| Appreciation for town homes in Rosemount? (14 replies) |

Median year apartment built: 2004
Household type by relationship:
Households: 26,239- Male householders: 4,718 (489 living alone), Female householders: 4,598 (1,000 living alone)
6,447 spouses (6,380 opposite-sex spouses), 469 unmarried partners, (427 opposite-sex unmarried partners), 9,068 children (8,648 natural, 190 adopted, 229 stepchildren), 274 grandchildren, 93 brothers or sisters, 77 parents, 6 foster children, 130 other relatives, 296 non-relatives
- In group quarters: 58
Size of family households: 3,271 2-persons, 1,605 3-persons, 1,863 4-persons, 647 5-persons, 185 6-persons, 12 7-or-more-persons.
Size of nonfamily households: 1,496 1-person, 356 2-persons, 25 3-persons, 11 5-persons.
5,938 married couples with children.
941 single-parent households (254 men, 687 women).
92.3% of residents of Rosemount speak English at home.
1.8% of residents speak Spanish at home (42% speak English very well, 40% speak English well, 18% speak English not well).
2.0% of residents speak other Indo-European language at home (68% speak English very well, 30% speak English well, 2% speak English not well).
1.7% of residents speak Asian or Pacific Island language at home (86% speak English very well, 13% speak English well, 1% speak English not well).
1.1% of residents speak other language at home (82% speak English very well, 14% speak English well, 4% speak English not well).
Foreign born population: 1,611 (6.1%)
(70.5% of them are naturalized citizens)
| Here: | 7.7 |
| State: | 7.1 |
| Here: | 4.2 |
| State: | 3.8 |

- Bedrooms in owner-occupied houses and condos in Rosemount, Minnesota
- 10no bedroom
- 381 bedroom
- 1,3062 bedrooms
- 2,9413 bedrooms
- 2,6174 bedrooms
- 1,3565+ bedrooms

- Bedrooms in renter-occupied apartments in Rosemount, Minnesota
- 86no bedroom
- 2491 bedroom
- 5272 bedrooms
- 2953 bedrooms
- 1164 bedrooms
- 05+ bedrooms

- Cars and other vehicles available in Rosemount in owner-occupied houses/condos
- 80no vehicle
- 1,3711 vehicle
- 4,5202 vehicles
- 1,6293 vehicles
- 4914 vehicles
- 1785+ vehicles

- Cars and other vehicles available in Rosemount in renter-occupied apartments
- 119no vehicle
- 4531 vehicle
- 6332 vehicles
- 483 vehicles
- 74 vehicles
- 135+ vehicles

- Rooms in owner-occupied houses in Rosemount, Minnesota
- 101 room
- 02 rooms
- 583 rooms
- 5204 rooms
- 7135 rooms
- 1,3706 rooms
- 1,2237 rooms
- 1,3218 rooms
- 3,0539+ rooms

- Rooms in renter-occupied apartments in Rosemount, Minnesota
- 861 room
- 322 rooms
- 1803 rooms
- 4324 rooms
- 1605 rooms
- 1846 rooms
- 857 rooms
- 278 rooms
- 879+ rooms


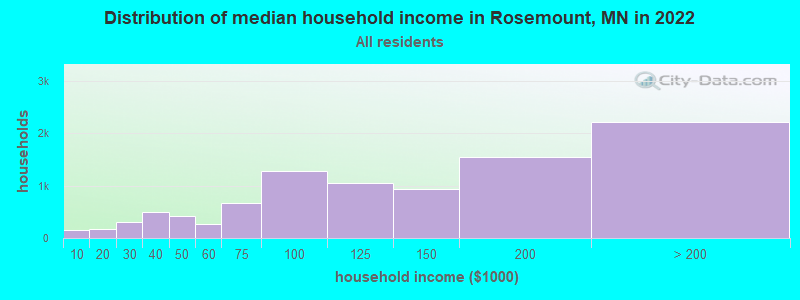
Rosemount, MN household income distribution

- 150Less than $10,000
- 171$10,000 to $19,999
- 312$20,000 to $29,999
- 505$30,000 to $39,999
- 430$40,000 to $49,999
- 262$50,000 to $59,999
- 668$60,000 to $74,999
- 1,275$75,000 to $99,999
- 1,060$100,000 to $124,999
- 936$125,000 to $149,999
- 1,543$150,000 to $199,999
- 2,219$200,000 or more
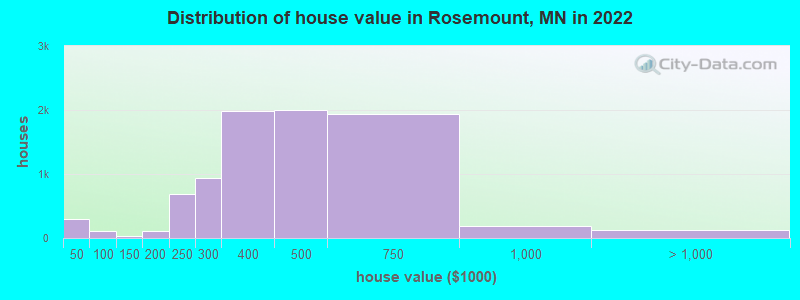
Home value of owner - occupied houses in 2022 in Rosemount, MN
-
- 12Less than $10,000
- 4$10,000 to $14,999
- 8$15,000 to $19,999
- 38$20,000 to $24,999
- 83$25,000 to $29,999
- 65$30,000 to $34,999
- 36$35,000 to $39,999
- 43$40,000 to $49,999
- 49$50,000 to $59,999
- 12$70,000 to $79,999
- 4$90,000 to $99,999
- 29$100,000 to $124,999
- 0$125,000 to $149,999
- 31$150,000 to $174,999
- 77$175,000 to $199,999
- 692$200,000 to $249,999
- 940$250,000 to $299,999
- 1,980$300,000 to $399,999
- 1,997$400,000 to $499,999
- 1,938$500,000 to $749,999
- 186$750,000 to $999,999
- 63$1,000,000 to $1,499,999
- 4$1,500,000 to $1,999,999
- 61$2,000,000 or more
Rent paid by renters in 2022 in Rosemount, MN
-
- 10$150 to $199
- 8$200 to $249
- 2$250 to $299
- 20$400 to $449
- 4$450 to $499
- 31$500 to $549
- 8$550 to $599
- 5$700 to $749
- 43$750 to $799
- 101$800 to $899
- 114$900 to $999
- 204$1,000 to $1,249
- 215$1,250 to $1,499
- 432$1,500 to $1,999
- 100$2,000 to $2,499
- 19$2,500 to $2,999
- 96No cash rent


Percentage of workers working in this county: 68.2%
Number of people working at home: 3,571 (24.8% of all workers)
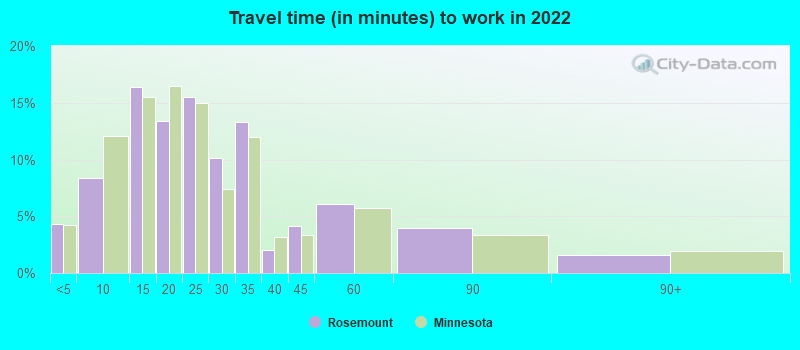
Travel time to work (commute)
- Less than 5 minutes: 539
- 5 to 9 minutes: 790
- 10 to 14 minutes: 1,305
- 15 to 19 minutes: 1,762
- 20 to 24 minutes: 1,433
- 25 to 29 minutes: 901
- 30 to 34 minutes: 1,743
- 35 to 39 minutes: 460
- 40 to 44 minutes: 739
- 45 to 59 minutes: 623
- 60 to 89 minutes: 221
- 90 or more minutes: 398
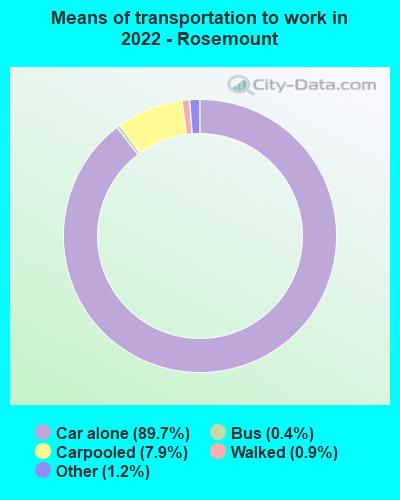
Means of transportation to work:
- Drove a car alone: 6,594 (61.0%)
- Carpooled: 675 (6.2%)
- Bus: 25 (0.2%)
- Taxi: 148 (1.4%)
- Walked: 62 (0.6%)
- Worked at home: 3,571 (33.0%)

- Unemployment by race in 2022
- Unemployment rate for White non-Hispanic residents
- 3.2%Males
- 1.7%Females
- Unemployment rate for Black residents
- 3.5%Females
- Unemployment rate for Asian residents
- 33.3%Males
- Unemployment rate for two or more race residents
- 1.8%Females
- Unemployment rate for Hispanic or Latino residents
- 16.0%Females

- Year of entry for the foreign-born population in Rosemount, Minnesota
- 4952010 or later
- 3732000 to 2009
- 3211990 to 1999
- 601980 to 1989
- 411970 to 1979
- 77Before 1970
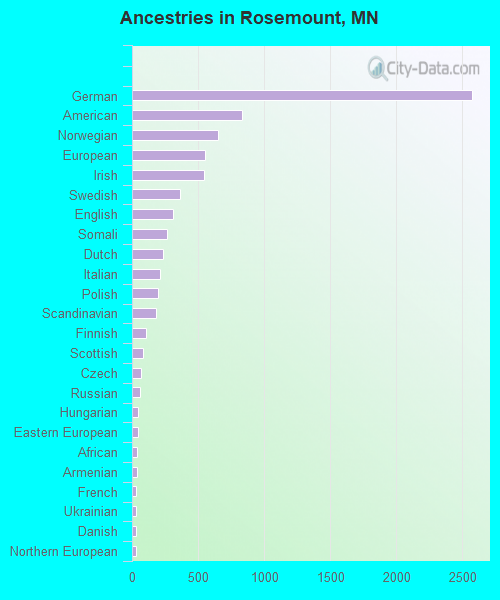
First ancestries reported:
- German: 2,573 (25.4%)
- American: 829 (8.2%)
- Norwegian: 652 (6.4%)
- European: 555 (5.5%)
- Irish: 542 (5.3%)
- Swedish: 365 (3.6%)
- English: 310 (3.1%)
- Somali: 264 (2.6%)
- Dutch: 233 (2.3%)
- Italian: 209 (2.1%)
- Polish: 199 (2.0%)
- Scandinavian: 182 (1.8%)
- Finnish: 105 (1.0%)
- Scottish: 81 (0.8%)
- Czech: 65 (0.6%)
- Russian: 62 (0.6%)
- Hungarian: 46 (0.5%)
- Eastern European: 42 (0.4%)
- African: 41 (0.4%)
- Armenian: 35 (0.3%)
- French: 34 (0.3%)
- Ukrainian: 34 (0.3%)
- Danish: 28 (0.3%)
- Northern European: 27 (0.3%)
- British: 21 (0.2%)
- Brazilian: 20 (0.2%)
- Palestinian: 19 (0.2%)
- Jamaican: 17 (0.2%)
- Welsh: 17 (0.2%)
- Iranian: 15 (0.1%)
- Scotch-Irish: 14 (0.1%)
- Nigerian: 14 (0.1%)
- Czechoslovakian: 14 (0.1%)
- Kenyan: 13 (0.1%)
- Canadian: 11 (0.1%)
- Slavic: 10 (0.10%)
- Greek: 9 (0.09%)
- Slovak: 7 (0.07%)
- Australian: 7 (0.07%)
- Belgian: 5 (0.05%)
- Slovene: 4 (0.04%)
- Austrian: 4 (0.04%)
Most common places of birth for foreign-born residents (%):
| Rosemount: | 10.5% (164) |
| Minnesota: | 2.4% (11,675) |
| Rosemount: | 9.4% (147) |
| Minnesota: | 0.7% (3,598) |
| Rosemount: | 8.9% (140) |
| Minnesota: | 1.4% (6,841) |
| Rosemount: | 8.4% (132) |
| Minnesota: | 0.6% (3,038) |
| Rosemount: | 7.1% (112) |
| Minnesota: | 2.0% (9,850) |
| Rosemount: | 7.1% (111) |
| Minnesota: | 12.1% (58,312) |
| Rosemount: | 5.6% (88) |
| Minnesota: | 0.6% (3,113) |
| Rosemount: | 4.3% (68) |
| Minnesota: | 8.0% (38,461) |
| Rosemount: | 3.9% (61) |
| Minnesota: | 6.7% (32,141) |
| Rosemount: | 3.6% (57) |
| Minnesota: | 1.3% (6,329) |
| Rosemount: | 3.2% (50) |
| Minnesota: | 0.2% (902) |
| Rosemount: | 3.1% (49) |
| Minnesota: | 3.8% (18,442) |
| Rosemount: | 2.3% (36) |
| Minnesota: | 3.6% (17,119) |
| Rosemount: | 2.2% (35) |
| Minnesota: | 0.6% (2,729) |
| Rosemount: | 2.2% (34) |
| Minnesota: | 2.5% (11,939) |
| Rosemount: | 1.8% (29) |
| Minnesota: | 3.3% (15,701) |
| Rosemount: | 1.7% (26) |
| Minnesota: | 0.8% (3,651) |
Place of birth for U.S.-born residents:
- This state: 17,732
- Other state: 6,511
- Northeast: 403
- Midwest: 3,960
- South: 1,139
- West: 1,018
90.4% of Rosemount residents lived in the same house 1 years ago.
Out of people who lived in different houses, 34.3% lived in this county.
Out of people who lived in different counties, 50.7% lived in Minnesota.
| Rosemount: | 90.4% |
| State average: | 87.4% |
Education attainment for males 25 years and older:
- No schooling: 33
- Nursery to 4th grade: 16
- 5th and 6th grade: 0
- 7th and 8th grade: 37
- 9th grade: 7
- 10th grade: 13
- 11th grade: 16
- 12th grade, no diploma: 43
- High school graduate (or equivalency): 1,285
- Less than 1 year of college: 597
- Some college more than 1 year, no degree: 1,144
- Associate degree: 915
- Bachelor's degree: 3,063
- Master's degree: 997
- Professional school degree: 233
- Doctorate degree: 69

Education attainment for females 25 years and older:
- No schooling: 68
- Nursery to 4th grade: 0
- 5th and 6th grade: 5
- 7th and 8th grade: 31
- 9th grade: 0
- 10th grade: 4
- 11th grade: 100
- 12th grade, no diploma: 17
- High school graduate (or equivalency): 1,375
- Less than 1 year of college: 534
- Some college more than 1 year, no degree: 983
- Associate degree: 1,032
- Bachelor's degree: 3,048
- Master's degree: 1,283
- Professional school degree: 167
- Doctorate degree: 168


Housing units in structures:
- One, detached: 6,468
- One, attached: 2,083
- Two: 35
- 3 or 4: 77
- 5 to 9: 168
- 10 to 19: 131
- 20 to 49: 198
- 50 or more: 355
- Mobile homes: 212
- Boats, RVs, vans, etc.: 13
Median worth of mobile homes: $34,453
Housing units lacking complete kitchen facilities in 2022: 0.5%
House/condo owner moved in on average 10 years ago
Renter moved in on average 4 years ago

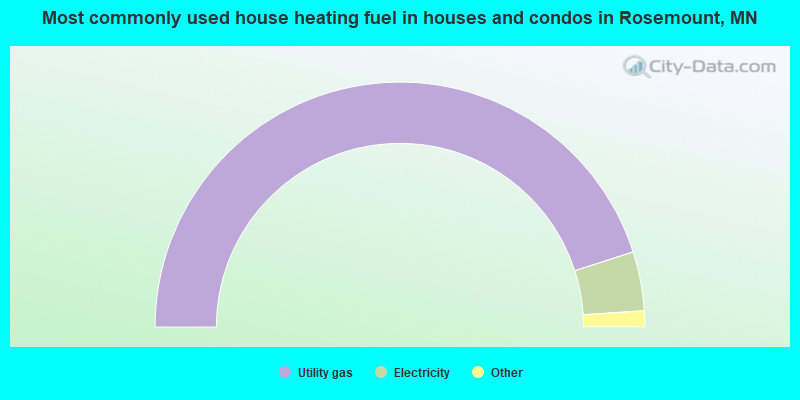
- 90.0%Utility gas
- 7.8%Electricity
- 1.6%Bottled, tank, or LP gas
- 0.5%Fuel oil, kerosene, etc.
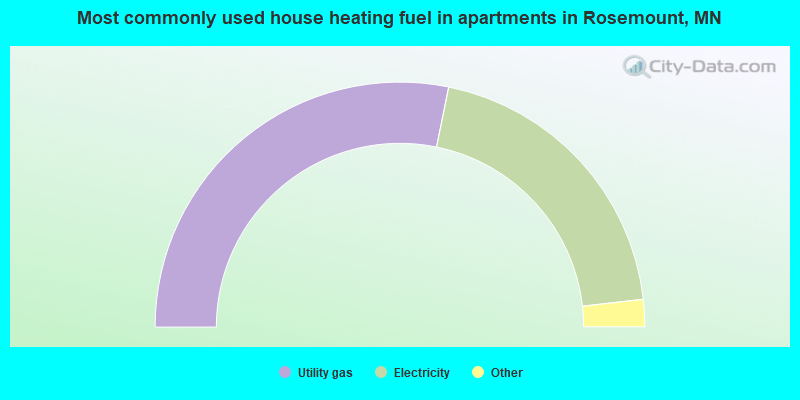
- 56.4%Utility gas
- 40.0%Electricity
- 1.6%No fuel used
- 1.1%Coal or coke
- 0.9%Wood
Private vs. public school enrollment:
| Here: | 6.4% |
| Minnesota: | 12.9% |
| Here: | 4.8% |
| Minnesota: | 8.6% |
| Here: | 17.9% |
| Minnesota: | 26.2% |


