Jump to a detailed profile or search site with Google Custom Search

Roseville, CA (California) Houses and Residents

Estimated median house or condo value in 2022: $650,600 (it was $192,300 in 2000)
Roseville:

$650,600
California:

$715,900
Lower value quartile - upper value quartile: $520,200 - $810,600

Mean price in 2022:

Detached houses: $673,465
Here:

$673,465
State:

$988,808

Townhouses or other attached units: $435,836
Here:

$435,836
State:

$838,546

In 2-unit structures: $335,742
Here:

$335,742
State:

$1,138,100

In 3-to-4-unit structures: $424,943
Here:

$424,943
State:

$824,253

In 5-or-more-unit structures: $649,050
Here:

$649,050
State:

$730,996

Mobile homes: $233,940
Here:

$233,940
State:

$184,506

Total population: 128,615 (Urban population: 79,766, Rural population: 326 (all nonfarm))

Houses: 63,743 (60,918 occupied: 41,701 owner occupied, 19,217 renter occupied)

% of renters here:

32%
State:

44%

Housing density: 2,092 houses/condos per square mile

Median price asked for vacant for-sale houses and condos in 2022: $823,645.

Median contract rent in 2022: $1,946 (lower quartile is $1,388, upper quartile is over $2,000)


Median rent asked for vacant for-rent units in 2022: $5,501


Median gross rent in Roseville, CA in 2022: over $2,000

Housing units in Roseville with a mortgage: 30,086 (2,646 second mortgage, 90 home equity loan, 2,408 both second mortgage and home equity loan)
Houses without a mortgage: 301

Median household income for houses/condos with a mortgage: $128,462

Median household income for apartments without a mortgage: $82,524

Median monthly housing costs: $2,050

Compare current foreclosures in Roseville, CA:

Check out more offers in Roseville, CA.
Powered by Foreclosure.com

Settings
X
Data:
Loading data...
Based on 2000-2022 data
Loading data...

123
Hide US histogram

Latest news about housing in Roseville, CA collected exclusively by city-data.com from local newspapers, TV, and radio stations

Roseville, California Age and Sex of Residents
Median year house/condo built: 1998

Median year apartment built: 1997

Household type by relationship:

Households: 154,826
  • Male householders: 29,876 (6,631 living alone), Female householders: 31,042 (9,758 living alone)
  • 31,853 spouses (31,632 opposite-sex spouses), 4,070 unmarried partners, (3,922 opposite-sex unmarried partners), 42,838 children (40,978 natural, 904 adopted, 956 stepchildren), 2,504 grandchildren, 2,093 brothers or sisters, 2,292 parents, 38 foster children, 2,249 other relatives, 4,205 non-relatives
  • In group quarters: 1,766

Size of family households: 17,215 2-persons, 10,312 3-persons, 7,743 4-persons, 4,038 5-persons, 1,321 6-persons, 236 7-or-more-persons.

Size of nonfamily households: 16,389 1-person, 2,634 2-persons, 839 3-persons, 82 4-persons, 109 5-persons.

23,440 married couples with children.
5,573 single-parent households (2,097 men, 3,476 women).

80.8% of residents of Roseville speak English at home.
5.7% of residents speak Spanish at home (68% speak English very well, 22% speak English well, 7% speak English not well, 3% don't speak English at all).
6.4% of residents speak other Indo-European language at home (67% speak English very well, 18% speak English well, 9% speak English not well, 5% don't speak English at all).
6.6% of residents speak Asian or Pacific Island language at home (65% speak English very well, 26% speak English well, 8% speak English not well, 1% don't speak English at all).
0.7% of residents speak other language at home (81% speak English very well, 15% speak English well, 3% speak English not well).

Foreign born population: 23,218 (15.0%)
(71.1% of them are naturalized citizens)

Median number of rooms in houses and condos:
Here:

6.6
State:

6.0

Median number of rooms in apartments
Here:

4.1
State:

3.9

Owner-occupied Renter-occupied
Bedrooms in owner-occupied houses and condos in Roseville, California
  • Bedrooms in owner-occupied houses and condos in Roseville, California
  • 73no bedroom
  • 2051 bedroom
  • 4,8202 bedrooms
  • 17,0993 bedrooms
  • 14,7684 bedrooms
  • 4,7365+ bedrooms
Bedrooms in renter-occupied apartments in Roseville, California
  • Bedrooms in renter-occupied apartments in Roseville, California
  • 849no bedroom
  • 4,7401 bedroom
  • 6,8352 bedrooms
  • 4,3533 bedrooms
  • 1,8074 bedrooms
  • 6335+ bedrooms
Owner-occupied Renter-occupied
Cars and other vehicles available in Roseville in owner-occupied houses/condos
  • Cars and other vehicles available in Roseville in owner-occupied houses/condos
  • 1,039no vehicle
  • 11,1241 vehicle
  • 18,3052 vehicles
  • 8,1063 vehicles
  • 1,9804 vehicles
  • 1,1475+ vehicles
Cars and other vehicles available in Roseville in renter-occupied apartments
  • Cars and other vehicles available in Roseville in renter-occupied apartments
  • 2,968no vehicle
  • 6,8331 vehicle
  • 6,6422 vehicles
  • 2,0423 vehicles
  • 5144 vehicles
  • 2185+ vehicles
Owner-occupied Renter-occupied
Rooms in owner-occupied houses in Roseville, California
  • Rooms in owner-occupied houses in Roseville, California
  • 731 room
  • 02 rooms
  • 5073 rooms
  • 3,9594 rooms
  • 6,1555 rooms
  • 9,7116 rooms
  • 7,4397 rooms
  • 6,3658 rooms
  • 7,4929+ rooms
Rooms in renter-occupied apartments in Roseville, California
  • Rooms in renter-occupied apartments in Roseville, California
  • 8491 room
  • 1,5102 rooms
  • 3,8733 rooms
  • 5,7164 rooms
  • 2,9815 rooms
  • 1,5796 rooms
  • 1,4457 rooms
  • 8298 rooms
  • 4359+ rooms
Year house built
Median 2022 house/condo value by year built
Median house/condo value by year householder moved into unit
Breakdown of mean house values by ages of householders
Owners and renters by unit type in Roseville, CA
  • Roseville, CA household income distribution

  • Distribution of median household income in Roseville, CA in 2022
  • 1,380Less than $10,000
  • 3,273$10,000 to $19,999
  • 2,518$20,000 to $29,999
  • 2,583$30,000 to $39,999
  • 3,212$40,000 to $49,999
  • 3,206$50,000 to $59,999
  • 5,686$60,000 to $74,999
  • 8,332$75,000 to $99,999
  • 7,298$100,000 to $124,999
  • 4,464$125,000 to $149,999
  • 8,557$150,000 to $199,999
  • 10,409$200,000 or more
  • Home value of owner - occupied houses in 2022 in Roseville, CA

  • Distribution of house value in Roseville, CA in 2022
  • 198Less than $10,000
  • 13$10,000 to $14,999
  • 9$15,000 to $19,999
  • 23$25,000 to $29,999
  • 5$30,000 to $34,999
  • 36$35,000 to $39,999
  • 43$40,000 to $49,999
  • 66$50,000 to $59,999
  • 125$60,000 to $69,999
  • 73$70,000 to $79,999
  • 26$80,000 to $89,999
  • 66$90,000 to $99,999
  • 250$100,000 to $124,999
  • 41$125,000 to $149,999
  • 334$150,000 to $174,999
  • 142$175,000 to $199,999
  • 273$200,000 to $249,999
  • 220$250,000 to $299,999
  • 1,452$300,000 to $399,999
  • 4,683$400,000 to $499,999
  • 20,234$500,000 to $749,999
  • 8,298$750,000 to $999,999
  • 1,191$1,000,000 to $1,499,999
  • 44$1,500,000 to $1,999,999
  • 260$2,000,000 or more
  • Rent paid by renters in 2022 in Roseville, CA

  • Distribution of rent paid by renters in Roseville, CA in 2022
  • 11Less than $100
  • 33$100 to $149
  • 42$200 to $249
  • 70$250 to $299
  • 76$300 to $349
  • 104$350 to $399
  • 102$400 to $449
  • 31$450 to $499
  • 32$500 to $549
  • 74$550 to $599
  • 53$600 to $649
  • 19$650 to $699
  • 49$700 to $749
  • 176$750 to $799
  • 222$800 to $899
  • 842$900 to $999
  • 2,001$1,000 to $1,249
  • 2,056$1,250 to $1,499
  • 4,725$1,500 to $1,999
  • 4,527$2,000 to $2,499
  • 1,302$2,500 to $2,999
  • 1,249$3,000 to $3,499
  • 531$3,500 or more
  • 268No cash rent
Time Leaving Home To Go To Work in 2022

Percentage of workers working in this county: 64.5%
Number of people working at home: 17,225 (22.7% of all workers)

Travel time (in minutes) to work in 2022

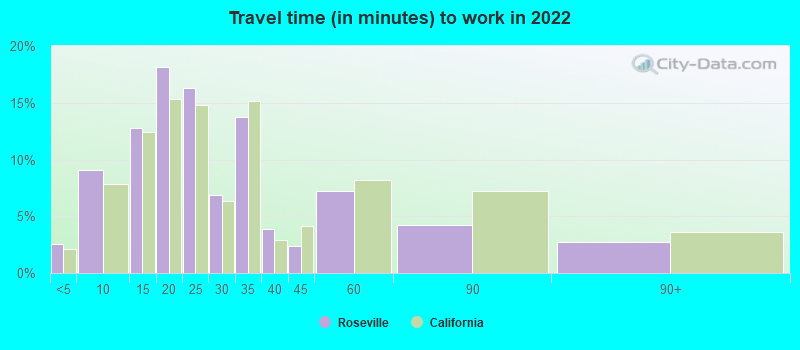
Travel time to work (commute)

  • Less than 5 minutes: 941
  • 5 to 9 minutes: 6,341
  • 10 to 14 minutes: 6,409
  • 15 to 19 minutes: 9,261
  • 20 to 24 minutes: 7,414
  • 25 to 29 minutes: 3,439
  • 30 to 34 minutes: 9,832
  • 35 to 39 minutes: 1,543
  • 40 to 44 minutes: 3,023
  • 45 to 59 minutes: 5,455
  • 60 to 89 minutes: 2,342
  • 90 or more minutes: 2,667
Means of transportation to work in 2022 - Roseville

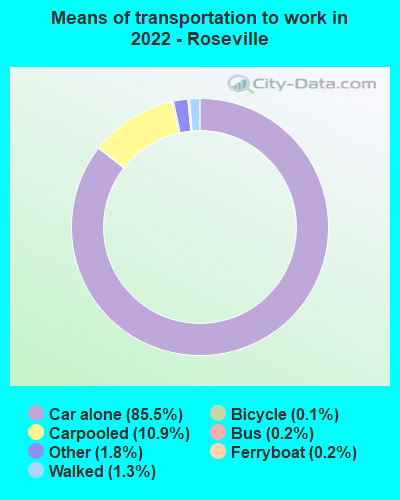
Means of transportation to work:

  • Drove a car alone: 69,452 (71.8%)
  • Carpooled: 8,864 (9.2%)
  • Bus: 163 (0.2%)
  • Ferryboat: 163 (0.2%)
  • Taxi: 1,442 (1.5%)
  • Bicycle: 105 (0.1%)
  • Walked: 1,046 (1.1%)
  • Worked at home: 15,491 (16.0%)
Class of Workers in 2022
  • Unemployment by race in 2022
  • Unemployment rate for White non-Hispanic residents
  • 5.1%Males
  • 3.2%Females
  • Unemployment rate for Black residents
  • 7.3%Males
  • 2.0%Females
  • Unemployment rate for American Indian and Alaska Native residents
  • 4.2%Males
  • 5.1%Females
  • Unemployment rate for Asian residents
  • 1.0%Males
  • 6.7%Females
  • Unemployment rate for other race residents
  • 2.5%Males
  • 2.9%Females
  • Unemployment rate for two or more race residents
  • 1.6%Males
  • 5.0%Females
  • Unemployment rate for Hispanic or Latino residents
  • 7.0%Females
Year of entry for the foreign-born population in Roseville, California
  • Year of entry for the foreign-born population in Roseville, California
  • 5,4052010 or later
  • 5,4242000 to 2009
  • 5,0081990 to 1999
  • 1,6541980 to 1989
  • 9021970 to 1979
  • 1,995Before 1970
Ancestries in Roseville, CA

First ancestries reported:

  • English: 6,552 (8.8%)
  • German: 5,111 (6.9%)
  • American: 3,565 (4.8%)
  • Irish: 3,503 (4.7%)
  • Italian: 3,450 (4.6%)
  • European: 2,625 (3.5%)
  • Iranian: 1,504 (2.0%)
  • Ukrainian: 1,211 (1.6%)
  • Norwegian: 862 (1.2%)
  • Russian: 780 (1.1%)
  • Portuguese: 746 (1.0%)
  • Afghan: 666 (0.9%)
  • Scottish: 609 (0.8%)
  • Romanian: 439 (0.6%)
  • Swedish: 405 (0.5%)
  • French: 378 (0.5%)
  • Canadian: 362 (0.5%)
  • French Canadian: 346 (0.5%)
  • British: 334 (0.4%)
  • Polish: 314 (0.4%)
  • Dutch: 309 (0.4%)
  • Scandinavian: 308 (0.4%)
  • Greek: 297 (0.4%)
  • Scotch-Irish: 245 (0.3%)
  • African: 240 (0.3%)
  • Northern European: 217 (0.3%)
  • Palestinian: 215 (0.3%)
  • Eastern European: 181 (0.2%)
  • Danish: 155 (0.2%)
  • Armenian: 147 (0.2%)
  • South African: 143 (0.2%)
  • Egyptian: 137 (0.2%)
  • Czech: 129 (0.2%)
  • Croatian: 127 (0.2%)
  • Ethiopian: 97 (0.1%)
  • Welsh: 88 (0.1%)
  • Lebanese: 76 (0.1%)
  • Swiss: 71 (0.10%)
  • Belgian: 53 (0.07%)
  • Bulgarian: 50 (0.07%)
  • Arab: 49 (0.07%)
  • Syrian: 48 (0.06%)
  • Jamaican: 48 (0.06%)
  • Kenyan: 46 (0.06%)
  • Nigerian: 45 (0.06%)
  • Finnish: 45 (0.06%)
  • Austrian: 43 (0.06%)
  • Slovak: 41 (0.06%)
  • Brazilian: 38 (0.05%)
  • Basque: 37 (0.05%)
  • Cape Verdean: 36 (0.05%)
  • Hungarian: 36 (0.05%)
  • U.S. Virgin Islander: 35 (0.05%)
  • Yugoslavian: 30 (0.04%)
  • Slavic: 29 (0.04%)
  • Turkish: 26 (0.04%)
  • West Indian: 24 (0.03%)
  • Lithuanian: 23 (0.03%)
  • Australian: 20 (0.03%)
  • Czechoslovakian: 19 (0.03%)
  • Guyanese: 13 (0.02%)
  • Iraqi: 13 (0.02%)
  • Luxembourger: 10 (0.01%)
  • Assyrian: 8 (0.01%)

Most common places of birth for foreign-born residents (%):

Philippines
Roseville:

18.5% (4,057)
California:

7.8% (818,297)

India
Roseville:

12.7% (2,786)
California:

5.2% (539,184)

Mexico
Roseville:

9.7% (2,139)
California:

37.2% (3,881,193)

Iran
Roseville:

5.3% (1,162)
California:

2.0% (206,004)

Vietnam
Roseville:

4.2% (932)
California:

4.9% (512,335)

Afghanistan
Roseville:

3.9% (849)
California:

0.5% (53,260)

Canada
Roseville:

3.8% (831)
California:

1.2% (127,477)

Ukraine
Roseville:

3.5% (764)
California:

0.6% (60,761)

China, excluding Hong Kong and Taiwan
Roseville:

3.2% (697)
California:

6.6% (684,672)

Russia
Roseville:

2.7% (603)
California:

0.7% (71,932)

Korea
Roseville:

2.0% (446)
California:

3.0% (315,248)

Romania
Roseville:

1.6% (353)
California:

0.2% (23,058)

England
Roseville:

1.6% (351)
California:

0.6% (57,953)

Other Eastern Asia
Roseville:

1.5% (338)
California:

0.0% (5,043)

Place of birth for U.S.-born residents:

  • This state: 95,400
  • Other state: 31,800
  • Northeast: 5,111
  • Midwest: 8,980
  • South: 5,904
  • West: 11,805

88.3% of Roseville residents lived in the same house 1 years ago.
   Out of people who lived in different houses, 23.6% lived in this county.
   Out of people who lived in different counties, 87.5% lived in California.


Roseville:

88.3%
State average:

88.9%

Education attainment for males 25 years and older:

  • No schooling: 282
  • Nursery to 4th grade: 12
  • 5th and 6th grade: 397
  • 7th and 8th grade: 144
  • 9th grade: 88
  • 10th grade: 48
  • 11th grade: 645
  • 12th grade, no diploma: 530
  • High school graduate (or equivalency): 10,029
  • Less than 1 year of college: 3,557
  • Some college more than 1 year, no degree: 9,988
  • Associate degree: 6,248
  • Bachelor's degree: 13,874
  • Master's degree: 5,015
  • Professional school degree: 1,752
  • Doctorate degree: 830
Educational Attainment for Males

Education attainment for females 25 years and older:

  • No schooling: 563
  • Nursery to 4th grade: 342
  • 5th and 6th grade: 0
  • 7th and 8th grade: 343
  • 9th grade: 359
  • 10th grade: 599
  • 11th grade: 325
  • 12th grade, no diploma: 687
  • High school graduate (or equivalency): 10,440
  • Less than 1 year of college: 4,262
  • Some college more than 1 year, no degree: 8,874
  • Associate degree: 6,621
  • Bachelor's degree: 17,273
  • Master's degree: 4,517
  • Professional school degree: 1,480
  • Doctorate degree: 191
Educational Attainment for Females
Roseville marital status for males
Roseville marital status for females

Housing units in structures:

  • One, detached: 47,461
  • One, attached: 2,251
  • Two: 700
  • 3 or 4: 2,028
  • 5 to 9: 2,302
  • 10 to 19: 2,318
  • 20 to 49: 1,400
  • 50 or more: 4,019
  • Mobile homes: 1,264

Median worth of mobile homes: $152,000

Housing units lacking complete plumbing facilities in 2022: 0.7%

Housing units lacking complete kitchen facilities in 2022: 3.2%

House/condo owner moved in on average 9 years ago

Renter moved in on average 2 years ago

Year householders moved into residence in Roseville
Houses and condos Apartments
Most commonly used house heating fuel in houses and condos in Roseville, CA
  • 78.0%Utility gas
  • 19.6%Electricity
  • 0.9%Bottled, tank, or LP gas
  • 0.8%Solar energy
  • 0.3%Wood
  • 0.3%No fuel used
Most commonly used house heating fuel in apartments in Roseville, CA
  • 50.8%Utility gas
  • 46.0%Electricity
  • 1.7%Bottled, tank, or LP gas
  • 1.1%No fuel used
  • 0.2%Wood
  • 0.2%Fuel oil, kerosene, etc.

Private vs. public school enrollment:

Students in private schools in grades 1 to 8 (elementary and middle school): 1,072
Here:

7.5%
California:

10.5%

Students in private schools in grades 9 to 12 (high school): 179
Here:

2.2%
California:

8.5%

Students in private undergraduate colleges: 1,585
Here:

21.1%
California:

15.9%
School Enrollment by Level of School for Male Students
School Enrollment by Level of School for Female Students
Age and Sex of Sensory-Disabled Noninstitutionalized Residents
Age and Sex of Physically-Disabled Noninstitutionalized Residents
Age and Sex of Mentally-Disabled Noninstitutionalized Residents
Age and Sex of Self-Care Disabled Noninstitutionalized Residents
Age and Sex of Go-Outside-Home Disabled Noninstitutionalized Residents
Age and Sex of Noninstitutionalized Residents with Employment Disability