Sandwich, IL (Illinois) Houses and Residents
| Sandwich: | $227,920 |
| Illinois: | $251,600 |
Total population: 7,410 (Urban population: 6,538 (all inside urban clusters), Rural population: 0)
Houses: 2,646 (2,549 occupied: 1,830 owner occupied, 704 renter occupied)
| % of renters here: | 28% |
| State: | 33% |
Housing density: 878 houses/condos per square mile
Median price asked for vacant for-sale houses and condos in 2022 in this county: $178,377.
Median contract rent in 2022: $822 (lower quartile is $682, upper quartile is $942)
Median rent asked for vacant for-rent units in 2022: $1,332
Median gross rent in Sandwich, IL in 2022: $949
Housing units in Sandwich with a mortgage: 1,064 (60 second mortgage, 0 home equity loan, 58 both second mortgage and home equity loan)
Houses without a mortgage: 92
Median household income for houses/condos with a mortgage: $98,270
Median household income for apartments without a mortgage: $76,158
Median monthly housing costs: $1,106
Compare current foreclosures near Sandwich, IL:
| Photo | Address | Area | Beds / Baths | Price | Details |
|---|---|---|---|---|---|

|
#1
N 45th Rd
Sandwich, IL 60548
|
- sq. feet
|
1 baths 3 beds |
$273,000
|
show details |

|
#2
Irene Rd
Sandwich, IL 60548
|
1,792 sq. feet
|
2 baths 3 beds |
show details | |

|
#3
Cedar Ln
Sandwich, IL 60548
|
- sq. feet
|
- baths - beds |
show details | |

|
#4
Hickory Ln
Sandwich, IL 60548
|
- sq. feet
|
- baths - beds |
show details | |

|
#5
W 5th St
Sandwich, IL 60548
|
- sq. feet
|
- baths - beds |
show details | |

|
#6
W 2nd St
Sandwich, IL 60548
|
- sq. feet
|
- baths - beds |
show details | |

|
#7
Wentworth Dr Apt 2
Sandwich, IL 60548
|
- sq. feet
|
- baths - beds |
show details | |

|
#8
Bender St
Sandwich, IL 60548
|
- sq. feet
|
- baths - beds |
show details | |

|
#9
Whitetail Ln
Sandwich, IL 60548
|
- sq. feet
|
- baths - beds |
show details | |

|
#10
N Latham St
Sandwich, IL 60548
|
- sq. feet
|
- baths - beds |
show details |
| Photo | Address | Area | Beds / Baths | Price | Details |
|---|---|---|---|---|---|

|
#11
E 6th St
Sandwich, IL 60548
|
- sq. feet
|
- baths - beds |
show details | |

|
#12
E. 26th 19th Rd.
Sandwich, IL 60548
|
- sq. feet
|
- baths - beds |
show details | |

|
#13
Kathleen Cir
Montgomery, IL 60538
|
920 sq. feet
|
1 baths 2 beds |
$285,000
|
show details |

|
#14
Amsterdam Cir
Montgomery, IL 60538
|
2,793 sq. feet
|
2 baths 4 beds |
$459,900
|
show details |

|
#15
N Main St
Sandwich, IL 60548
|
- sq. feet
|
- baths - beds |
show details | |

|
#16
N Eddy St
Sandwich, IL 60548
|
- sq. feet
|
- baths - beds |
show details | |

|
#17
N Wolfe St
Sandwich, IL 60548
|
- sq. feet
|
- baths - beds |
show details | |

|
#18
Linda Ln
Sandwich, IL 60548
|
- sq. feet
|
- baths - beds |
show details | |

|
#19
E Arnold St
Sandwich, IL 60548
|
- sq. feet
|
- baths - beds |
show details | |

|
#20
Bayberry Ct
Sandwich, IL 60548
|
- sq. feet
|
- baths - beds |
show details |
| Photo | Address | Area | Beds / Baths | Price | Details |
|---|---|---|---|---|---|

|
#21
E College St
Sandwich, IL 60548
|
- sq. feet
|
- baths - beds |
show details | |

|
#22
Lake Holiday Dr
Sandwich, IL 60548
|
- sq. feet
|
- baths - beds |
show details | |

|
#23
Lake Holiday Dr
Sandwich, IL 60548
|
- sq. feet
|
- baths - beds |
show details | |

|
#24
S Green St
Sandwich, IL 60548
|
- sq. feet
|
- baths - beds |
show details | |

|
#25
S Wolfe St
Sandwich, IL 60548
|
- sq. feet
|
- baths - beds |
show details | |

|
#26
Suzy St
Sandwich, IL 60548
|
- sq. feet
|
- baths - beds |
show details | |

|
#27
Paulette Ct
Sandwich, IL 60548
|
- sq. feet
|
- baths - beds |
show details | |

|
#28
Crystal Acres Dr
Sandwich, IL 60548
|
- sq. feet
|
- baths - beds |
show details | |

|
#29
Lake Holiday Dr
Sandwich, IL 60548
|
- sq. feet
|
- baths - beds |
show details | |

|
#30
Rocky Way Apt 8
Montgomery, IL 60538
|
570 sq. feet
|
1 baths 1 beds |
show details |
| Photo | Address | Area | Beds / Baths | Price | Details |
|---|---|---|---|---|---|

|
#31
Big Rock Ave
Plano, IL 60545
|
2,021 sq. feet
|
2 baths 3 beds |
show details | |

|
#32
Star Grass Ln
Aurora, IL 60506
|
2,607 sq. feet
|
3 baths 3 beds |
show details | |

|
#33
N 3739th Rd
Sheridan, IL 60551
|
- sq. feet
|
2 baths 4 beds |
show details | |

|
#34
Laurel Dr
Aurora, IL 60506
|
1,600 sq. feet
|
2 baths 4 beds |
show details | |

|
#35
Garritano St Unit B
Yorkville, IL 60560
|
1,551 sq. feet
|
2 baths 2 beds |
show details | |

|
#36
Phelps Ct
Yorkville, IL 60560
|
1,865 sq. feet
|
2 baths 3 beds |
show details | |

|
#37
E Ridge St
Yorkville, IL 60560
|
2,000 sq. feet
|
2 baths 3 beds |
show details | |

|
#38
Stoneridge Ct
Yorkville, IL 60560
|
- sq. feet
|
2 baths 3 beds |
show details | |

|
#39
Kristen Ct
Plano, IL 60545
|
2,500 sq. feet
|
3 baths 4 beds |
show details | |

|
#40
Tamaira St
Plano, IL 60545
|
2,072 sq. feet
|
2 baths 4 beds |
show details |
| Photo | Address | Area | Beds / Baths | Price | Details |
|---|---|---|---|---|---|

|
#41
Light Rd Apt 106
Oswego, IL 60543
|
724 sq. feet
|
1 baths 2 beds |
show details | |

|
#42
W Barberry Cir
Yorkville, IL 60560
|
- sq. feet
|
2 baths 3 beds |
show details | |

|
#43
Candlelight Cir
Montgomery, IL 60538
|
- sq. feet
|
2 baths 2 beds |
show details | |

|
#44
Kensington Pl
Aurora, IL 60506
|
- sq. feet
|
2 baths 2 beds |
show details | |

|
#45
Lilac Ln Apt C
Aurora, IL 60506
|
- sq. feet
|
- baths - beds |
show details | |

|
#46
Colchester Dr
Oswego, IL 60543
|
- sq. feet
|
- baths - beds |
show details | |

|
#47
Bertram Dr Unit G
Yorkville, IL 60560
|
- sq. feet
|
- baths - beds |
show details | |

|
#48
Camden Ln Unit D
Yorkville, IL 60560
|
- sq. feet
|
- baths - beds |
show details | |

|
#49
Brompton Ln # A
Sugar Grove, IL 60554
|
- sq. feet
|
- baths - beds |
show details | |

|
Check over 1 million property listings on Foreclosure.com!
|
browse all offers | |||

Latest news about housing in Sandwich, IL collected exclusively by city-data.com from local newspapers, TV, and radio stations


Median year apartment built: 1966
Household type by relationship:
Households: 7,106- Male householders: 1,394 (277 living alone), Female householders: 1,129 (258 living alone)
1,299 spouses (1,299 opposite-sex spouses), 385 unmarried partners, (385 opposite-sex unmarried partners), 2,343 children (2,251 natural, 14 adopted, 76 stepchildren), 61 grandchildren, 0 brothers or sisters, 110 parents, 0 foster children, 22 other relatives, 187 non-relatives
- In group quarters: 172
Size of family households: 804 2-persons, 255 3-persons, 475 4-persons, 263 5-persons, 53 6-persons, 18 7-or-more-persons.
Size of nonfamily households: 490 1-person, 141 2-persons, 49 3-persons, 13 4-persons, 5 7-or-more-persons.
1,115 married couples with children.
531 single-parent households (147 men, 384 women).
90.6% of residents of Sandwich speak English at home.
6.6% of residents speak Spanish at home (68% speak English very well, 14% speak English well, 11% speak English not well, 7% don't speak English at all).
1.1% of residents speak other Indo-European language at home (54% speak English very well, 46% speak English well).
1.3% of residents speak Asian or Pacific Island language at home (88% speak English very well, 12% speak English well).
Foreign born population: 347 (4.9%)
(72.3% of them are naturalized citizens)
| Here: | 6.1 |
| State: | 6.4 |
| Here: | 4.6 |
| State: | 4.1 |

- Bedrooms in owner-occupied houses and condos in Sandwich, Illinois
- 4no bedroom
- 01 bedroom
- 3232 bedrooms
- 9493 bedrooms
- 4064 bedrooms
- 1495+ bedrooms

- Bedrooms in renter-occupied apartments in Sandwich, Illinois
- 28no bedroom
- 771 bedroom
- 3382 bedrooms
- 1963 bedrooms
- 574 bedrooms
- 95+ bedrooms

- Cars and other vehicles available in Sandwich in owner-occupied houses/condos
- 53no vehicle
- 3871 vehicle
- 7842 vehicles
- 4453 vehicles
- 1324 vehicles
- 305+ vehicles

- Cars and other vehicles available in Sandwich in renter-occupied apartments
- 71no vehicle
- 1981 vehicle
- 1882 vehicles
- 2033 vehicles
- 324 vehicles
- 135+ vehicles

- Rooms in owner-occupied houses in Sandwich, Illinois
- 41 room
- 02 rooms
- 363 rooms
- 1604 rooms
- 2845 rooms
- 4566 rooms
- 3057 rooms
- 1438 rooms
- 4439+ rooms

- Rooms in renter-occupied apartments in Sandwich, Illinois
- 231 room
- 02 rooms
- 943 rooms
- 1844 rooms
- 2515 rooms
- 406 rooms
- 377 rooms
- 618 rooms
- 159+ rooms


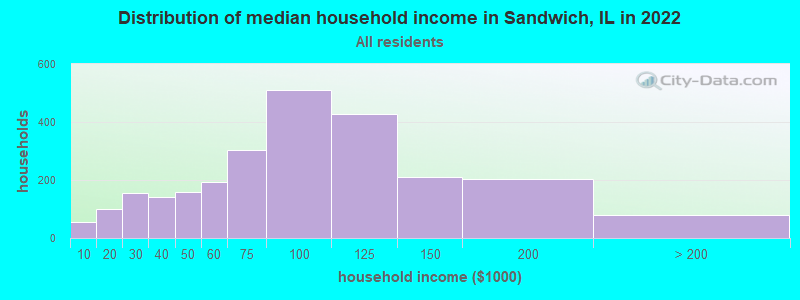
Sandwich, IL household income distribution

- 54Less than $10,000
- 101$10,000 to $19,999
- 155$20,000 to $29,999
- 142$30,000 to $39,999
- 157$40,000 to $49,999
- 194$50,000 to $59,999
- 304$60,000 to $74,999
- 509$75,000 to $99,999
- 426$100,000 to $124,999
- 211$125,000 to $149,999
- 205$150,000 to $199,999
- 80$200,000 or more
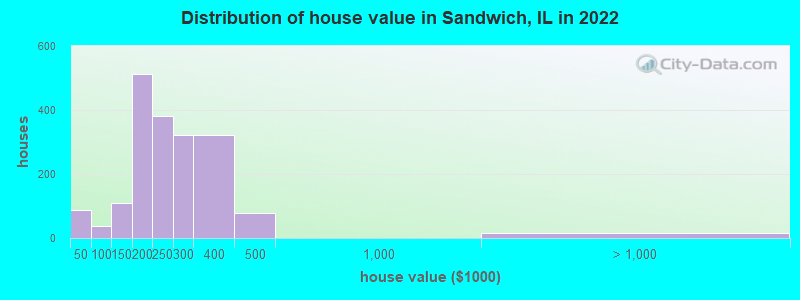
Home value of owner - occupied houses in 2022 in Sandwich, IL
-
- 21Less than $10,000
- 19$10,000 to $14,999
- 17$15,000 to $19,999
- 15$20,000 to $24,999
- 4$35,000 to $39,999
- 10$40,000 to $49,999
- 15$50,000 to $59,999
- 4$60,000 to $69,999
- 6$90,000 to $99,999
- 17$100,000 to $124,999
- 91$125,000 to $149,999
- 279$150,000 to $174,999
- 233$175,000 to $199,999
- 379$200,000 to $249,999
- 321$250,000 to $299,999
- 320$300,000 to $399,999
- 76$400,000 to $499,999
- 5$1,000,000 to $1,499,999
- 11$2,000,000 or more
Rent paid by renters in 2022 in Sandwich, IL
-
- 5$150 to $199
- 9$250 to $299
- 15$300 to $349
- 41$350 to $399
- 17$550 to $599
- 37$600 to $649
- 99$650 to $699
- 41$700 to $749
- 26$750 to $799
- 91$800 to $899
- 112$900 to $999
- 60$1,000 to $1,249
- 47$1,250 to $1,499
- 38$1,500 to $1,999
- 1$2,000 to $2,499
- 72No cash rent


Percentage of workers working in this county: 33.7%
Number of people working at home: 385 (11.4% of all workers)
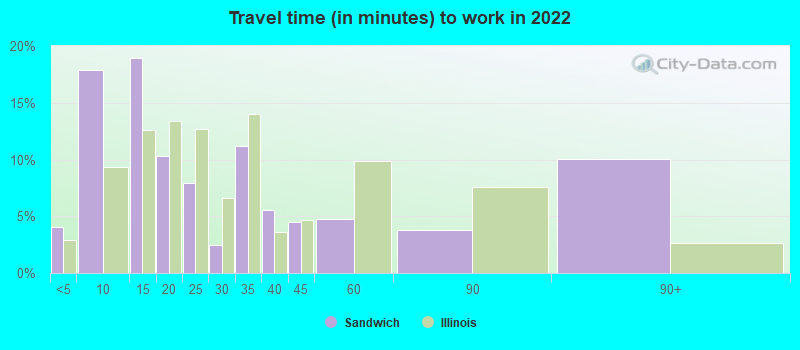
Travel time to work (commute)
- Less than 5 minutes: 114
- 5 to 9 minutes: 563
- 10 to 14 minutes: 154
- 15 to 19 minutes: 234
- 20 to 24 minutes: 323
- 25 to 29 minutes: 51
- 30 to 34 minutes: 549
- 35 to 39 minutes: 114
- 40 to 44 minutes: 157
- 45 to 59 minutes: 447
- 60 to 89 minutes: 299
- 90 or more minutes: 67
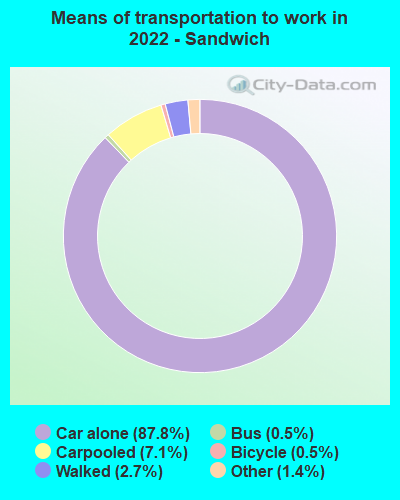
Means of transportation to work:
- Drove a car alone: 2,533 (77.0%)
- Carpooled: 217 (6.6%)
- Bus: 12 (0.4%)
- Taxi: 45 (1.4%)
- Bicycle: 14 (0.4%)
- Walked: 79 (2.4%)
- Worked at home: 385 (11.7%)

- Unemployment by race in 2022
- Unemployment rate for White non-Hispanic residents
- 1.4%Males
- 4.3%Females
- Unemployment rate for Black residents
- 100.0%Males
- Unemployment rate for other race residents
- 26.1%Females
- Unemployment rate for Hispanic or Latino residents
- 9.3%Females

- Year of entry for the foreign-born population in Sandwich, Illinois
- 1412010 or later
- 202000 to 2009
- 1021990 to 1999
- 501980 to 1989
- 631970 to 1979
- 64Before 1970

First ancestries reported:
- German: 504 (21.0%)
- American: 201 (8.4%)
- Norwegian: 164 (6.8%)
- Irish: 157 (6.5%)
- English: 130 (5.4%)
- Italian: 87 (3.6%)
- European: 57 (2.4%)
- Dutch: 39 (1.6%)
- Swedish: 34 (1.4%)
- Polish: 28 (1.2%)
- Welsh: 23 (1.0%)
- Scotch-Irish: 21 (0.9%)
- Czech: 19 (0.8%)
- Scottish: 18 (0.7%)
- Greek: 16 (0.7%)
- Romanian: 14 (0.6%)
- Eastern European: 11 (0.5%)
- Luxembourger: 11 (0.5%)
- British: 4 (0.2%)
- French: 4 (0.2%)
- French Canadian: 3 (0.1%)
Most common places of birth for foreign-born residents (%):
| Sandwich: | 44.3% (171) |
| Illinois: | 34.7% (626,958) |
| Sandwich: | 25.4% (98) |
| Illinois: | 9.2% (166,409) |
| Sandwich: | 10.4% (40) |
| Illinois: | 0.2% (2,988) |
| Sandwich: | 9.6% (37) |
| Illinois: | 5.2% (93,003) |
| Sandwich: | 6.7% (26) |
| Illinois: | 0.3% (5,895) |
| Sandwich: | 2.3% (9) |
| Illinois: | 0.2% (3,955) |
| Sandwich: | 2.1% (8) |
| Illinois: | 0.0% (494) |
Place of birth for U.S.-born residents:
- This state: 6,018
- Other state: 779
- Northeast: 94
- Midwest: 403
- South: 138
- West: 133
86.5% of Sandwich residents lived in the same house 1 years ago.
Out of people who lived in different houses, 18.0% lived in this county.
Out of people who lived in different counties, 89.1% lived in Illinois.
| Sandwich: | 86.5% |
| State average: | 88.3% |
Education attainment for males 25 years and older:
- No schooling: 5
- Nursery to 4th grade: 0
- 5th and 6th grade: 0
- 7th and 8th grade: 45
- 9th grade: 28
- 10th grade: 9
- 11th grade: 31
- 12th grade, no diploma: 114
- High school graduate (or equivalency): 658
- Less than 1 year of college: 315
- Some college more than 1 year, no degree: 339
- Associate degree: 391
- Bachelor's degree: 218
- Master's degree: 95
- Professional school degree: 38
- Doctorate degree: 31

Education attainment for females 25 years and older:
- No schooling: 13
- Nursery to 4th grade: 2
- 5th and 6th grade: 22
- 7th and 8th grade: 24
- 9th grade: 15
- 10th grade: 29
- 11th grade: 17
- 12th grade, no diploma: 27
- High school graduate (or equivalency): 914
- Less than 1 year of college: 318
- Some college more than 1 year, no degree: 258
- Associate degree: 410
- Bachelor's degree: 328
- Master's degree: 153
- Professional school degree: 4
- Doctorate degree: 0


Housing units in structures:
- One, detached: 1,986
- One, attached: 197
- Two: 107
- 3 or 4: 155
- 5 to 9: 36
- 50 or more: 57
- Mobile homes: 105
Median worth of mobile homes: $17,558
Housing units lacking complete kitchen facilities in 2022: 2.1%
House/condo owner moved in on average 13 years ago
Renter moved in on average 2 years ago

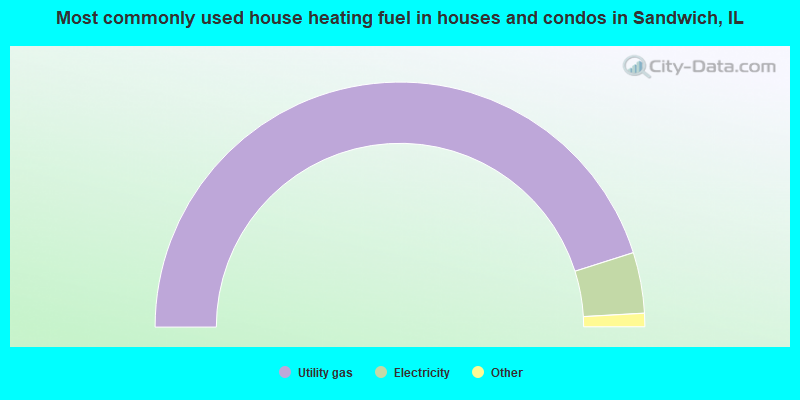
- 90.3%Utility gas
- 8.0%Electricity
- 0.9%Bottled, tank, or LP gas
- 0.8%No fuel used
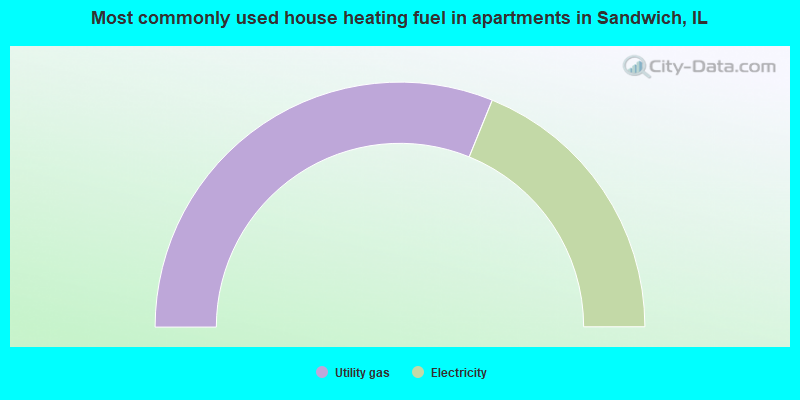
- 62.3%Utility gas
- 37.7%Electricity
Private vs. public school enrollment:
| Here: | 23.7% |
| Illinois: | 13.3% |
| Here: | 17.4% |
| Illinois: | 9.9% |
| Here: | 18.8% |
| Illinois: | 27.4% |


