Jump to a detailed profile or search site with Google Custom Search

Sanibel Island, FL (Florida) Houses and Residents

Estimated median house or condo value in 2022: $1,447,095 (it was $387,200 in 2000)
Sanibel Island:

$1,447,095
Florida:

$354,100
Lower value quartile - upper value quartile: $862,293 - $2,056,607

Total population: 8,676 (Urban population: 3,929, Rural population: 2,651 (all nonfarm))

Houses: 8,637 (3,315 occupied: 2,835 owner occupied, 480 renter occupied)

% of renters here:

14%
State:

33%

Housing density: 354 houses/condos per square mile

Median price asked for vacant for-sale houses and condos in 2022 in this county: $370,015.

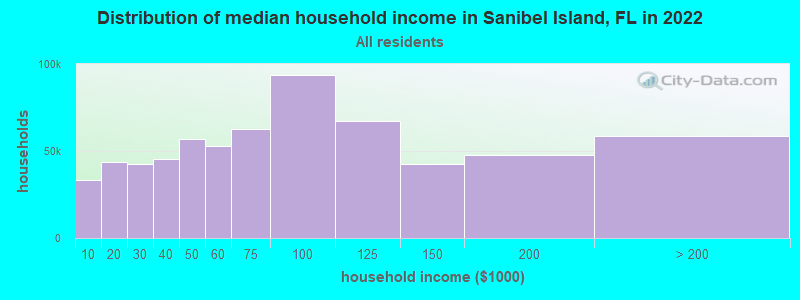
Median contract rent in 2022: over $2,000 (lower quartile is $1,677, upper quartile is over $2,000)


Median rent asked for vacant for-rent units in 2022: $1,890


Median gross rent in Sanibel Island, FL in 2022: over $2,000

Housing units in Sanibel Island with a mortgage: 1,066 (76 second mortgage, 179 home equity loan, 0 both second mortgage and home equity loan)
Houses without a mortgage: 1,023

Compare current foreclosures near Sanibel Island, FL:

Check out more offers near Sanibel Island, FL.
Powered by Foreclosure.com


Sanibel Island, Florida Age and Sex of Residents

Household type by relationship:

Households: 610,266
  • In family households: 496,901 (122,542 male householders, 48,484 female householders)
    132,426 spouses, 141,125 children (129,362 natural, 3,192 adopted, 8,571 stepchildren), 10,668 grandchildren, 6,242 brothers or sisters, 6,435 parents, foster children, 8,468 other relatives, 16,601 non-relatives
  • In nonfamily households: 113,365 (41,242 male householders (29,764 living alone)), 47,550 female householders (39,580 living alone)), 24,573 nonrelatives
  • In group quarters: 8,488 (4,259 institutionalized population)

54,206 married couples with children.
22,670 single-parent households (5,577 men, 17,093 women).

93.5% of residents of Sanibel Island speak English at home.
2.4% of residents speak Spanish at home (48% speak English very well, 24% speak English well, 28% speak English not well).
3.1% of residents speak other Indo-European language at home (78% speak English very well, 9% speak English well, 8% speak English not well, 6% don't speak English at all).
0.9% of residents speak Asian or Pacific Island language at home (51% speak English very well, 49% speak English well).
0.1% of residents speak other language at home (100% speak English very well).

Foreign born population: 1,885 (15.4%)
(68.5% of them are naturalized citizens)

Median number of rooms in houses and condos:
Here:

5.5
State:

5.9

Median number of rooms in apartments
Here:

4.4
State:

4.2

Owner-occupied Renter-occupied
Bedrooms in owner-occupied houses and condos in Sanibel Island, Florida
  • Bedrooms in owner-occupied houses and condos in Sanibel Island, Florida
  • 4no bedroom
  • 921 bedroom
  • 8392 bedrooms
  • 1,4743 bedrooms
  • 3564 bedrooms
  • 705+ bedrooms
Bedrooms in renter-occupied apartments in Sanibel Island, Florida
  • Bedrooms in renter-occupied apartments in Sanibel Island, Florida
  • 12no bedroom
  • 481 bedroom
  • 2542 bedrooms
  • 1353 bedrooms
  • 314 bedrooms
  • 05+ bedrooms
Owner-occupied Renter-occupied
Cars and other vehicles available in Sanibel Island in owner-occupied houses/condos
  • Cars and other vehicles available in Sanibel Island in owner-occupied houses/condos
  • 64no vehicle
  • 1,0251 vehicle
  • 1,3572 vehicles
  • 3243 vehicles
  • 314 vehicles
  • 345+ vehicles
Cars and other vehicles available in Sanibel Island in renter-occupied apartments
  • Cars and other vehicles available in Sanibel Island in renter-occupied apartments
  • 31no vehicle
  • 2441 vehicle
  • 1752 vehicles
  • 233 vehicles
  • 74 vehicles
  • 05+ vehicles
Owner-occupied Renter-occupied
Rooms in owner-occupied houses in Sanibel Island, Florida
  • Rooms in owner-occupied houses in Sanibel Island, Florida
  • 41 room
  • 132 rooms
  • 1153 rooms
  • 4184 rooms
  • 7255 rooms
  • 6956 rooms
  • 4027 rooms
  • 2528 rooms
  • 2119+ rooms
Rooms in renter-occupied apartments in Sanibel Island, Florida
  • Rooms in renter-occupied apartments in Sanibel Island, Florida
  • 71 room
  • 122 rooms
  • 743 rooms
  • 1194 rooms
  • 1425 rooms
  • 596 rooms
  • 577 rooms
  • 58 rooms
  • 59+ rooms
Year house built
Breakdown of mean house values by ages of householders
Owners and renters by unit type in Sanibel Island, FL
  • Sanibel Island, FL household income distribution

  • Distribution of median household income in Sanibel Island, FL in 2022
  • 33,167Less than $10,000
  • 43,682$10,000 to $19,999
  • 42,454$20,000 to $29,999
  • 45,520$30,000 to $39,999
  • 56,643$40,000 to $49,999
  • 53,054$50,000 to $59,999
  • 62,458$60,000 to $74,999
  • 93,827$75,000 to $99,999
  • 67,285$100,000 to $124,999
  • 42,412$125,000 to $149,999
  • 47,735$150,000 to $199,999
  • 58,529$200,000 or more

Percentage of workers working in this county: 94.7%
Number of people working at home: 649 (15.2% of all workers)

Travel time to work (commute)

  • Less than 5 minutes: 223
  • 5 to 9 minutes: 488
  • 10 to 14 minutes: 311
  • 15 to 19 minutes: 249
  • 20 to 24 minutes: 175
  • 25 to 29 minutes: 62
  • 30 to 34 minutes: 108
  • 35 to 39 minutes: 24
  • 40 to 44 minutes: 49
  • 45 to 59 minutes: 134
  • 60 to 89 minutes: 56
  • 90 or more minutes: 25

Means of transportation to work:

  • Drove a car alone: 1,476 (66.6%)
  • Carpooled: 218 (9.8%)
  • Streetcar or trolley car: 8 (0.4%)
  • Motorcycle: 6 (0.3%)
  • Bicycle: 70 (3.2%)
  • Walked: 81 (3.7%)
  • Other means: 45 (2.0%)
  • Worked at home: 312 (14.1%)
Class of Workers in 2000
Year of entry for the foreign-born population in Sanibel Island, Florida
  • Year of entry for the foreign-born population in Sanibel Island, Florida
  • 991995 to March 2000
  • 111990 to 1994
  • 261985 to 1989
  • 361980 to 1984
  • 121975 to 1979
  • 221970 to 1974
  • 661965 to 1969
  • 213Before 1965

Most common places of birth for foreign-born residents (%):

Canada
Sanibel Island:

16.5% (80)
Florida:

3.7% (99,139)

United Kingdom
Sanibel Island:

13.0% (63)
Florida:

2.6% (70,384)

Germany
Sanibel Island:

8.7% (42)
Florida:

2.4% (64,088)

Other Northern Europe
Sanibel Island:

5.8% (28)
Florida:

0.3% (8,791)

France
Sanibel Island:

5.4% (26)
Florida:

0.6% (14,979)

India
Sanibel Island:

4.9% (24)
Florida:

1.2% (32,295)

Poland
Sanibel Island:

3.5% (17)
Florida:

0.9% (24,998)

Other Eastern Europe
Sanibel Island:

3.1% (15)
Florida:

0.6% (14,860)

China, excluding Hong Kong and Taiwan
Sanibel Island:

3.1% (15)
Florida:

0.7% (17,732)

Cuba
Sanibel Island:

3.1% (15)
Florida:

24.1% (642,951)

Italy
Sanibel Island:

2.9% (14)
Florida:

1.2% (31,508)

Netherlands
Sanibel Island:

2.7% (13)
Florida:

0.3% (7,322)

Taiwan
Sanibel Island:

2.5% (12)
Florida:

0.2% (6,435)

Nicaragua
Sanibel Island:

2.3% (11)
Florida:

3.7% (98,022)

Spain
Sanibel Island:

2.1% (10)
Florida:

0.6% (15,401)

Dominican Republic
Sanibel Island:

2.1% (10)
Florida:

2.5% (66,690)

Philippines
Sanibel Island:

1.9% (9)
Florida:

1.6% (43,422)

Other South Eastern Asia
Sanibel Island:

1.9% (9)
Florida:

0.0% (1,162)

Sweden
Sanibel Island:

1.6% (8)
Florida:

0.2% (4,583)

Other Western Europe
Sanibel Island:

1.6% (8)
Florida:

0.3% (6,821)

Korea
Sanibel Island:

1.6% (8)
Florida:

0.6% (16,313)

Indonesia
Sanibel Island:

1.6% (8)
Florida:

0.1% (2,384)

Egypt
Sanibel Island:

1.6% (8)
Florida:

0.2% (5,784)

Place of birth for U.S.-born residents:

  • This state: 578
  • Other state: 5,441
  • Northeast: 2,279
  • Midwest: 2,325
  • South: 646
  • West: 191

52% of Sanibel Island residents lived in the same house 5 years ago.
   Out of people who lived in different houses, 31% lived in this county.
   Out of people who lived in different counties, 9% lived in Florida.

Education attainment for males 25 years and older:

  • No schooling: 10
  • Nursery to 4th grade: 8
  • 5th and 6th grade: 0
  • 7th and 8th grade: 13
  • 9th grade: 7
  • 10th grade: 6
  • 11th grade: 20
  • 12th grade, no diploma: 52
  • High school graduate (or equivalency): 293
  • Less than 1 year of college: 133
  • Some college more than 1 year, no degree: 354
  • Associate degree: 128
  • Bachelor's degree: 910
  • Master's degree: 427
  • Professional school degree: 315
  • Doctorate degree: 87
Educational Attainment for Males

Education attainment for females 25 years and older:

  • No schooling: 7
  • Nursery to 4th grade: 0
  • 5th and 6th grade: 0
  • 7th and 8th grade: 21
  • 9th grade: 17
  • 10th grade: 14
  • 11th grade: 21
  • 12th grade, no diploma: 42
  • High school graduate (or equivalency): 504
  • Less than 1 year of college: 215
  • Some college more than 1 year, no degree: 563
  • Associate degree: 270
  • Bachelor's degree: 984
  • Master's degree: 361
  • Professional school degree: 36
  • Doctorate degree: 17
Educational Attainment for Females
Sanibel Island marital status for males
Sanibel Island marital status for females

Housing units in structures:

  • One, detached: 4,161
  • One, attached: 567
  • Two: 243
  • 3 or 4: 372
  • 5 to 9: 1,105
  • 10 to 19: 477
  • 20 to 49: 876
  • 50 or more: 591
  • Mobile homes: 237
  • Boats, RVs, vans, etc.: 8

Median worth of mobile homes: $154,013

Housing units lacking complete plumbing facilities: 0.0%

Housing units lacking complete kitchen facilities: 0.1%
Year householders moved into residence in Sanibel Island
Houses and condos Apartments
Most commonly used house heating fuel in houses and condos in Sanibel Island, FL
  • 94.1%Electricity
  • 2.7%Utility gas
  • 1.7%Bottled, tank, or LP gas
  • 0.7%Fuel oil, kerosene, etc.
  • 0.7%No fuel used
Most commonly used house heating fuel in apartments in Sanibel Island, FL
  • 86.9%Electricity
  • 4.6%Utility gas
  • 4.0%Bottled, tank, or LP gas
  • 3.3%Other fuel
  • 1.2%Fuel oil, kerosene, etc.

Private vs. public school enrollment:

Students in private schools in grades 1 to 8 (elementary and middle school): 25
Here:

7.5%
Florida:

11.7%

Students in private schools in grades 9 to 12 (high school): 33
Here:

19.8%
Florida:

9.7%

Students in private undergraduate colleges: 7
Here:

8.4%
Florida:

21.0%
School Enrollment by Level of School for Male Students
School Enrollment by Level of School for Female Students
Age and Sex of Sensory-Disabled Noninstitutionalized Residents
Age and Sex of Physically-Disabled Noninstitutionalized Residents
Age and Sex of Mentally-Disabled Noninstitutionalized Residents
Age and Sex of Self-Care Disabled Noninstitutionalized Residents
Age and Sex of Go-Outside-Home Disabled Noninstitutionalized Residents
Age and Sex of Noninstitutionalized Residents with Employment Disability