Housing density: 134 houses/condos per square mile
Median price asked for vacant for-sale houses and condos in 2022: $166,791.
Median contract rent in 2022: $947 (lower quartile is $675, upper quartile is $1,191)
Median rent asked for vacant for-rent units in 2022: $686
Median gross rent in Sierra Vista, AZ in 2022: $1,112
Housing units in Sierra Vista with a mortgage: 6,549 (224 second mortgage, 0 home equity loan, 123 both second mortgage and home equity loan) Houses without a mortgage: 31
Median household income for houses/condos with a mortgage: $102,070
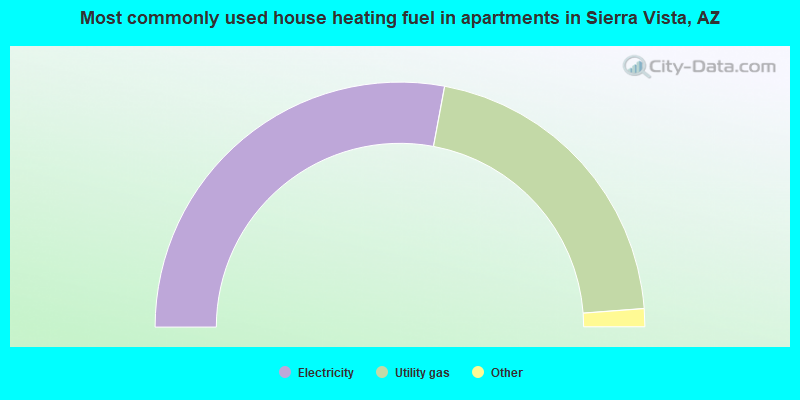
Median household income for apartments without a mortgage: $53,698
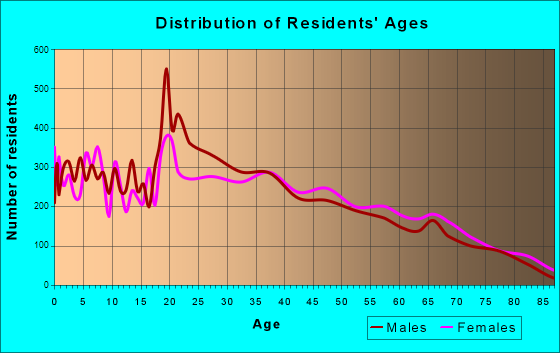
5,749 married couples with children.
3,577 single-parent households (382 men, 3,195 women).
81.3% of residents of Sierra Vista speak English at home.
12.9% of residents speak Spanish at home (76% speak English very well, 16% speak English well, 7% speak English not well, 1% don't speak English at all).
2.7% of residents speak other Indo-European language at home (94% speak English very well, 6% speak English well).
2.9% of residents speak Asian or Pacific Island language at home (61% speak English very well, 28% speak English well, 12% speak English not well).
0.2% of residents speak other language at home (78% speak English very well, 22% speak English not well).
Foreign born population: 4,404 (9.7%)
(72.8% of them are naturalized citizens)
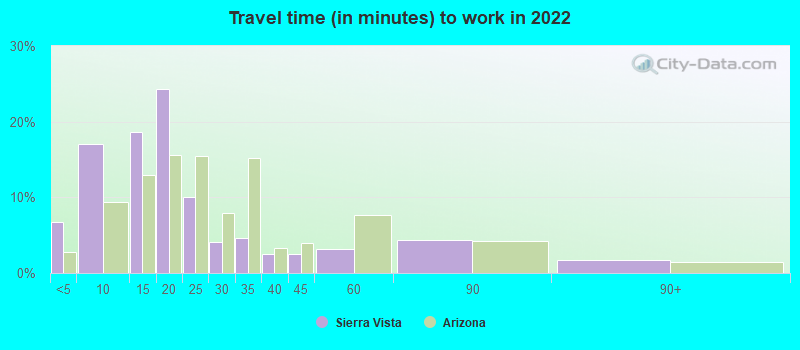
Percentage of workers working in this county: 98.9% Number of people working at home: 2,748 (13.9% of all workers)
Travel time to work (commute)
Less than 5 minutes: 1,365
5 to 9 minutes: 3,363
10 to 14 minutes: 4,032
15 to 19 minutes: 4,341
20 to 24 minutes: 1,439
25 to 29 minutes: 441
30 to 34 minutes: 561
35 to 39 minutes: 249
40 to 44 minutes: 222
45 to 59 minutes: 469
60 to 89 minutes: 554
90 or more minutes: 178
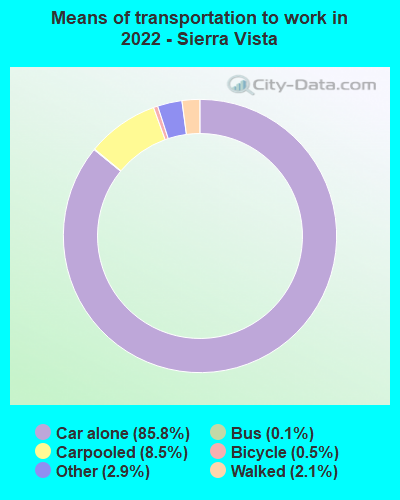
Means of transportation to work:
Drove a car alone: 19,301 (74.7%)
Carpooled: 2,015 (7.8%)
Bus: 16 (0.1%)
Ferryboat: 2 (0.0%)
Taxi: 733 (2.8%)
Bicycle: 106 (0.4%)
Walked: 521 (2.0%)
Worked at home: 2,487 (9.6%)
Unemployment by race in 2022
Unemployment rate for White non-Hispanic residents
5.5%Males
1.7%Females
Unemployment rate for Black residents
3.4%Males
12.2%Females
Unemployment rate for American Indian and Alaska Native residents
4.2%Males
Unemployment rate for other race residents
12.2%Females
Unemployment rate for two or more race residents
4.6%Males
5.2%Females
Unemployment rate for Hispanic or Latino residents
0.9%Males
6.3%Females
Year of entry for the foreign-born population in Sierra Vista, Arizona
1,2602010 or later
8772000 to 2009
5131990 to 1999
7781980 to 1989
7191970 to 1979
1,004Before 1970
First ancestries reported:
German: 2,148 (9.4%)
Irish: 1,577 (6.9%)
English: 1,538 (6.8%)
American: 1,528 (6.7%)
European: 1,019 (4.5%)
Italian: 623 (2.7%)
Polish: 355 (1.6%)
Scottish: 278 (1.2%)
Northern European: 200 (0.9%)
Scotch-Irish: 147 (0.6%)
Welsh: 131 (0.6%)
Swedish: 123 (0.5%)
African: 111 (0.5%)
French Canadian: 109 (0.5%)
Canadian: 96 (0.4%)
Dutch: 87 (0.4%)
Eastern European: 76 (0.3%)
Moroccan: 75 (0.3%)
Scandinavian: 62 (0.3%)
French: 57 (0.3%)
Danish: 55 (0.2%)
Romanian: 50 (0.2%)
Swiss: 46 (0.2%)
Bulgarian: 44 (0.2%)
Norwegian: 37 (0.2%)
Nigerian: 35 (0.2%)
British: 32 (0.1%)
Australian: 25 (0.1%)
Latvian: 17 (0.07%)
Ukrainian: 17 (0.07%)
Portuguese: 16 (0.07%)
Arab: 15 (0.07%)
Syrian: 12 (0.05%)
Hungarian: 12 (0.05%)
Austrian: 12 (0.05%)
Haitian: 12 (0.05%)
Russian: 11 (0.05%)
Greek: 11 (0.05%)
Czech: 11 (0.05%)
Croatian: 11 (0.05%)
Lithuanian: 10 (0.04%)
Jamaican: 9 (0.04%)
Slovene: 6 (0.03%)
Luxembourger: 5 (0.02%)
Iranian: 4 (0.02%)
Basque: 2 (0.01%)
Most common places of birth for foreign-born residents (%):
Mexico
Sierra Vista:
28.9% (1,265)
Arizona:
53.4% (500,086)
Korea
Sierra Vista:
13.4% (588)
Arizona:
1.2% (11,275)
Philippines
Sierra Vista:
9.6% (419)
Arizona:
3.2% (30,378)
Guatemala
Sierra Vista:
7.7% (339)
Arizona:
1.6% (14,556)
Germany
Sierra Vista:
7.2% (313)
Arizona:
1.5% (14,058)
Canada
Sierra Vista:
4.7% (207)
Arizona:
4.3% (40,102)
Vietnam
Sierra Vista:
4.0% (173)
Arizona:
2.1% (19,199)
Poland
Sierra Vista:
3.2% (142)
Arizona:
0.5% (5,025)
Morocco
Sierra Vista:
3.2% (138)
Arizona:
0.1% (951)
Iran
Sierra Vista:
3.0% (132)
Arizona:
0.6% (5,893)
Place of birth for U.S.-born residents:
This state: 11,930
Other state: 26,946
Northeast: 3,399
Midwest: 5,316
South: 8,799
West: 9,597
84.1% of Sierra Vista residents lived in the same house 1 years ago. Out of people who lived in different houses, 34.2% lived in this county. Out of people who lived in different counties, 18.5% lived in Arizona.
Sierra Vista:
84.1%
State average:
86.0%
Education attainment for males 25 years and older:
No schooling: 163
Nursery to 4th grade: 0
5th and 6th grade: 22
7th and 8th grade: 142
9th grade: 84
10th grade: 102
11th grade: 72
12th grade, no diploma: 341
High school graduate (or equivalency): 2,735
Less than 1 year of college: 1,075
Some college more than 1 year, no degree: 2,866
Associate degree: 2,158
Bachelor's degree: 3,001
Master's degree: 1,577
Professional school degree: 284
Doctorate degree: 96
Education attainment for females 25 years and older:
No schooling: 108
Nursery to 4th grade: 83
5th and 6th grade: 98
7th and 8th grade: 110
9th grade: 242
10th grade: 154
11th grade: 290
12th grade, no diploma: 291
High school graduate (or equivalency): 3,491
Less than 1 year of college: 1,409
Some college more than 1 year, no degree: 2,200
Associate degree: 1,827
Bachelor's degree: 3,491
Master's degree: 2,042
Professional school degree: 100
Doctorate degree: 303
Housing units in structures:
One, detached: 13,925
One, attached: 971
Two: 123
3 or 4: 617
5 to 9: 732
10 to 19: 1,668
20 to 49: 543
50 or more: 812
Mobile homes: 1,095
Boats, RVs, vans, etc.: 40
Median worth of mobile homes: $27,280
Housing units lacking complete plumbing facilities in 2022: 0.4%
Housing units lacking complete kitchen facilities in 2022: 1.4%