South Jefferson, CO (Colorado) Houses and Residents
| South Jefferson: | $1,006,453 |
| Colorado: | $531,100 |
Total population: 23,024 (Urban population: 7,731, Rural population: 15,199 (253 farm, 14,946 nonfarm))
Houses: 9,109 (8,184 occupied: 7,653 owner occupied, 531 renter occupied)
| % of renters here: | 6% |
| State: | 34% |
Housing density: 26 houses/condos per square mile
Median price asked for vacant for-sale houses and condos in 2022 in this county: $710,413.
Median contract rent in 2022: $1,639 (lower quartile is $1,391, upper quartile is over $2,000)
Median rent asked for vacant for-rent units in 2022: $2,638
Median gross rent in South Jefferson, CO in 2022: $1,947
Housing units in South Jefferson with a mortgage: 5,658 (1,060 second mortgage, 591 home equity loan, 26 both second mortgage and home equity loan)
Houses without a mortgage: 805
Compare current foreclosures near South Jefferson, CO:
| Photo | Address | Area | Beds / Baths | Price | Details |
|---|---|---|---|---|---|

|
#1
S Columbine Dr
Morrison, CO 80465
|
2,280 sq. feet
|
2 baths 3 beds |
$529,900
|
show details |

|
#2
Hyacinth Rd
Littleton, CO 80129
|
2,834 sq. feet
|
3 baths 4 beds |
show details | |

|
#3
W Hinsdale Dr
Littleton, CO 80127
|
1,923 sq. feet
|
2 baths 2 beds |
show details | |

|
#4
Neville Ln
Golden, CO 80401
|
2,655 sq. feet
|
4 baths 4 beds |
show details | |

|
#5
S Vivian St
Denver, CO 80228
|
1,261 sq. feet
|
2 baths 3 beds |
show details | |

|
#6
Renaud Rd
Bailey, CO 80421
|
600 sq. feet
|
1 baths 2 beds |
show details | |

|
#7
S Miller Way
Denver, CO 80226
|
1,269 sq. feet
|
2 baths 4 beds |
show details | |

|
#8
Geneva Creek Lane
Littleton, CO 80125
|
- sq. feet
|
3 baths 3 beds |
show details | |

|
#9
S Van Gordon St
Denver, CO 80228
|
1,630 sq. feet
|
2 baths 3 beds |
show details | |

|
#10
Bucknell Cir
Littleton, CO 80129
|
1,592 sq. feet
|
3 baths 3 beds |
show details |
| Photo | Address | Area | Beds / Baths | Price | Details |
|---|---|---|---|---|---|

|
#11
W Alder Ave
Littleton, CO 80128
|
1,125 sq. feet
|
2 baths 3 beds |
show details | |

|
#12
W Capri Ave
Littleton, CO 80123
|
1,772 sq. feet
|
3 baths 3 beds |
show details | |

|
#13
S Balsam St
Denver, CO 80227
|
1,296 sq. feet
|
2 baths 2 beds |
show details | |

|
#14
W Woodard Cir
Denver, CO 80227
|
3,221 sq. feet
|
3 baths 3 beds |
show details | |

|
#15
S Windermere St
Littleton, CO 80120
|
1,992 sq. feet
|
4 baths 1 beds |
show details | |

|
#16
S Upham St
Denver, CO 80227
|
2,750 sq. feet
|
3 baths 3 beds |
show details | |

|
#17
S Valentine Way
Denver, CO 80228
|
1,169 sq. feet
|
2 baths 4 beds |
show details | |

|
#18
W Vail Pass
Littleton, CO 80127
|
1,562 sq. feet
|
1 baths 3 beds |
show details | |

|
#19
Kyle Way
Littleton, CO 80125
|
1,630 sq. feet
|
2 baths 3 beds |
show details | |

|
#20
Charissglen Ln
Littleton, CO 80126
|
4,450 sq. feet
|
3 baths 4 beds |
show details |
| Photo | Address | Area | Beds / Baths | Price | Details |
|---|---|---|---|---|---|

|
#21
S Newland Cir
Littleton, CO 80123
|
1,898 sq. feet
|
2 baths 4 beds |
show details | |

|
#22
W Dartmouth Ave
Denver, CO 80227
|
1,351 sq. feet
|
3 baths 3 beds |
show details | |

|
#23
S Merriam Dr
Evergreen, CO 80439
|
1,949 sq. feet
|
1 baths 3 beds |
show details | |

|
#24
Ward Ct
Denver, CO 80228
|
1,800 sq. feet
|
3 baths 2 beds |
show details | |

|
#25
S Gray Dr
Denver, CO 80227
|
2,224 sq. feet
|
2 baths 3 beds |
show details | |

|
#26
W Lakeside Dr
Littleton, CO 80125
|
1,772 sq. feet
|
2 baths 2 beds |
show details | |

|
#27
S Wamblee Valley Rd
Conifer, CO 80433
|
2,221 sq. feet
|
2 baths 3 beds |
show details | |

|
#28
White Oak St
Littleton, CO 80129
|
2,130 sq. feet
|
3 baths 4 beds |
show details | |

|
#29
S Utica St
Denver, CO 80236
|
2,200 sq. feet
|
2 baths 3 beds |
show details | |

|
#30
W Grand Ave
Littleton, CO 80123
|
1,926 sq. feet
|
2 baths 3 beds |
show details |
| Photo | Address | Area | Beds / Baths | Price | Details |
|---|---|---|---|---|---|

|
#31
Red Tail Trl
Evergreen, CO 80439
|
3,540 sq. feet
|
3 baths 4 beds |
show details | |

|
#32
W Aksarben Ave
Littleton, CO 80123
|
1,544 sq. feet
|
1 baths 3 beds |
show details | |

|
#33
S Welch Cir
Denver, CO 80228
|
1,247 sq. feet
|
2 baths 4 beds |
show details | |

|
#34
W Princeton Dr
Denver, CO 80235
|
5,087 sq. feet
|
3 baths 3 beds |
show details | |

|
#35
W Aqueduct Ave
Littleton, CO 80123
|
2,322 sq. feet
|
3 baths 3 beds |
show details | |

|
#36
Maplehurst Pt
Littleton, CO 80126
|
3,809 sq. feet
|
5 baths 4 beds |
show details | |

|
#37
S Ames Way
Denver, CO 80235
|
5,068 sq. feet
|
3 baths 3 beds |
show details | |

|
#38
W Ponds Cir
Littleton, CO 80123
|
2,478 sq. feet
|
3 baths 2 beds |
show details | |

|
#39
S Queen St
Denver, CO 80232
|
1,632 sq. feet
|
2 baths 4 beds |
show details | |

|
#40
W Bowles Ave
Littleton, CO 80123
|
3,447 sq. feet
|
3 baths 5 beds |
show details |
| Photo | Address | Area | Beds / Baths | Price | Details |
|---|---|---|---|---|---|

|
#41
S Pierce St Apt 5-102
Denver, CO 80235
|
1,024 sq. feet
|
2 baths 2 beds |
show details | |

|
#42
Ridgemont Cir
Littleton, CO 80126
|
4,503 sq. feet
|
5 baths 4 beds |
show details | |

|
#43
W Warren Dr
Denver, CO 80227
|
1,791 sq. feet
|
2 baths 4 beds |
show details | |

|
#44
S Coyote St
Littleton, CO 80126
|
2,371 sq. feet
|
3 baths 3 beds |
show details | |

|
#45
S Miller Ct
Denver, CO 80235
|
1,758 sq. feet
|
2 baths 4 beds |
show details | |

|
#46
W Florida Pl
Denver, CO 80232
|
816 sq. feet
|
2 baths 4 beds |
show details | |

|
#47
S Brentwood St
Denver, CO 80227
|
2,120 sq. feet
|
4 baths 3 beds |
show details | |

|
#48
W Quinn Pl
Denver, CO 80236
|
1,040 sq. feet
|
1 baths 3 beds |
show details | |

|
#49
S Harlan St Unit 145
Denver, CO 80235
|
983 sq. feet
|
1 baths 2 beds |
show details | |

|
Check over 1 million property listings on Foreclosure.com!
|
browse all offers | |||

Household type by relationship:
Households: 527,116- In family households: 432,369 (103,146 male householders, 39,633 female householders)
111,377 spouses, 145,008 children (134,008 natural, 4,220 adopted, 6,780 stepchildren), 8,283 grandchildren, 4,063 brothers or sisters, 3,491 parents, foster children, 4,299 other relatives, 10,160 non-relatives
- In nonfamily households: 94,747 (36,264 male householders (27,356 living alone)), 39,117 female householders (32,438 living alone)), 19,366 nonrelatives
- In group quarters: 7,427 (5,276 institutionalized population)
98,474 married couples with children.
25,796 single-parent households (6,763 men, 19,033 women).
94.3% of residents of South Jefferson speak English at home.
2.2% of residents speak Spanish at home (68% speak English very well, 18% speak English well, 14% speak English not well).
3.0% of residents speak other Indo-European language at home (79% speak English very well, 16% speak English well, 5% speak English not well).
0.4% of residents speak Asian or Pacific Island language at home (80% speak English very well, 20% speak English well).
0.1% of residents speak other language at home (100% speak English very well).
Foreign born population: 853 (3.4%)
(69.5% of them are naturalized citizens)
| Here: | 7.3 |
| State: | 6.8 |
| Here: | 5.1 |
| State: | 4.0 |
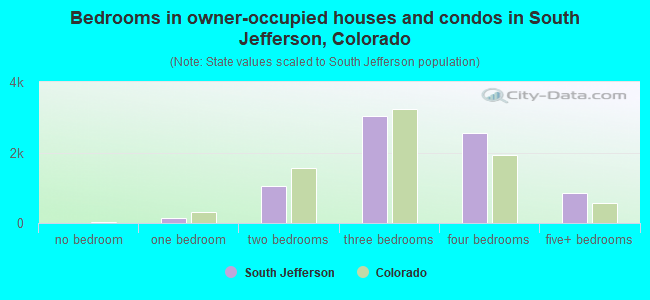
- Bedrooms in owner-occupied houses and condos in South Jefferson, Colorado
- 11no bedroom
- 1371 bedroom
- 1,0422 bedrooms
- 3,0433 bedrooms
- 2,5654 bedrooms
- 8555+ bedrooms
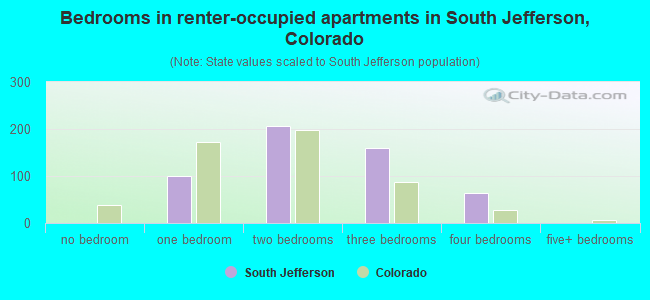
- Bedrooms in renter-occupied apartments in South Jefferson, Colorado
- 0no bedroom
- 1011 bedroom
- 2072 bedrooms
- 1593 bedrooms
- 644 bedrooms
- 05+ bedrooms
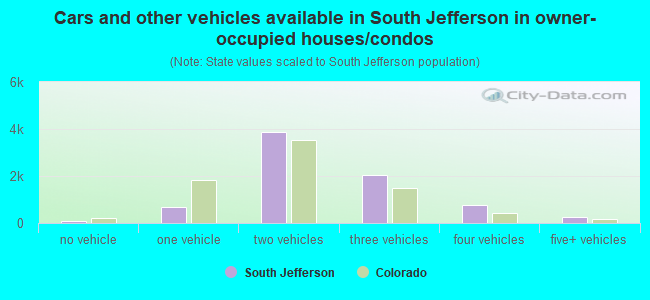
- Cars and other vehicles available in South Jefferson in owner-occupied houses/condos
- 67no vehicle
- 6731 vehicle
- 3,8642 vehicles
- 2,0283 vehicles
- 7854 vehicles
- 2365+ vehicles
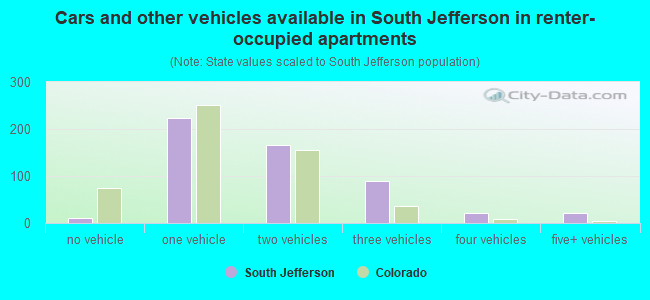
- Cars and other vehicles available in South Jefferson in renter-occupied apartments
- 10no vehicle
- 2231 vehicle
- 1652 vehicles
- 903 vehicles
- 214 vehicles
- 225+ vehicles
- Rooms in owner-occupied houses in South Jefferson, Colorado
- 01 room
- 382 rooms
- 1333 rooms
- 2624 rooms
- 7655 rooms
- 1,0426 rooms
- 1,3687 rooms
- 1,2548 rooms
- 2,7919+ rooms
- Rooms in renter-occupied apartments in South Jefferson, Colorado
- 01 room
- 612 rooms
- 823 rooms
- 694 rooms
- 1155 rooms
- 966 rooms
- 217 rooms
- 318 rooms
- 569+ rooms
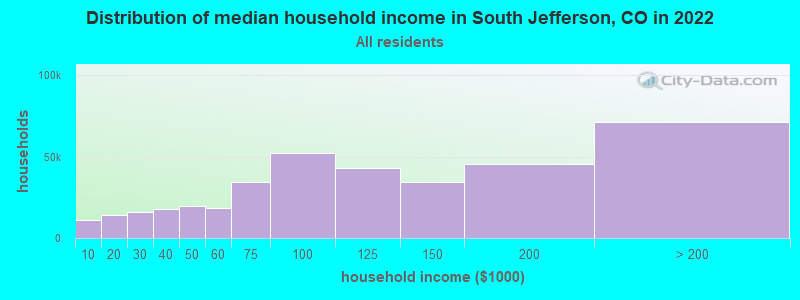
South Jefferson, CO household income distribution

- 11,235Less than $10,000
- 14,236$10,000 to $19,999
- 16,083$20,000 to $29,999
- 17,508$30,000 to $39,999
- 19,875$40,000 to $49,999
- 18,358$50,000 to $59,999
- 34,298$60,000 to $74,999
- 52,073$75,000 to $99,999
- 43,195$100,000 to $124,999
- 34,548$125,000 to $149,999
- 45,132$150,000 to $199,999
- 71,223$200,000 or more
Percentage of workers working in this county: 61.7%
Number of people working at home: 3,461 (24.9% of all workers)
Travel time to work (commute)
- Less than 5 minutes: 108
- 5 to 9 minutes: 436
- 10 to 14 minutes: 598
- 15 to 19 minutes: 714
- 20 to 24 minutes: 931
- 25 to 29 minutes: 557
- 30 to 34 minutes: 1,546
- 35 to 39 minutes: 747
- 40 to 44 minutes: 845
- 45 to 59 minutes: 2,581
- 60 to 89 minutes: 1,545
- 90 or more minutes: 486
Means of transportation to work:
- Drove a car alone: 9,405 (76.6%)
- Carpooled: 1,114 (9.1%)
- Bus or trolley bus: 368 (3.0%)
- Bicycle: 4 (0.0%)
- Walked: 67 (0.5%)
- Other means: 136 (1.1%)
- Worked at home: 1,180 (9.6%)
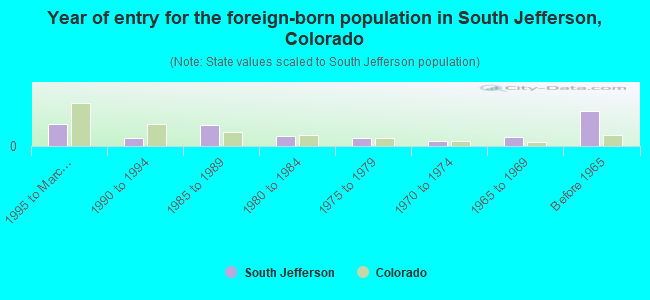
- Year of entry for the foreign-born population in South Jefferson, Colorado
- 1391995 to March 2000
- 491990 to 1994
- 1331985 to 1989
- 621980 to 1984
- 501975 to 1979
- 311970 to 1974
- 551965 to 1969
- 219Before 1965
Most common places of birth for foreign-born residents (%):
| South Jefferson: | 22.1% (163) |
| Colorado: | 3.7% (13,552) |
| South Jefferson: | 12.7% (94) |
| Colorado: | 4.5% (16,615) |
| South Jefferson: | 11.0% (81) |
| Colorado: | 3.1% (11,301) |
| South Jefferson: | 4.6% (34) |
| Colorado: | 0.5% (1,676) |
| South Jefferson: | 3.8% (28) |
| Colorado: | 0.3% (1,021) |
| South Jefferson: | 3.4% (25) |
| Colorado: | 1.1% (4,134) |
| South Jefferson: | 3.3% (24) |
| Colorado: | 0.6% (2,125) |
| South Jefferson: | 3.3% (24) |
| Colorado: | 3.3% (12,356) |
| South Jefferson: | 2.4% (18) |
| Colorado: | 0.5% (1,684) |
| South Jefferson: | 2.2% (16) |
| Colorado: | 1.6% (5,975) |
| South Jefferson: | 2.2% (16) |
| Colorado: | 0.4% (1,612) |
| South Jefferson: | 2.2% (16) |
| Colorado: | 0.3% (1,092) |
| South Jefferson: | 1.9% (14) |
| Colorado: | 0.5% (1,888) |
| South Jefferson: | 1.9% (14) |
| Colorado: | 1.4% (5,035) |
| South Jefferson: | 1.9% (14) |
| Colorado: | 0.6% (2,301) |
| South Jefferson: | 1.8% (13) |
| Colorado: | 0.3% (1,110) |
Place of birth for U.S.-born residents:
- This state: 7,304
- Other state: 14,658
- Northeast: 2,730
- Midwest: 6,109
- South: 2,646
- West: 3,173
57% of South Jefferson residents lived in the same house 5 years ago.
Out of people who lived in different houses, 35% lived in this county.
Out of people who lived in different counties, 39% lived in Colorado.
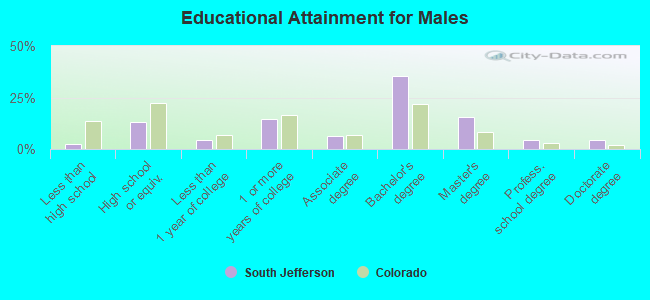
Education attainment for males 25 years and older:
- No schooling: 0
- Nursery to 4th grade: 0
- 5th and 6th grade: 15
- 7th and 8th grade: 22
- 9th grade: 7
- 10th grade: 29
- 11th grade: 29
- 12th grade, no diploma: 77
- High school graduate (or equivalency): 1,004
- Less than 1 year of college: 334
- Some college more than 1 year, no degree: 1,137
- Associate degree: 470
- Bachelor's degree: 2,728
- Master's degree: 1,197
- Professional school degree: 356
- Doctorate degree: 323
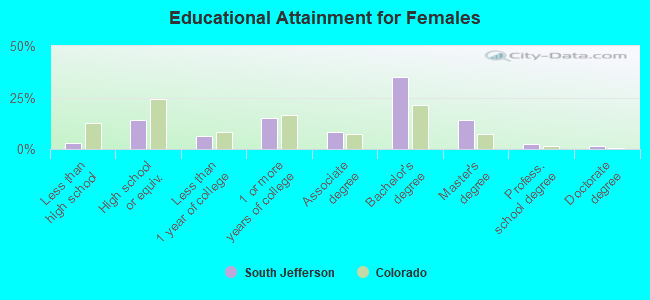
Education attainment for females 25 years and older:
- No schooling: 10
- Nursery to 4th grade: 0
- 5th and 6th grade: 8
- 7th and 8th grade: 26
- 9th grade: 7
- 10th grade: 60
- 11th grade: 44
- 12th grade, no diploma: 58
- High school graduate (or equivalency): 1,068
- Less than 1 year of college: 479
- Some college more than 1 year, no degree: 1,163
- Associate degree: 640
- Bachelor's degree: 2,692
- Master's degree: 1,096
- Professional school degree: 202
- Doctorate degree: 99
Housing units in structures:
- One, detached: 8,724
- One, attached: 268
- Two: 20
- 10 to 19: 12
- 50 or more: 15
- Mobile homes: 60
- Boats, RVs, vans, etc.: 10
Median worth of mobile homes: $929,697
Housing units lacking complete kitchen facilities: 3.2%
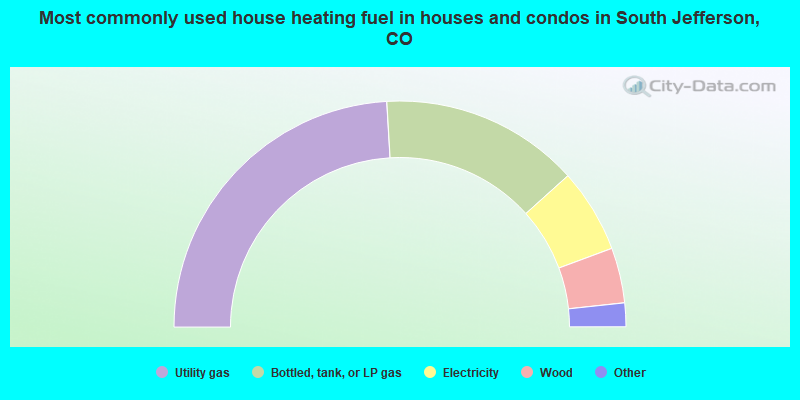
- 48.1%Utility gas
- 28.5%Bottled, tank, or LP gas
- 12.0%Electricity
- 7.9%Wood
- 2.1%Other fuel
- 0.8%Fuel oil, kerosene, etc.
- 0.4%Solar energy
- 0.1%No fuel used
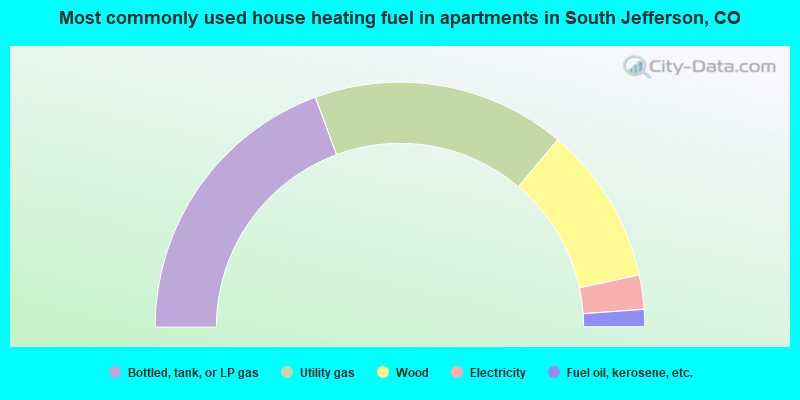
- 38.8%Bottled, tank, or LP gas
- 33.5%Utility gas
- 20.9%Wood
- 4.5%Electricity
- 2.3%Fuel oil, kerosene, etc.
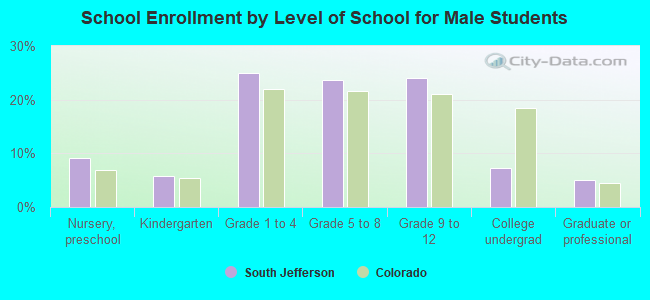
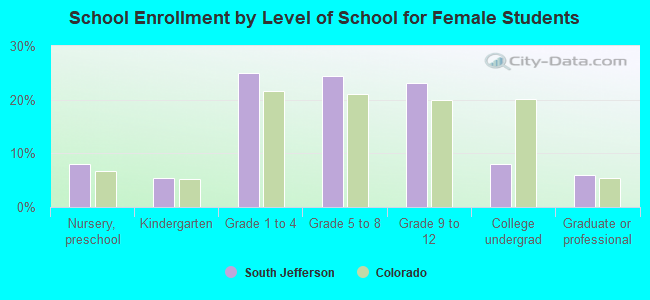
Private vs. public school enrollment:
| Here: | 13.6% |
| Colorado: | 8.8% |
| Here: | 11.9% |
| Colorado: | 7.9% |
| Here: | 26.7% |
| Colorado: | 16.7% |