Spring Valley, NV (Nevada) Houses and Residents
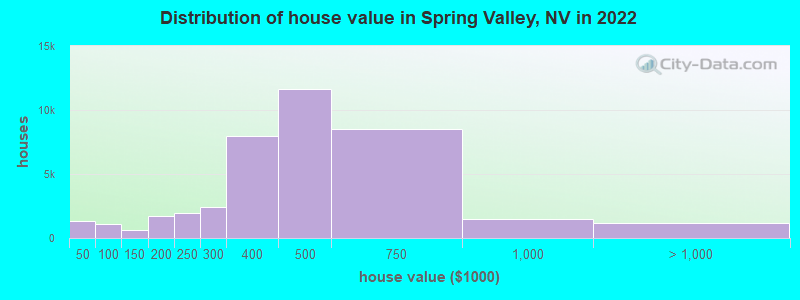
Estimated median house or condo value in 2022: $427,300 (it was $140,900 in 2000 )
Spring Valley:
$427,300Nevada:
$434,700
Lower value quartile - upper value quartile: $316,300 - $540,400Mean price in 2022: Detached houses: $537,421 Here:
$537,421State:
$549,327
Townhouses or other attached units: $387,530 Here:
$387,530State:
$328,893
In 2-unit structures: $279,966 Here:
$279,966State:
$326,466
In 3-to-4-unit structures: $187,696 Here:
$187,696State:
$295,216
In 5-or-more-unit structures: $175,057 Here:
$175,057State:
$297,847
Mobile homes: $99,387 Here:
$99,387State:
$159,995
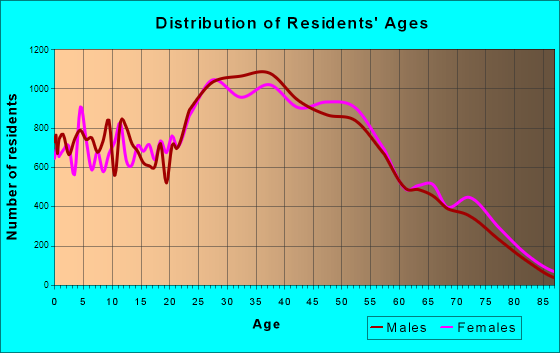
Total population: 178,395 (Urban population: 115,841, Rural population: 1,808 (all nonfarm) )
Houses: 94,505 (85,323 occupied: 39,286 owner occupied, 46,037 renter occupied )
% of renters here:
54%State:
40%
Housing density: 2,833 houses/condos per square mile
Median price asked for vacant for-sale houses and condos in 2022: $633,562.
Median contract rent in 2022: $1,444 (lower quartile is $1,161, upper quartile is $1,823)
Median rent asked for vacant for-rent units in 2022: $1,347
Median gross rent in Spring Valley, NV in 2022: $1,608
Housing units in Spring Valley with a mortgage: 25,745 (1,872 second mortgage, 377 home equity loan, 1,144 both second mortgage and home equity loan )Houses without a mortgage: 269
Median household income for houses/condos with a mortgage: $96,477
Median household income for apartments without a mortgage: $80,568
Median monthly housing costs: $1,501
Data:
Median house or condo value ($)
Median house or condo value ($ change since 2000)
Median house or condo value ($) - White
Median house or condo value ($) - Black or African American
Median house or condo value ($) - Asian
Median house or condo value ($) - Hispanic or Latino
Median house or condo value ($) - American Indian and Alaska Native
Median house or condo value ($) - Multirace
Median house or condo value ($) - Other Race
Median price asked for mobile homes ($)
Household density (households per square mile)
Mean house or condo value by units in structure - 1, detached ($)
Mean house or condo value by units in structure - 1, attached ($)
Mean house or condo value by units in structure - 2 ($)
Mean house or condo value by units in structure by units in structure - 3 or 4 ($)
Mean house or condo value by units in structure - 5 or more ($)
Mean house or condo value by units in structure - Boat, RV, van, etc. ($)
Mean house or condo value by units in structure - Mobile home ($)
Median contract rent ($)
Median contract rent - Lower quartile ($)
Median contract rent - Upper quartile ($)
Median gross rent ($)
Urban houses (%)
Rural houses (%)
Houses occupied (%)
Houses occupied (% change since 2000)
Houses owner occupied (%)
Houses owner occupied (% change since 2000)
Houses renter occupied (%)
Houses renter occupied (% change since 2000)
Vacant housing units - For rent (%)
Vacant housing units - For rent (% change since 2000)
Vacant housing units - For sale only (%)
Vacant housing units - For sale only (% change since 2000)
Vacant housing units - Rented or sold, not occupied (%)
Vacant housing units - Rented or sold, not occupied (% change since 2000)
Vacant housing units - For seasonal, recreational, or occasional use (%)
Vacant housing units - For seasonal, recreational, or occasional use (% change since 2000)
Vacant housing units - For migrant workers (%)
Vacant housing units - For migrant workers (% change since 2000)
Vacant housing units - Other vacant (%)
Vacant housing units - Other vacant (% change since 2000)
Median monthly housing costs ($)
Median household income for houses/condos with a mortgage ($)
Median household income for houses/condos without a mortgage ($)
Median household income ($)
Median household income ($) - White
Median household income ($) - Black or African American
Median household income ($) - Asian
Median household income ($) - Hispanic or Latino
Median household income ($) - American Indian and Alaska Native
Median household income ($) - Multirace
Median household income ($) - Other Race
Mortgage status - with mortgage (%)
Mortgage status - with second mortgage (%)
Mortgage status - with home equity loan (%)
Mortgage status - with both second mortgage and home equity loan (%)
Mortgage status - without a mortgage (%)
Median year house/condo built
Median year apartment built
Household type by relationship - Male householder living alone (%)
Household type by relationship - Male householder not living alone (%)
Household type by relationship - Female householder living alone (%)
Household type by relationship - Female householder not living alone (%)
Household type by relationship - Opposite-Sex spouse (%)
Household type by relationship - Same-Sex spouse (%)
Household type by relationship - Opposite-Sex unmarried partner (%)
Household type by relationship - Same-Sex unmarried partner (%)
Household type by relationship - In group quarters (%)
Size of family households - 2-person household (%)
Size of family households - 3-person household (%)
Size of family households - 4-person household (%)
Size of family households - 5-person household (%)
Size of family households - 6-person household (%)
Size of family households - 7-or-more-person household (%)
Size of nonfamily households - 1-person household (%)
Size of nonfamily households - 2-person household (%)
Size of nonfamily households - 3-person household (%)
Size of nonfamily households - 4-person household (%)
Size of nonfamily households - 5-person household (%)
Size of nonfamily households - 6-person household (%)
Size of nonfamily households - 7-or-moreperson household (%)
Year house built - Built 2010 or later (%)
Year house built - Built 2000 to 2009 (%)
Year house built - Built 1990 to 1999 (%)
Year house built - Built 1980 to 1989 (%)
Year house built - Built 1970 to 1979 (%)
Year house built - Built 1960 to 1969 (%)
Year house built - Built 1950 to 1959 (%)
Year house built - Built 1940 to 1949 (%)
Year house built - Built 1939 or earlier (%)
Median number of rooms in houses and condos
Median number of rooms in apartments
Median number of bedrooms in owner occupied houses
Mean number of bedrooms in owner occupied houses
Median number of bedrooms in renter occupied houses
Mean number of bedrooms in renter occupied houses
Median number of vehichles in owner occupied houses
Mean number of vehichles in owner occupied houses
Median number of vehichles in renter occupied houses
Mean number of vehichles in renter occupied houses
Rooms in owner-occupied houses - 1 room (%)
Rooms in owner-occupied houses - 2 rooms (%)
Rooms in owner-occupied houses - 3 rooms (%)
Rooms in owner-occupied houses - 4 rooms (%)
Rooms in owner-occupied houses - 5 rooms (%)
Rooms in owner-occupied houses - 6 rooms (%)
Rooms in owner-occupied houses - 7 rooms (%)
Rooms in owner-occupied houses - 8 rooms (%)
Rooms in owner-occupied houses - 9+ rooms (%)
Rooms in renter-occupied houses - 1 room (%)
Rooms in renter-occupied houses - 2 rooms (%)
Rooms in renter-occupied houses - 3 rooms (%)
Rooms in renter-occupied houses - 4 rooms (%)
Rooms in renter-occupied houses - 5 rooms (%)
Rooms in renter-occupied houses - 6 rooms (%)
Rooms in renter-occupied houses - 7 rooms (%)
Rooms in renter-occupied houses - 8 rooms (%)
Rooms in renter-occupied houses - 9+ rooms (%)
Bedrooms in owner-occupied houses - no bedrooms (%)
Bedrooms in owner-occupied houses - 1 bedroom (%)
Bedrooms in owner-occupied houses - 2 bedrooms (%)
Bedrooms in owner-occupied houses - 3 bedrooms (%)
Bedrooms in owner-occupied houses - 4 bedrooms (%)
Bedrooms in owner-occupied houses - 5+ bedrooms (%)
Bedrooms in renter-occupied houses - no bedrooms (%)
Bedrooms in renter-occupied houses - 1 bedroom (%)
Bedrooms in renter-occupied houses - 2 bedrooms (%)
Bedrooms in renter-occupied houses - 3 bedrooms (%)
Bedrooms in renter-occupied houses - 4 bedrooms (%)
Bedrooms in renter-occupied houses - 5+ bedrooms (%)
Vehicles available in owner-occupied houses - no vehicle available (%)
Vehicles available in owner-occupied houses - 1 vehicle available(%)
Vehicles available in owner-occupied houses - 2 Vehicles available (%)
Vehicles available in owner-occupied houses - 3 Vehicles available (%)
Vehicles available in owner-occupied houses - 4 Vehicles available (%)
Vehicles available in owner-occupied houses - 5+ Vehicles available (%)
Vehicles available in renter-occupied houses - no vehicle available (%)
Vehicles available in renter-occupied houses - 1 vehicle available (%)
Vehicles available in renter-occupied houses - 2 Vehicles available (%)
Vehicles available in renter-occupied houses - 3 Vehicles available (%)
Vehicles available in renter-occupied houses - 4 Vehicles available (%)
Vehicles available in renter-occupied houses - 5+ Vehicles available (%)
Housing units in structures - 1, detached (%)
Housing units in structures - 1, attached (%)
Housing units in structures - 2 (%)
Housing units in structures - 3 or 4 (%)
Housing units in structures - 5 to 9 (%)
Housing units in structures - 10 to 19 (%)
Housing units in structures - 20 to 49 (%)
Housing units in structures - 50 or more (%)
Housing units in structures - Mobile home (%)
Housing units in structures - Boat, RV, van, etc. (%)
Housing units in structures - Owners - 1, detached (%)
Housing units in structures - Owners - 1, attached (%)
Housing units in structures - Owners - 2 (%)
Housing units in structures - Owners - 3 or 4 (%)
Housing units in structures - Owners - 5 to 9 (%)
Housing units in structures - Owners - 10 to 19 (%)
Housing units in structures - Owners - 20 to 49 (%)
Housing units in structures - Owners - 50 or more (%)
Housing units in structures - Owners - Mobile home (%)
Housing units in structures - Owners - Boat, RV, van, etc. (%)
Housing units in structures - Renters - 1, detached (%)
Housing units in structures - Renters - 1, attached (%)
Housing units in structures - Renters - 2 (%)
Housing units in structures - Renters - 3 or 4 (%)
Housing units in structures - Renters - 5 to 9 (%)
Housing units in structures - Renters - 10 to 19 (%)
Housing units in structures - Renters - 20 to 49 (%)
Housing units in structures - Renters - 50 or more (%)
Housing units in structures - Renters - Mobile home (%)
Housing units in structures - Renters - Boat, RV, van, etc. (%)
House/condo owner moved in on average (years ago)
Renter moved in on average (years ago)
Year householder moved into unit - Moved in 1999 to March 2000 (%)
Year householder moved into unit - Moved in 1999 to March 2000 (%) - White
Year householder moved into unit - Moved in 1999 to March 2000 (%) - Black or African American
Year householder moved into unit - Moved in 1999 to March 2000 (%) - Asian
Year householder moved into unit - Moved in 1999 to March 2000 (%) - Hispanic or Latino
Year householder moved into unit - Moved in 1999 to March 2000 (%) - American Indian and Alaska Native
Year householder moved into unit - Moved in 1999 to March 2000 (%) - Multirace
Year householder moved into unit - Moved in 1999 to March 2000 (%) - Other Race
Year householder moved into unit - Moved in 1995 to 1998 (%)
Year householder moved into unit - Moved in 1995 to 1998 (%) - White
Year householder moved into unit - Moved in 1995 to 1998 (%) - Black or African American
Year householder moved into unit - Moved in 1995 to 1998 (%) - Asian
Year householder moved into unit - Moved in 1995 to 1998 (%) - Hispanic or Latino
Year householder moved into unit - Moved in 1995 to 1998 (%) - American Indian and Alaska Native
Year householder moved into unit - Moved in 1995 to 1998 (%) - Multirace
Year householder moved into unit - Moved in 1995 to 1998 (%) - Other Race
Year householder moved into unit - Moved in 1990 to 1994 (%)
Year householder moved into unit - Moved in 1990 to 1994 (%) - White
Year householder moved into unit - Moved in 1990 to 1994 (%) - Black or African American
Year householder moved into unit - Moved in 1990 to 1994 (%) - Asian
Year householder moved into unit - Moved in 1990 to 1994 (%) - Hispanic or Latino
Year householder moved into unit - Moved in 1990 to 1994 (%) - American Indian and Alaska Native
Year householder moved into unit - Moved in 1990 to 1994 (%) - Multirace
Year householder moved into unit - Moved in 1990 to 1994 (%) - Other Race
Year householder moved into unit - Moved in 1980 to 1989 (%)
Year householder moved into unit - Moved in 1980 to 1989 (%) - White
Year householder moved into unit - Moved in 1980 to 1989 (%) - Black or African American
Year householder moved into unit - Moved in 1980 to 1989 (%) - Asian
Year householder moved into unit - Moved in 1980 to 1989 (%) - Hispanic or Latino
Year householder moved into unit - Moved in 1980 to 1989 (%) - American Indian and Alaska Native
Year householder moved into unit - Moved in 1980 to 1989 (%) - Multirace
Year householder moved into unit - Moved in 1980 to 1989 (%) - Other Race
Year householder moved into unit - Moved in 1970 to 1979 (%)
Year householder moved into unit - Moved in 1970 to 1979 (%) - White
Year householder moved into unit - Moved in 1970 to 1979 (%) - Black or African American
Year householder moved into unit - Moved in 1970 to 1979 (%) - Asian
Year householder moved into unit - Moved in 1970 to 1979 (%) - Hispanic or Latino
Year householder moved into unit - Moved in 1970 to 1979 (%) - American Indian and Alaska Native
Year householder moved into unit - Moved in 1970 to 1979 (%) - Multirace
Year householder moved into unit - Moved in 1970 to 1979 (%) - Other Race
Year householder moved into unit - Moved in 1969 or earlier (%)
Year householder moved into unit - Moved in 1969 or earlier (%) - White
Year householder moved into unit - Moved in 1969 or earlier (%) - Black or African American
Year householder moved into unit - Moved in 1969 or earlier (%) - Asian
Year householder moved into unit - Moved in 1969 or earlier (%) - Hispanic or Latino
Year householder moved into unit - Moved in 1969 or earlier (%) - American Indian and Alaska Native
Year householder moved into unit - Moved in 1969 or earlier (%) - Multirace
Year householder moved into unit - Moved in 1969 or earlier (%) - Other Race
Housing units lacking complete plumbing facilities (%)
Housing units lacking complete kitchen facilities (%)
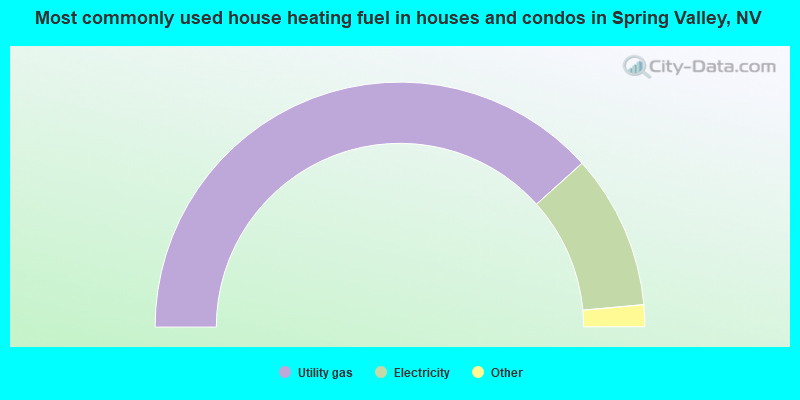
House heating fuel used in houses and condos - Utility gas (%)
House heating fuel used in houses and condos - Bottled, tank, or LP gas (%)
House heating fuel used in houses and condos - Electricity (%)
House heating fuel used in houses and condos - Fuel oil, kerosene, etc. (%)
House heating fuel used in houses and condos - Coal or coke (%)
House heating fuel used in houses and condos - Wood (%)
House heating fuel used in houses and condos - Solar energy (%)
House heating fuel used in houses and condos - Other fuel (%)
House heating fuel used in houses and condos - No fuel used (%)
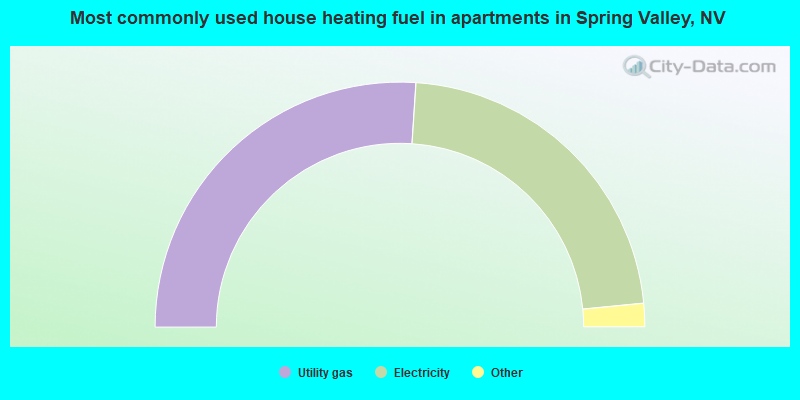
House heating fuel used in apartments - Utility gas (%)
House heating fuel used in apartments - Bottled, tank, or LP gas (%)
House heating fuel used in apartments - Electricity (%)
House heating fuel used in apartments - Fuel oil, kerosene, etc. (%)
House heating fuel used in apartments - Coal or coke (%)
House heating fuel used in apartments - Wood (%)
House heating fuel used in apartments - Solar energy (%)
House heating fuel used in apartments - Other fuel (%)
House heating fuel used in apartments - No fuel used (%)
Median year house/condo built: 1998Median year apartment built: 1998Household type by relationship:
Households: 220,707
Male householders: 46,407 (15,761 living alone ), Female householders: 38,916 (10,663 living alone )32,826 spouses (31,590 opposite-sex spouses ), 7,580 unmarried partners , (7,075 opposite-sex unmarried partners ), 58,840 children (55,141 natural , 959 adopted , 2,740 stepchildren ), 5,128 grandchildren , 5,502 brothers or sisters , 6,446 parents , 81 foster children , 7,152 other relatives , 11,291 non-relatives In group quarters: 538
Size of family households: 20,296 2-persons , 13,174 3-persons , 7,669 4-persons , 6,074 5-persons , 2,562 6-persons , 1,179 7-or-more-persons .
Size of nonfamily households: 26,424 1-person , 6,530 2-persons , 1,126 3-persons , 144 4-persons , 145 5-persons .
23,550 married couples with children. single-parent households (5,463 men , 9,045 women ).
59.8% of residents of Spring Valley speak English at home. of residents speak Spanish at home (51% speak English very well , 24% speak English well , 18% speak English not well , 8% don't speak English at all ).of residents speak other Indo-European language at home (72% speak English very well , 19% speak English well , 9% speak English not well ).of residents speak Asian or Pacific Island language at home (57% speak English very well , 23% speak English well , 16% speak English not well , 4% don't speak English at all ).of residents speak other language at home (52% speak English very well , 35% speak English well , 9% speak English not well , 4% don't speak English at all ).
Foreign born population: 63,810 (28.9%)of them are naturalized citizens )
Median number of rooms in houses and condos:
Median number of rooms in apartments
Owner-occupied Renter-occupied
Bedrooms in owner-occupied houses and condos in Spring Valley, Nevada
128 no bedroom 1,063 1 bedroom 6,989 2 bedrooms 18,517 3 bedrooms 10,243 4 bedrooms 2,346 5+ bedrooms
Bedrooms in renter-occupied apartments in Spring Valley, Nevada
1,399 no bedroom 11,019 1 bedroom 17,392 2 bedrooms 9,665 3 bedrooms 4,740 4 bedrooms 1,822 5+ bedrooms
Owner-occupied Renter-occupied
Rooms in owner-occupied houses in Spring Valley, Nevada
0 1 room 252 2 rooms 2,955 3 rooms 5,704 4 rooms 8,965 5 rooms 8,499 6 rooms 4,454 7 rooms 3,784 8 rooms 4,673 9+ rooms
Rooms in renter-occupied apartments in Spring Valley, Nevada
1,248 1 room 4,434 2 rooms 7,749 3 rooms 13,382 4 rooms 6,788 5 rooms 5,984 6 rooms 2,252 7 rooms 1,984 8 rooms 2,216 9+ rooms
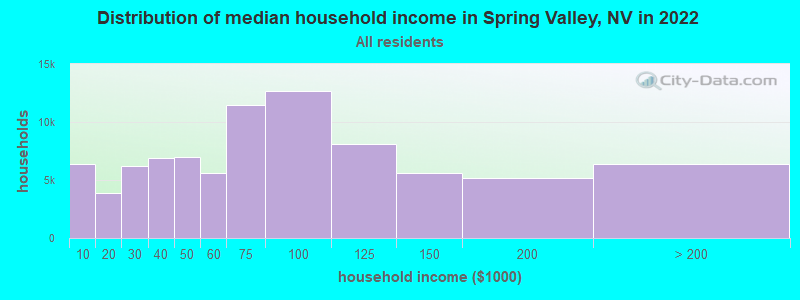
Spring Valley, NV household income distribution 6,412 Less than $10,0003,840 $10,000 to $19,9996,206 $20,000 to $29,9996,889 $30,000 to $39,9996,983 $40,000 to $49,9995,602 $50,000 to $59,99911,500 $60,000 to $74,99912,689 $75,000 to $99,9998,070 $100,000 to $124,9995,563 $125,000 to $149,9995,189 $150,000 to $199,9996,380 $200,000 or more
Home value of owner - occupied houses in 2022 in Spring Valley, NV 323 Less than $10,000215 $20,000 to $24,99972 $25,000 to $29,999148 $30,000 to $34,99953 $35,000 to $39,999485 $40,000 to $49,99974 $60,000 to $69,99961 $70,000 to $79,999283 $80,000 to $89,999182 $90,000 to $99,999415 $100,000 to $124,999185 $125,000 to $149,999495 $150,000 to $174,9991,196 $175,000 to $199,9991,949 $200,000 to $249,9992,393 $250,000 to $299,9997,940 $300,000 to $399,99911,619 $400,000 to $499,9998,512 $500,000 to $749,9991,495 $750,000 to $999,999829 $1,000,000 to $1,499,999207 $1,500,000 to $1,999,999155 $2,000,000 or moreRent paid by renters in 2022 in Spring Valley, NV 12 Less than $10026 $100 to $149102 $150 to $19959 $200 to $249108 $250 to $29956 $300 to $34952 $350 to $39930 $400 to $44912 $450 to $49978 $500 to $549148 $550 to $59992 $600 to $64960 $650 to $699229 $700 to $749276 $750 to $7991,109 $800 to $8991,931 $900 to $99910,354 $1,000 to $1,24910,306 $1,250 to $1,49914,209 $1,500 to $1,9993,975 $2,000 to $2,499767 $2,500 to $2,999546 $3,000 to $3,49964 $3,500 or more566 No cash rent
Percentage of workers working in this county: 98.1%Number of people working at home: 16,228 (14.3% of all workers )
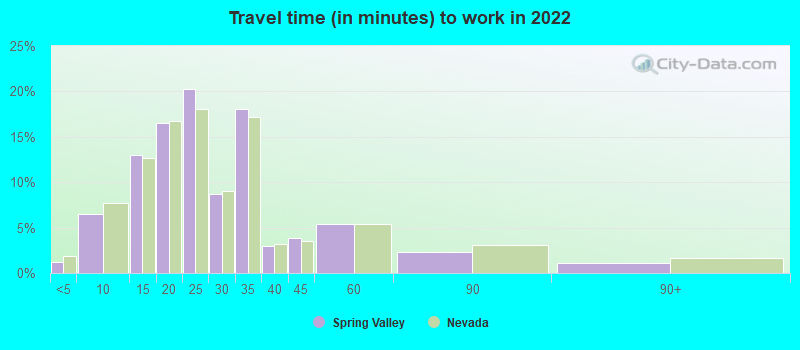
Travel time to work (commute)
Less than 5 minutes: 1,2325 to 9 minutes: 4,97510 to 14 minutes: 12,37615 to 19 minutes: 21,13120 to 24 minutes: 20,52625 to 29 minutes: 9,85430 to 34 minutes: 16,63835 to 39 minutes: 2,12040 to 44 minutes: 2,50145 to 59 minutes: 3,55060 to 89 minutes: 1,59090 or more minutes: 566
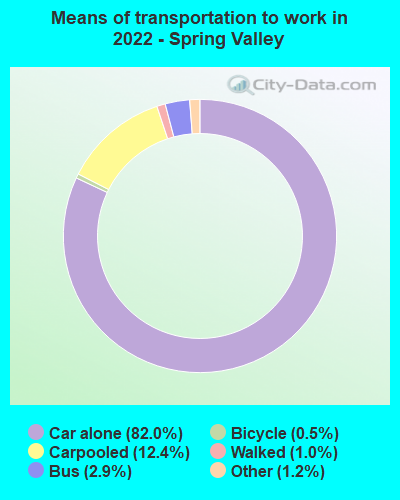
Means of transportation to work:
Drove a car alone: 49,421 (64.6%)Carpooled: 7,456 (9.7%)Bus : 1,749 (2.3%)Taxi: 751 (1.0%)Bicycle: 281 (0.4%)Walked: 611 (0.8%)Worked at home: 16,228 (21.2%)
Unemployment by race in 2022
Unemployment rate for White non-Hispanic residents 8.2% Males3.6% FemalesUnemployment rate for Black residents 11.5% Males9.3% FemalesUnemployment rate for American Indian and Alaska Native residents 6.1% Males6.6% FemalesUnemployment rate for Asian residents 6.5% Males4.2% FemalesUnemployment rate for other race residents 2.7% Males5.8% FemalesUnemployment rate for two or more race residents 7.4% Males9.4% FemalesUnemployment rate for Hispanic or Latino residents 4.2% Males6.6% Females
Year of entry for the foreign-born population in Spring Valley, Nevada
21,754 2010 or later 15,516 2000 to 2009 10,352 1990 to 1999 6,481 1980 to 1989 4,118 1970 to 1979 3,219 Before 1970
First ancestries reported:
Italian: 4,720 (3.5%)
German: 4,293 (3.2%)
Ethiopian: 4,236 (3.1%)
American: 4,159 (3.1%)
Irish: 3,630 (2.7%)
English: 3,277 (2.4%)
Serbian: 1,966 (1.5%)
African: 1,478 (1.1%)
European: 1,471 (1.1%)
Polish: 1,263 (0.9%)
Armenian: 1,102 (0.8%)
Iranian: 1,088 (0.8%)
French: 909 (0.7%)
Russian: 837 (0.6%)
Norwegian: 634 (0.5%)
Scottish: 580 (0.4%)
Hungarian: 524 (0.4%)
Ukrainian: 512 (0.4%)
Moroccan: 418 (0.3%)
Greek: 386 (0.3%)
Eastern European: 377 (0.3%)
Romanian: 346 (0.3%)
Ghanaian: 299 (0.2%)
French Canadian: 283 (0.2%)
Dutch: 282 (0.2%)
Bulgarian: 280 (0.2%)
British: 278 (0.2%)
Scotch-Irish: 268 (0.2%)
Yugoslavian: 264 (0.2%)
Syrian: 260 (0.2%)
Swedish: 238 (0.2%)
Egyptian: 220 (0.2%)
Lebanese: 189 (0.1%)
Israeli: 179 (0.1%)
Danish: 179 (0.1%)
Sierra Leonean: 178 (0.1%)
Australian: 172 (0.1%)
Arab: 164 (0.1%)
Afghan: 161 (0.1%)
Slovak: 147 (0.1%)
Jamaican: 134 (0.10%)
Portuguese: 125 (0.09%)
South African: 124 (0.09%)
Welsh: 119 (0.09%)
Canadian: 114 (0.08%)
Belgian: 110 (0.08%)
Scandinavian: 109 (0.08%)
Czech: 86 (0.06%)
Brazilian: 85 (0.06%)
Latvian: 84 (0.06%)
Nigerian: 78 (0.06%)
Palestinian: 76 (0.06%)
Haitian: 67 (0.05%)
Austrian: 64 (0.05%)
Turkish: 61 (0.05%)
Trinidadian and Tobagonian: 58 (0.04%)
Bahamian: 57 (0.04%)
Kenyan: 52 (0.04%)
Basque: 40 (0.03%)
Lithuanian: 38 (0.03%)
Slavic: 37 (0.03%)
Swiss: 36 (0.03%)
West Indian: 34 (0.03%)
Iraqi: 28 (0.02%)
Finnish: 26 (0.02%)
Cajun: 26 (0.02%)
Jordanian: 26 (0.02%)
Czechoslovakian: 24 (0.02%)
Macedonian: 24 (0.02%)
Croatian: 23 (0.02%)
Belizean: 20 (0.01%)
Sudanese: 19 (0.01%)
Northern European: 16 (0.01%)
Slovene: 13 (0.01%)
Icelander: 10 (0.01%)
Maltese: 9 (0.01%)
Most common places of birth for foreign-born residents (%): Philippines Spring Valley:
17.1% (11,114)Nevada:
15.5% (91,628)
Mexico Spring Valley:
14.9% (9,652)Nevada:
36.8% (218,248)
China, excluding Hong Kong and Taiwan Spring Valley:
10.2% (6,629)Nevada:
3.3% (19,621)
Ethiopia Spring Valley:
7.5% (4,891)Nevada:
1.8% (10,683)
Cuba Spring Valley:
4.2% (2,741)Nevada:
4.2% (24,711)
Vietnam Spring Valley:
3.8% (2,498)Nevada:
2.0% (11,718)
Korea Spring Valley:
3.8% (2,488)Nevada:
1.8% (10,941)
Iran Spring Valley:
2.2% (1,459)Nevada:
0.9% (5,149)
Taiwan Spring Valley:
2.0% (1,315)Nevada:
0.9% (5,094)
El Salvador Spring Valley:
2.0% (1,270)Nevada:
4.0% (23,923)
Thailand Spring Valley:
1.9% (1,243)Nevada:
1.0% (5,914)
Canada Spring Valley:
1.8% (1,140)Nevada:
1.9% (11,407)
Hong Kong Spring Valley:
1.7% (1,113)Nevada:
0.5% (2,721)
Bosnia and Herzegovina Spring Valley:
1.5% (1,003)Nevada:
0.3% (1,563)
Place of birth for U.S.-born residents:
This state: 52,523Other state: 95,310Northeast: 15,429Midwest: 17,499South: 14,687West: 47,695 85.8% of Spring Valley residents lived in the same house 1 years ago.
Out of people who lived in different houses, 40.8% lived in this county.
Out of people who lived in different counties, 1.0% lived in Nevada.
Spring Valley:
85.8%State average:
86.4%
Education attainment for males 25 years and older:
No schooling: 2,928Nursery to 4th grade: 1295th and 6th grade: 5737th and 8th grade: 8099th grade: 41410th grade: 84111th grade: 1,66712th grade, no diploma: 2,838High school graduate (or equivalency): 23,069Less than 1 year of college: 7,226Some college more than 1 year, no degree: 10,949Associate degree: 4,875Bachelor's degree: 16,072Master's degree: 4,133Professional school degree: 1,908Doctorate degree: 679
Education attainment for females 25 years and older:
No schooling: 2,242Nursery to 4th grade: 3225th and 6th grade: 7617th and 8th grade: 3289th grade: 82710th grade: 1,42611th grade: 79112th grade, no diploma: 2,317High school graduate (or equivalency): 21,408Less than 1 year of college: 5,722Some college more than 1 year, no degree: 11,401Associate degree: 6,354Bachelor's degree: 14,998Master's degree: 5,547Professional school degree: 808Doctorate degree: 858
Housing units in structures:
One, detached: 46,672One, attached: 5,554Two: 1,8373 or 4: 5,5425 to 9: 7,45810 to 19: 9,24220 to 49: 2,67850 or more: 12,774Mobile homes: 2,570Boats, RVs, vans, etc.: 178Median worth of mobile homes: $90,300
Housing units lacking complete plumbing facilities in 2022: 0.4%Housing units lacking complete kitchen facilities in 2022: 1.0%House/condo owner moved in on average 8 years ago
Renter moved in on average 2 years ago
Private vs. public school enrollment:
Students in private schools in grades 1 to 8 (elementary and middle school): 3,206 Students in private schools in grades 9 to 12 (high school): 976 Students in private undergraduate colleges: 1,031