St. Charles, MD (Maryland) Houses and Residents
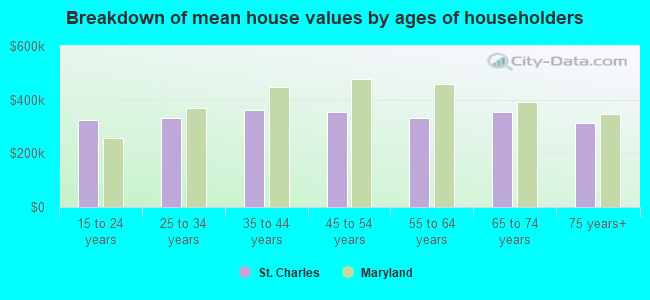
| St. Charles: | $353,434 |
| Maryland: | $398,100 |
Total population: 38,740 (Urban population: 33,404, Rural population: 29 (all nonfarm))
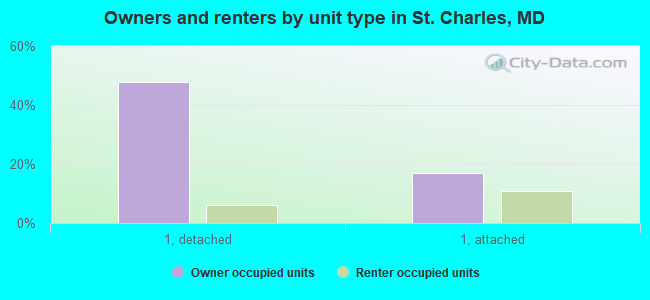
Houses: 12,071 (11,577 occupied: 7,541 owner occupied, 4,036 renter occupied)
| % of renters here: | 35% |
| State: | 32% |
Housing density: 1,023 houses/condos per square mile
Median price asked for vacant for-sale houses and condos in 2022 in this county: $340,254.
Median contract rent in 2022: $1,693 (lower quartile is $1,033, upper quartile is over $2,000)
Median rent asked for vacant for-rent units in 2022: $1,619
Median gross rent in St. Charles, MD in 2022: $1,866
Housing units in St. Charles with a mortgage: 6,847 (969 second mortgage, 665 home equity loan, 4 both second mortgage and home equity loan)
Houses without a mortgage: 402
Compare current foreclosures near St. Charles, MD:
| Photo | Address | Area | Beds / Baths | Price | Details |
|---|---|---|---|---|---|

|
#1
Pickett Dr
Suitland, MD 20746
|
1,296 sq. feet
|
1 baths 2 beds |
$358,900
|
show details |

|
#2
Old Fort Rd
Fort Washington, MD 20744
|
721 sq. feet
|
1 baths 2 beds |
$179,900
|
show details |

|
#3
Carousel Ct
Upper Marlboro, MD 20772
|
2,112 sq. feet
|
2 baths 3 beds |
$412,000
|
show details |

|
#4
Wills Rd
Bel Alton, MD 20611
|
1,444 sq. feet
|
2 baths 3 beds |
$275,000
|
show details |

|
#5
Bannister Cir
Waldorf, MD 20602
|
1,196 sq. feet
|
3 baths 4 beds |
$449,900
|
show details |

|
#6
Greenwood Pl
Indian Head, MD 20640
|
912 sq. feet
|
1 baths 2 beds |
$104,900
|
show details |

|
#7
Hunting Creek Rd
Huntingtown, MD 20639
|
1,170 sq. feet
|
2 baths 2 beds |
$282,150
|
show details |

|
#8
Brooke Ln
Upper Marlboro, MD 20772
|
- sq. feet
|
5 baths 6 beds |
$949,000
|
show details |

|
#9
Wheeling Ave
Upper Marlboro, MD 20772
|
1,918 sq. feet
|
3 baths 4 beds |
show details | |

|
#10
Herring Creek Dr
Accokeek, MD 20607
|
2,636 sq. feet
|
3 baths 4 beds |
show details |
| Photo | Address | Area | Beds / Baths | Price | Details |
|---|---|---|---|---|---|

|
#11
Edelen Dr
Bryantown, MD 20617
|
2,822 sq. feet
|
3 baths 4 beds |
show details | |

|
#12
Peanuts Ln
Waldorf, MD 20602
|
- sq. feet
|
2 baths 3 beds |
show details | |

|
#13
Litton Ln
Accokeek, MD 20607
|
816 sq. feet
|
2 baths 3 beds |
show details | |

|
#14
Berrybrook Ter
Upper Marlboro, MD 20772
|
2,319 sq. feet
|
3 baths 5 beds |
show details | |

|
#15
Chadsey Ln
Brandywine, MD 20613
|
2,480 sq. feet
|
3 baths 4 beds |
show details | |

|
#16
S Faulkner Rd
Faulkner, MD 20632
|
1,512 sq. feet
|
2 baths 3 beds |
show details | |

|
#17
Penns Hill Rd
La Plata, MD 20646
|
2,702 sq. feet
|
2 baths 4 beds |
show details | |

|
#18
Petzold Dr
Waldorf, MD 20601
|
1,784 sq. feet
|
2 baths 4 beds |
show details | |

|
#19
English Ct
Suitland, MD 20746
|
1,296 sq. feet
|
2 baths 3 beds |
show details | |

|
#20
Barnaby St SE
Washington, DC 20032
|
2,092 sq. feet
|
2 baths 4 beds |
show details |
| Photo | Address | Area | Beds / Baths | Price | Details |
|---|---|---|---|---|---|

|
#21
Scottsdale Pl
Waldorf, MD 20602
|
2,068 sq. feet
|
3 baths 3 beds |
show details | |

|
#22
Poplarwood Ct
Waldorf, MD 20601
|
1,080 sq. feet
|
2 baths 3 beds |
show details | |

|
#23
Trent St
Clinton, MD 20735
|
1,080 sq. feet
|
2 baths 3 beds |
show details | |

|
#24
Summerwood Ln
Accokeek, MD 20607
|
3,774 sq. feet
|
5 baths 4 beds |
show details | |

|
#25
Redwood Ter
Temple Hills, MD 20748
|
1,188 sq. feet
|
3 baths 3 beds |
show details | |

|
#26
Birdsong Dr
Fort Washington, MD 20744
|
2,406 sq. feet
|
2 baths 4 beds |
show details | |

|
#27
Douglas Cir
Mechanicsville, MD 20659
|
1,134 sq. feet
|
2 baths 3 beds |
show details | |

|
#28
Lake Hill Ct
Waldorf, MD 20603
|
1,948 sq. feet
|
2 baths 3 beds |
show details | |

|
#29
Wahler Pl SE
Washington, DC 20032
|
1,364 sq. feet
|
2 baths 3 beds |
show details | |

|
#30
Bittersweet Dr
Hughesville, MD 20637
|
2,249 sq. feet
|
2 baths 3 beds |
show details |
| Photo | Address | Area | Beds / Baths | Price | Details |
|---|---|---|---|---|---|

|
#31
Baileys Pond Rd
Accokeek, MD 20607
|
4,677 sq. feet
|
2 baths 7 beds |
show details | |

|
#32
N Royal St
Alexandria, VA 22314
|
- sq. feet
|
1 baths 1 beds |
show details | |

|
#33
Arbroath Dr
Clinton, MD 20735
|
1,432 sq. feet
|
2 baths 3 beds |
show details | |

|
#34
Ryon Ct
Waldorf, MD 20601
|
1,244 sq. feet
|
3 baths 3 beds |
show details | |

|
#35
Smallwood Dr
Hughesville, MD 20637
|
1,120 sq. feet
|
1 baths 3 beds |
show details | |

|
#36
Daniel Cir
Mechanicsville, MD 20659
|
1,332 sq. feet
|
2 baths 3 beds |
show details | |

|
#37
Windbreak Dr
Alexandria, VA 22306
|
1,360 sq. feet
|
3 baths 3 beds |
show details | |

|
#38
Oakside Ln
Indian Head, MD 20640
|
1,102 sq. feet
|
1 baths 3 beds |
show details | |

|
#39
Central Park Dr
Alexandria, VA 22309
|
1,408 sq. feet
|
3 baths 4 beds |
show details | |

|
#40
Kidd St
Alexandria, VA 22309
|
960 sq. feet
|
1 baths 3 beds |
show details |
| Photo | Address | Area | Beds / Baths | Price | Details |
|---|---|---|---|---|---|

|
#41
Gramercy Cir
Alexandria, VA 22309
|
1,408 sq. feet
|
3 baths 4 beds |
show details | |

|
#42
Saint Catherines Ln
Lorton, VA 22079
|
5,974 sq. feet
|
6 baths 5 beds |
show details | |

|
#43
Granite Ct
Waldorf, MD 20603
|
2,360 sq. feet
|
2 baths - beds |
show details | |

|
#44
King St
Alexandria, VA 22314
|
2,846 sq. feet
|
2 baths 3 beds |
show details | |

|
#45
Arendale Sq
Alexandria, VA 22309
|
1,408 sq. feet
|
2 baths 4 beds |
show details | |

|
#46
Madison St Apt 806
Alexandria, VA 22314
|
996 sq. feet
|
2 baths 1 beds |
show details | |

|
#47
Hillview Ave
Alexandria, VA 22310
|
988 sq. feet
|
1 baths 3 beds |
show details | |

|
#48
Telegraph Rd
Alexandria, VA 22310
|
1,475 sq. feet
|
2 baths 3 beds |
show details | |

|
#49
Mount Vernon Hwy
Alexandria, VA 22309
|
1,296 sq. feet
|
2 baths 4 beds |
show details | |

|
Check over 1 million property listings on Foreclosure.com!
|
browse all offers | |||

 | New Homes in St. Charles, MD (1 reply) |
| Looked at houses in Waldorf yesterday - expanding our search. (36 replies) |
| Looking to buy a house in Southern MD soon, HELP! (15 replies) |
| St. Charles, MD - Working in Southeast D.C. (3 replies) |
| Ryan Home in St. Charles Waldorf (7 replies) |
| PG county housing market bouncing back (54 replies) |
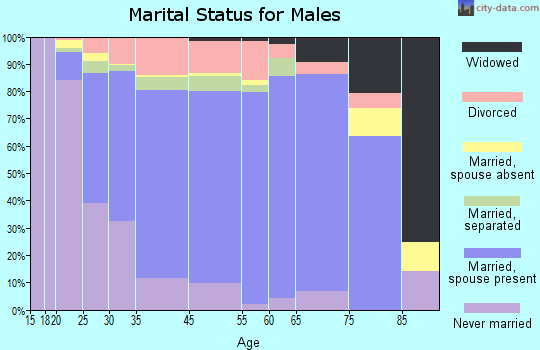
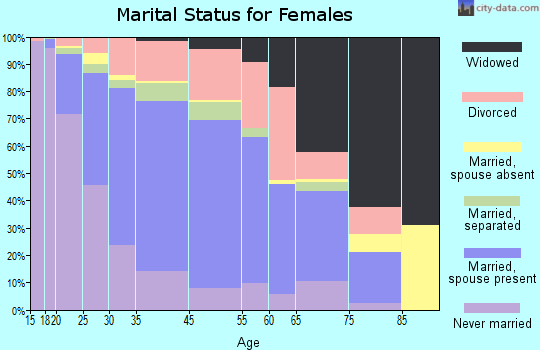
Household type by relationship:
Households: 145,146- In family households: 129,218 (25,516 male householders, 13,098 female householders)
27,772 spouses, 47,719 children (43,895 natural, 1,076 adopted, 2,748 stepchildren), 4,334 grandchildren, 1,551 brothers or sisters, 1,562 parents, foster children, 2,408 other relatives, 3,977 non-relatives
- In nonfamily households: 15,928 (5,834 male householders (4,425 living alone)), 6,766 female householders (5,693 living alone)), 3,328 nonrelatives
- In group quarters: 1,405 (987 institutionalized population)
22,792 married couples with children.
8,153 single-parent households (1,804 men, 6,349 women).
94.2% of residents of St. Charles speak English at home.
2.6% of residents speak Spanish at home (70% speak English very well, 14% speak English well, 15% speak English not well, 1% don't speak English at all).
1.3% of residents speak other Indo-European language at home (83% speak English very well, 6% speak English well, 10% speak English not well, 1% don't speak English at all).
1.5% of residents speak Asian or Pacific Island language at home (46% speak English very well, 36% speak English well, 16% speak English not well, 2% don't speak English at all).
0.4% of residents speak other language at home (83% speak English very well, 13% speak English well, 4% speak English not well).
Foreign born population: 4,872 (10.3%)
(51.0% of them are naturalized citizens)
| Here: | 6.4 |
| State: | 7.3 |
| Here: | 4.9 |
| State: | 4.2 |
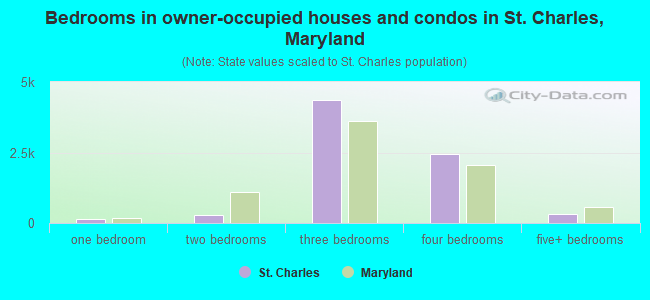
- Bedrooms in owner-occupied houses and condos in St. Charles, Maryland
- 0no bedroom
- 1411 bedroom
- 2722 bedrooms
- 4,3593 bedrooms
- 2,4564 bedrooms
- 3135+ bedrooms
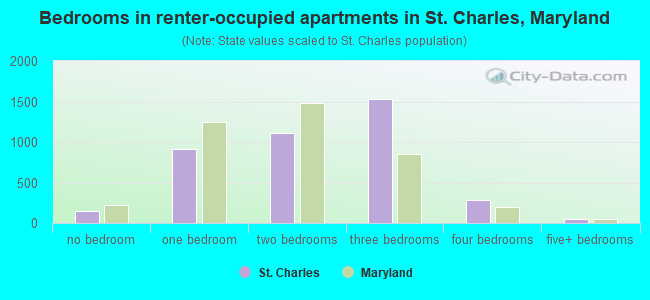
- Bedrooms in renter-occupied apartments in St. Charles, Maryland
- 154no bedroom
- 9091 bedroom
- 1,1092 bedrooms
- 1,5273 bedrooms
- 2834 bedrooms
- 545+ bedrooms
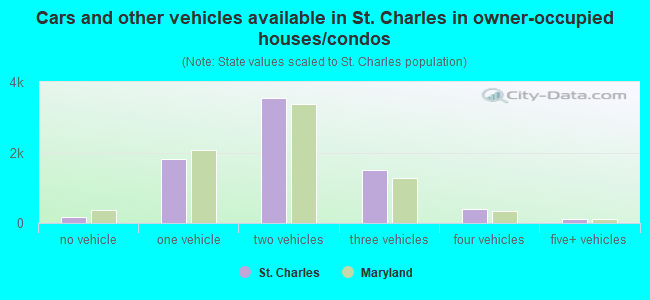
- Cars and other vehicles available in St. Charles in owner-occupied houses/condos
- 179no vehicle
- 1,8101 vehicle
- 3,5452 vehicles
- 1,5003 vehicles
- 3964 vehicles
- 1115+ vehicles
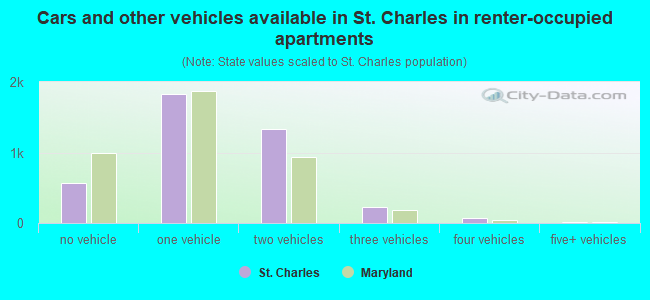
- Cars and other vehicles available in St. Charles in renter-occupied apartments
- 563no vehicle
- 1,8291 vehicle
- 1,3392 vehicles
- 2293 vehicles
- 644 vehicles
- 125+ vehicles
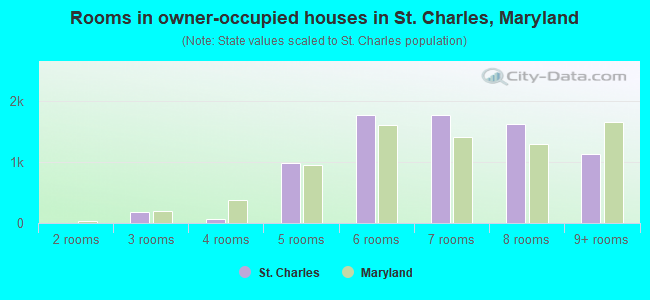
- Rooms in owner-occupied houses in St. Charles, Maryland
- 01 room
- 82 rooms
- 1823 rooms
- 594 rooms
- 9925 rooms
- 1,7736 rooms
- 1,7757 rooms
- 1,6208 rooms
- 1,1329+ rooms
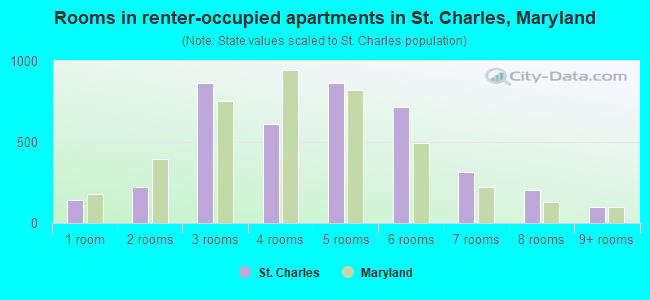
- Rooms in renter-occupied apartments in St. Charles, Maryland
- 1421 room
- 2232 rooms
- 8673 rooms
- 6104 rooms
- 8625 rooms
- 7156 rooms
- 3137 rooms
- 2068 rooms
- 989+ rooms
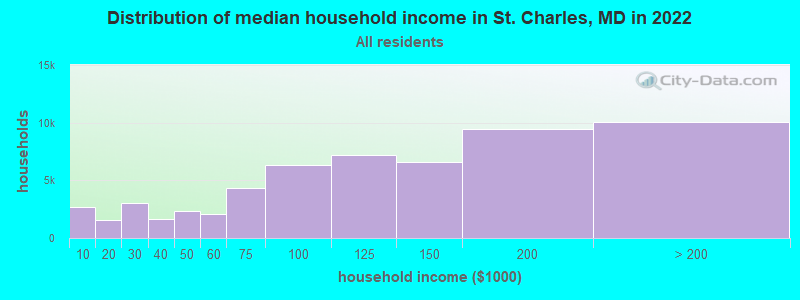
St. Charles, MD household income distribution

- 2,707Less than $10,000
- 1,569$10,000 to $19,999
- 3,004$20,000 to $29,999
- 1,668$30,000 to $39,999
- 2,368$40,000 to $49,999
- 2,061$50,000 to $59,999
- 4,349$60,000 to $74,999
- 6,369$75,000 to $99,999
- 7,175$100,000 to $124,999
- 6,633$125,000 to $149,999
- 9,495$150,000 to $199,999
- 10,064$200,000 or more
Percentage of workers working in this county: 42.4%
Number of people working at home: 3,739 (14.5% of all workers)
Travel time to work (commute)
- Less than 5 minutes: 305
- 5 to 9 minutes: 1,472
- 10 to 14 minutes: 1,968
- 15 to 19 minutes: 1,240
- 20 to 24 minutes: 1,165
- 25 to 29 minutes: 575
- 30 to 34 minutes: 1,634
- 35 to 39 minutes: 680
- 40 to 44 minutes: 777
- 45 to 59 minutes: 2,973
- 60 to 89 minutes: 3,305
- 90 or more minutes: 1,113
Means of transportation to work:
- Drove a car alone: 13,541 (77.0%)
- Carpooled: 2,792 (15.9%)
- Bus or trolley bus: 579 (3.3%)
- Subway or elevated: 23 (0.1%)
- Taxi: 6 (0.0%)
- Motorcycle: 4 (0.0%)
- Bicycle: 36 (0.2%)
- Walked: 128 (0.7%)
- Other means: 98 (0.6%)
- Worked at home: 376 (2.1%)
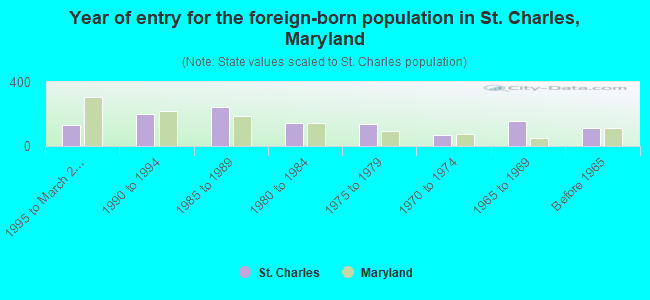
- Year of entry for the foreign-born population in St. Charles, Maryland
- 1331995 to March 2000
- 2001990 to 1994
- 2421985 to 1989
- 1451980 to 1984
- 1371975 to 1979
- 691970 to 1974
- 1561965 to 1969
- 115Before 1965
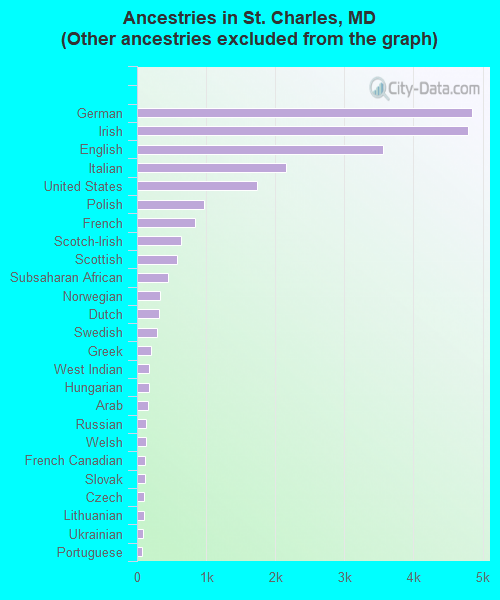
First ancestries reported:
- Other: 12,744 (35.6%)
- German: 4,850 (13.5%)
- Irish: 4,792 (13.4%)
- English: 3,552 (9.9%)
- Italian: 2,157 (6.0%)
- United States: 1,739 (4.9%)
- Polish: 972 (2.7%)
- French: 844 (2.4%)
- Scotch-Irish: 642 (1.8%)
- Scottish: 577 (1.6%)
- Subsaharan African: 452 (1.3%)
- Norwegian: 326 (0.9%)
- Dutch: 322 (0.9%)
- Swedish: 289 (0.8%)
- Greek: 200 (0.6%)
- West Indian: 176 (0.5%)
- Hungarian: 174 (0.5%)
- Arab: 156 (0.4%)
- Russian: 126 (0.4%)
- Welsh: 123 (0.3%)
- French Canadian: 121 (0.3%)
- Slovak: 116 (0.3%)
- Czech: 105 (0.3%)
- Lithuanian: 96 (0.3%)
- Ukrainian: 87 (0.2%)
- Portuguese: 79 (0.2%)
- Danish: 20 (0.06%)
- Swiss: 7 (0.02%)
Most common places of birth for foreign-born residents (%):
| St. Charles: | 13.8% (165) |
| Maryland: | 6.0% (31,249) |
| St. Charles: | 10.6% (127) |
| Maryland: | 4.1% (21,007) |
| St. Charles: | 8.0% (96) |
| Maryland: | 2.7% (14,206) |
| St. Charles: | 5.3% (63) |
| Maryland: | 8.1% (41,818) |
| St. Charles: | 5.1% (61) |
| Maryland: | 1.7% (9,019) |
| St. Charles: | 5.0% (60) |
| Maryland: | 1.0% (5,354) |
| St. Charles: | 4.4% (53) |
| Maryland: | 3.7% (18,988) |
| St. Charles: | 3.8% (45) |
| Maryland: | 0.4% (1,949) |
| St. Charles: | 3.7% (44) |
| Maryland: | 0.6% (2,921) |
| St. Charles: | 2.4% (29) |
| Maryland: | 2.8% (14,555) |
| St. Charles: | 2.4% (29) |
| Maryland: | 1.5% (7,928) |
| St. Charles: | 2.3% (28) |
| Maryland: | 0.9% (4,697) |
| St. Charles: | 2.2% (26) |
| Maryland: | 0.2% (1,259) |
| St. Charles: | 2.2% (26) |
| Maryland: | 0.2% (945) |
| St. Charles: | 2.1% (25) |
| Maryland: | 4.4% (22,741) |
| St. Charles: | 2.1% (25) |
| Maryland: | 0.8% (4,105) |
| St. Charles: | 2.0% (24) |
| Maryland: | 0.5% (2,477) |
| St. Charles: | 2.0% (24) |
| Maryland: | 0.6% (2,999) |
| St. Charles: | 1.8% (21) |
| Maryland: | 2.9% (15,071) |
Place of birth for U.S.-born residents:
- This state: 11,584
- Other state: 19,932
- Northeast: 3,924
- Midwest: 2,068
- South: 12,189
- West: 1,751
51% of St. Charles residents lived in the same house 5 years ago.
Out of people who lived in different houses, 42% lived in this county.
Out of people who lived in different counties, 49% lived in Maryland.
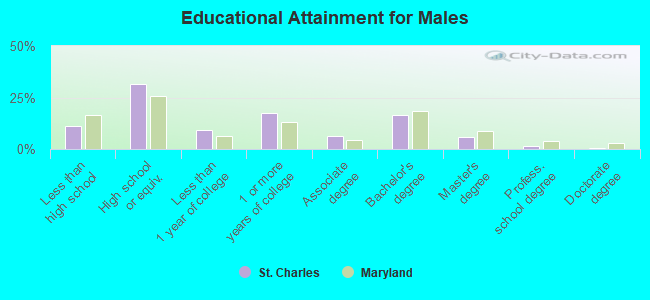
Education attainment for males 25 years and older:
- No schooling: 61
- Nursery to 4th grade: 35
- 5th and 6th grade: 42
- 7th and 8th grade: 134
- 9th grade: 154
- 10th grade: 204
- 11th grade: 176
- 12th grade, no diploma: 200
- High school graduate (or equivalency): 2,897
- Less than 1 year of college: 833
- Some college more than 1 year, no degree: 1,607
- Associate degree: 578
- Bachelor's degree: 1,502
- Master's degree: 543
- Professional school degree: 112
- Doctorate degree: 48
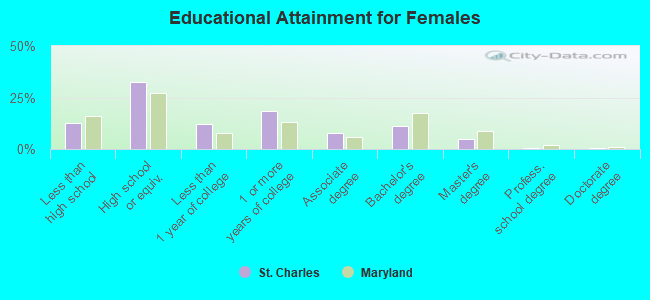
Education attainment for females 25 years and older:
- No schooling: 48
- Nursery to 4th grade: 0
- 5th and 6th grade: 54
- 7th and 8th grade: 206
- 9th grade: 184
- 10th grade: 229
- 11th grade: 251
- 12th grade, no diploma: 407
- High school graduate (or equivalency): 3,500
- Less than 1 year of college: 1,290
- Some college more than 1 year, no degree: 1,994
- Associate degree: 818
- Bachelor's degree: 1,221
- Master's degree: 509
- Professional school degree: 63
- Doctorate degree: 41
Housing units in structures:
- One, detached: 6,395
- One, attached: 3,369
- Two: 78
- 3 or 4: 525
- 5 to 9: 830
- 10 to 19: 91
- 20 to 49: 384
- 50 or more: 367
- Mobile homes: 32
Median worth of mobile homes: $214,557
Housing units lacking complete kitchen facilities: 0.7%
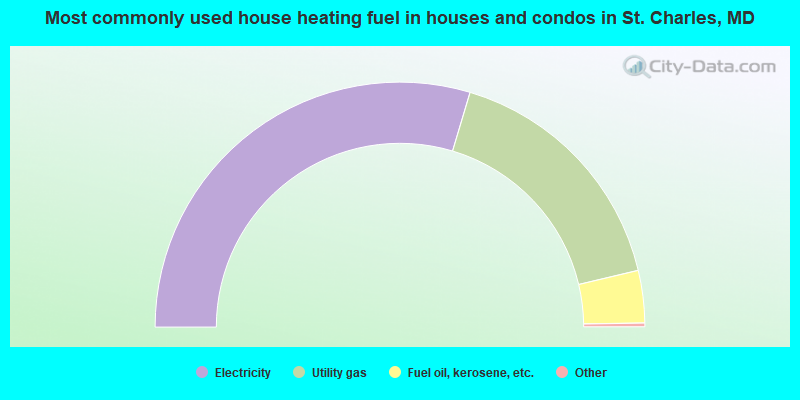
- 59.2%Electricity
- 33.3%Utility gas
- 6.9%Fuel oil, kerosene, etc.
- 0.3%Wood
- 0.2%Bottled, tank, or LP gas
- 0.1%No fuel used
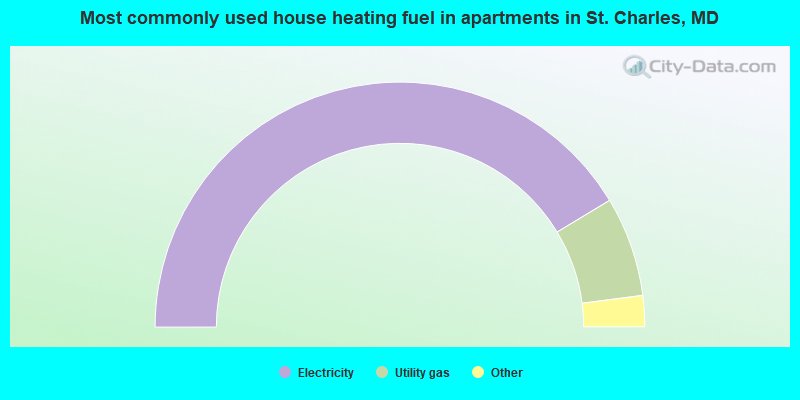
- 82.7%Electricity
- 13.2%Utility gas
- 2.4%Fuel oil, kerosene, etc.
- 1.2%Bottled, tank, or LP gas
- 0.5%No fuel used
Private vs. public school enrollment:
| Here: | 12.9% |
| Maryland: | 14.8% |
| Here: | 8.1% |
| Maryland: | 13.3% |
| Here: | 14.7% |
| Maryland: | 21.7% |