St. Helena, SC (South Carolina) Houses and Residents
| St. Helena: | $398,997 |
| South Carolina: | $254,600 |
Total population: 22,796 (Urban population: 5,756 (all inside urban clusters), Rural population: 13,051 (303 farm, 12,748 nonfarm))
Houses: 9,389 (7,282 occupied: 6,108 owner occupied, 1,174 renter occupied)
| % of renters here: | 16% |
| State: | 28% |
Housing density: 66 houses/condos per square mile
Median price asked for vacant for-sale houses and condos in 2022 in this county: $379,761.
Median contract rent in 2022: $1,119 (lower quartile is $712, upper quartile is $1,711)
Median rent asked for vacant for-rent units in 2022: $1,530
Median gross rent in St. Helena, SC in 2022: $1,318
Housing units in St. Helena with a mortgage: 2,827 (286 second mortgage, 452 home equity loan, 18 both second mortgage and home equity loan)
Houses without a mortgage: 1,589
Compare current foreclosures near St. Helena, SC:
| Photo | Address | Area | Beds / Baths | Price | Details |
|---|---|---|---|---|---|

|
#1
Ceasar Pl
Hilton Head Island, SC 29926
|
2,090 sq. feet
|
2 baths 4 beds |
show details | |

|
#2
St
Beaufort, SC 29902
|
- sq. feet
|
1 baths 3 beds |
show details | |

|
#3
Chesterfield Dr
Beaufort, SC 29906
|
1,601 sq. feet
|
2 baths 3 beds |
show details | |

|
#4
Waverly Way
Beaufort, SC 29902
|
1,339 sq. feet
|
1 baths 3 beds |
show details | |

|
#5
Southside Blvd
Beaufort, SC 29902
|
1,476 sq. feet
|
2 baths 3 beds |
show details | |

|
#6
Pickens St
Ladys Island, SC 29907
|
1,806 sq. feet
|
2 baths 3 beds |
show details | |

|
#7
Christine Dr
Ladys Island, SC 29907
|
1,404 sq. feet
|
2 baths 3 beds |
show details | |

|
#8
Broad River Blvd
Beaufort, SC 29906
|
840 sq. feet
|
1 baths 3 beds |
show details | |

|
#9
Francis Marion Cir
Ladys Island, SC 29907
|
3,086 sq. feet
|
3 baths 4 beds |
show details | |

|
#10
Clarendon Rd
Beaufort, SC 29906
|
864 sq. feet
|
1 baths 1 beds |
show details |
| Photo | Address | Area | Beds / Baths | Price | Details |
|---|---|---|---|---|---|

|
#11
Stuart Point Rd
Seabrook, SC 29940
|
- sq. feet
|
- baths 1 beds |
show details | |

|
#12
Whitfield Ln
Saint Helena Island, SC 29920
|
1,780 sq. feet
|
1 baths 3 beds |
show details | |

|
#13
Pelican Cir
Beaufort, SC 29906
|
1,161 sq. feet
|
2 baths 3 beds |
show details | |

|
#14
Spanish Point Dr
Beaufort, SC 29902
|
3,487 sq. feet
|
2 baths 3 beds |
show details | |

|
#15
Battery Creek Rd
Beaufort, SC 29902
|
1,115 sq. feet
|
2 baths 3 beds |
show details | |

|
#16
Island Pines Dr
Port Royal, SC 29935
|
1,088 sq. feet
|
2 baths 2 beds |
show details | |

|
#17
Seaside Rd
Saint Helena Island, SC 29920
|
1,422 sq. feet
|
1 baths 3 beds |
show details | |

|
#18
Cypress St
Beaufort, SC 29906
|
1,524 sq. feet
|
2 baths 3 beds |
show details | |

|
#19
Ramsey Rd
Beaufort, SC 29906
|
1,150 sq. feet
|
1 baths 3 beds |
show details | |

|
#20
Centerview Dr
Beaufort, SC 29902
|
1,152 sq. feet
|
1 baths 3 beds |
show details |
| Photo | Address | Area | Beds / Baths | Price | Details |
|---|---|---|---|---|---|

|
#21
Jeter Rd
Beaufort, SC 29906
|
1,276 sq. feet
|
2 baths 4 beds |
show details | |

|
#22
Dowlingwood Dr
Beaufort, SC 29902
|
2,913 sq. feet
|
2 baths 3 beds |
show details | |

|
#23
Charles St # A
Beaufort, SC 29902
|
1,530 sq. feet
|
1 baths 2 beds |
show details | |

|
#24
Fish Haul Rd
Hilton Head Island, SC 29926
|
956 sq. feet
|
1 baths 2 beds |
show details | |

|
#25
Scott St
Beaufort, SC 29902
|
1,280 sq. feet
|
1 baths 3 beds |
show details | |

|
#26
Cedar Point Dr
Ladys Island, SC 29907
|
1,120 sq. feet
|
1 baths 2 beds |
show details | |

|
#27
Fairlawn Ct
Hilton Head Island, SC 29926
|
3,678 sq. feet
|
3 baths 4 beds |
show details | |

|
#28
Castle Rock Rd
Beaufort, SC 29906
|
840 sq. feet
|
1 baths 4 beds |
show details | |

|
#29
Ceasar Pl
Hilton Head Island, SC 29926
|
2,090 sq. feet
|
3 baths 3 beds |
show details | |

|
#30
Hilda Ave
Ladys Island, SC 29907
|
1,516 sq. feet
|
2 baths 3 beds |
show details |
| Photo | Address | Area | Beds / Baths | Price | Details |
|---|---|---|---|---|---|

|
#31
Mamie Frazier Ln
Beaufort, SC 29906
|
1,212 sq. feet
|
1 baths 3 beds |
show details | |

|
#32
Pickens St
Ladys Island, SC 29907
|
2,520 sq. feet
|
3 baths 4 beds |
show details | |

|
#33
Scott Hill Rd
Saint Helena Island, SC 29920
|
1,280 sq. feet
|
1 baths 3 beds |
show details | |

|
#34
Southern Magnolia Dr
Ladys Island, SC 29907
|
1,244 sq. feet
|
2 baths 3 beds |
show details | |

|
#35
Ratel Cir
Beaufort, SC 29902
|
1,770 sq. feet
|
2 baths 3 beds |
show details | |

|
#36
Marquis Way
Ladys Island, SC 29907
|
2,114 sq. feet
|
2 baths 3 beds |
show details | |

|
#37
Mary Elizabeth Dr
Ladys Island, SC 29907
|
1,186 sq. feet
|
2 baths 3 beds |
show details | |

|
#38
Middlefield Cir
Seabrook, SC 29940
|
1,388 sq. feet
|
1 baths 3 beds |
show details | |

|
#39
Paige Dr
Beaufort, SC 29906
|
1,632 sq. feet
|
2 baths - beds |
show details | |

|
#40
Dean Hall Rd
Seabrook, SC 29940
|
953 sq. feet
|
1 baths - beds |
show details |
| Photo | Address | Area | Beds / Baths | Price | Details |
|---|---|---|---|---|---|

|
#41
Prescott Dr
Beaufort, SC 29902
|
1,680 sq. feet
|
2 baths - beds |
show details | |

|
#42
Shadow Moss Dr
Beaufort, SC 29906
|
3,072 sq. feet
|
2 baths - beds |
show details | |

|
#43
Parkwood Dr
Hilton Head Island, SC 29926
|
1,945 sq. feet
|
3 baths - beds |
show details | |

|
#44
Joe Frazier Rd
Beaufort, SC 29906
|
2,190 sq. feet
|
2 baths - beds |
show details | |

|
#45
Sundew Ct
Hilton Head Island, SC 29926
|
1,869 sq. feet
|
3 baths - beds |
show details | |

|
#46
Hermitage Rd
Beaufort, SC 29902
|
2,411 sq. feet
|
3 baths - beds |
show details | |

|
#47
Lucerne Ave
Ladys Island, SC 29907
|
1,129 sq. feet
|
2 baths - beds |
show details | |

|
#48
10th St
Port Royal, SC 29935
|
1,782 sq. feet
|
3 baths - beds |
show details | |

|
#49
Cedar Crest Cir
Ladys Island, SC 29907
|
1,110 sq. feet
|
2 baths - beds |
show details | |

|
Check over 1 million property listings on Foreclosure.com!
|
browse all offers | |||

Household type by relationship:
Households: 156,968- In family households: 132,398 (32,225 male householders, 13,097 female householders)
35,966 spouses, 38,550 children (35,661 natural, 940 adopted, 1,949 stepchildren), 3,115 grandchildren, 1,565 brothers or sisters, 1,088 parents, foster children, 2,279 other relatives, 3,798 non-relatives
- In nonfamily households: 24,570 (8,451 male householders (6,212 living alone)), 11,172 female householders (9,597 living alone)), 4,947 nonrelatives
- In group quarters: 5,265 (650 institutionalized population)
18,192 married couples with children.
6,859 single-parent households (1,353 men, 5,506 women).
94.6% of residents of St. Helena speak English at home.
3.8% of residents speak Spanish at home (70% speak English very well, 9% speak English well, 11% speak English not well, 10% don't speak English at all).
1.0% of residents speak other Indo-European language at home (92% speak English very well, 8% speak English well).
0.6% of residents speak Asian or Pacific Island language at home (100% speak English very well).
0.1% of residents speak other language at home (100% speak English very well).
Foreign born population: 943 (3.1%)
(71.7% of them are naturalized citizens)
| Here: | 6.6 |
| State: | 6.4 |
| Here: | 4.5 |
| State: | 4.5 |

- Bedrooms in owner-occupied houses and condos in St. Helena, South Carolina
- 61no bedroom
- 1471 bedroom
- 7742 bedrooms
- 3,9493 bedrooms
- 1,0114 bedrooms
- 1665+ bedrooms

- Bedrooms in renter-occupied apartments in St. Helena, South Carolina
- 19no bedroom
- 931 bedroom
- 4232 bedrooms
- 5373 bedrooms
- 944 bedrooms
- 85+ bedrooms

- Cars and other vehicles available in St. Helena in owner-occupied houses/condos
- 465no vehicle
- 1,9751 vehicle
- 2,6712 vehicles
- 8243 vehicles
- 984 vehicles
- 755+ vehicles

- Cars and other vehicles available in St. Helena in renter-occupied apartments
- 163no vehicle
- 4431 vehicle
- 4352 vehicles
- 943 vehicles
- 394 vehicles
- 05+ vehicles

- Rooms in owner-occupied houses in St. Helena, South Carolina
- 01 room
- 612 rooms
- 3433 rooms
- 3134 rooms
- 1,2715 rooms
- 1,7856 rooms
- 1,1427 rooms
- 7128 rooms
- 4819+ rooms

- Rooms in renter-occupied apartments in St. Helena, South Carolina
- 01 room
- 712 rooms
- 1073 rooms
- 3384 rooms
- 2215 rooms
- 2746 rooms
- 947 rooms
- 458 rooms
- 249+ rooms


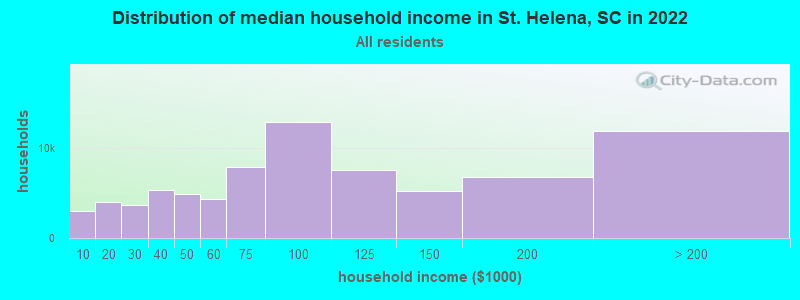
St. Helena, SC household income distribution

- 3,033Less than $10,000
- 4,040$10,000 to $19,999
- 3,637$20,000 to $29,999
- 5,362$30,000 to $39,999
- 4,921$40,000 to $49,999
- 4,269$50,000 to $59,999
- 7,869$60,000 to $74,999
- 12,857$75,000 to $99,999
- 7,491$100,000 to $124,999
- 5,255$125,000 to $149,999
- 6,795$150,000 to $199,999
- 11,826$200,000 or more
Percentage of workers working in this county: 90.1%
Number of people working at home: 812 (9.2% of all workers)
Travel time to work (commute)
- Less than 5 minutes: 105
- 5 to 9 minutes: 560
- 10 to 14 minutes: 1,042
- 15 to 19 minutes: 1,183
- 20 to 24 minutes: 1,555
- 25 to 29 minutes: 526
- 30 to 34 minutes: 1,167
- 35 to 39 minutes: 78
- 40 to 44 minutes: 72
- 45 to 59 minutes: 472
- 60 to 89 minutes: 357
- 90 or more minutes: 253
Means of transportation to work:
- Drove a car alone: 5,865 (76.6%)
- Carpooled: 1,130 (14.8%)
- Bus or trolley bus: 138 (1.8%)
- Streetcar or trolley car: 8 (0.1%)
- Motorcycle: 10 (0.1%)
- Bicycle: 21 (0.3%)
- Walked: 104 (1.4%)
- Other means: 94 (1.2%)
- Worked at home: 287 (3.7%)


- Year of entry for the foreign-born population in St. Helena, South Carolina
- 1161995 to March 2000
- 781990 to 1994
- 681985 to 1989
- 451980 to 1984
- 171975 to 1979
- 461970 to 1974
- 321965 to 1969
- 112Before 1965
Most common places of birth for foreign-born residents (%):
| St. Helena: | 24.3% (125) |
| South Carolina: | 27.3% (31,719) |
| St. Helena: | 16.3% (84) |
| South Carolina: | 5.9% (6,890) |
| St. Helena: | 9.3% (48) |
| South Carolina: | 4.4% (5,108) |
| St. Helena: | 8.8% (45) |
| South Carolina: | 4.8% (5,512) |
| St. Helena: | 5.8% (30) |
| South Carolina: | 2.9% (3,394) |
| St. Helena: | 4.1% (21) |
| South Carolina: | 1.0% (1,130) |
| St. Helena: | 4.1% (21) |
| South Carolina: | 0.5% (585) |
| St. Helena: | 3.3% (17) |
| South Carolina: | 6.8% (7,873) |
| St. Helena: | 2.9% (15) |
| South Carolina: | 1.8% (2,125) |
| St. Helena: | 2.3% (12) |
| South Carolina: | 0.3% (298) |
| St. Helena: | 1.9% (10) |
| South Carolina: | 0.1% (142) |
| St. Helena: | 1.9% (10) |
| South Carolina: | 0.6% (713) |
| St. Helena: | 1.9% (10) |
| South Carolina: | 1.3% (1,563) |
| St. Helena: | 1.8% (9) |
| South Carolina: | 1.3% (1,526) |
| St. Helena: | 1.8% (9) |
| South Carolina: | 0.8% (977) |
| St. Helena: | 1.8% (9) |
| South Carolina: | 0.4% (433) |
| St. Helena: | 1.6% (8) |
| South Carolina: | 0.1% (121) |
Place of birth for U.S.-born residents:
- This state: 9,063
- Other state: 8,947
- Northeast: 2,725
- Midwest: 1,882
- South: 3,695
- West: 645
57% of St. Helena residents lived in the same house 5 years ago.
Out of people who lived in different houses, 42% lived in this county.
Out of people who lived in different counties, 20% lived in South Carolina.
Education attainment for males 25 years and older:
- No schooling: 37
- Nursery to 4th grade: 36
- 5th and 6th grade: 68
- 7th and 8th grade: 124
- 9th grade: 80
- 10th grade: 106
- 11th grade: 144
- 12th grade, no diploma: 204
- High school graduate (or equivalency): 1,511
- Less than 1 year of college: 426
- Some college more than 1 year, no degree: 729
- Associate degree: 309
- Bachelor's degree: 1,192
- Master's degree: 580
- Professional school degree: 235
- Doctorate degree: 59

Education attainment for females 25 years and older:
- No schooling: 51
- Nursery to 4th grade: 42
- 5th and 6th grade: 81
- 7th and 8th grade: 219
- 9th grade: 107
- 10th grade: 90
- 11th grade: 195
- 12th grade, no diploma: 200
- High school graduate (or equivalency): 1,620
- Less than 1 year of college: 661
- Some college more than 1 year, no degree: 931
- Associate degree: 499
- Bachelor's degree: 1,285
- Master's degree: 649
- Professional school degree: 57
- Doctorate degree: 31

Housing units in structures:
- One, detached: 6,421
- One, attached: 212
- Two: 85
- 3 or 4: 94
- 5 to 9: 86
- 10 to 19: 107
- 20 to 49: 196
- 50 or more: 45
- Mobile homes: 2,119
- Boats, RVs, vans, etc.: 24
Median worth of mobile homes: $103,394
Housing units lacking complete kitchen facilities: 0.7%

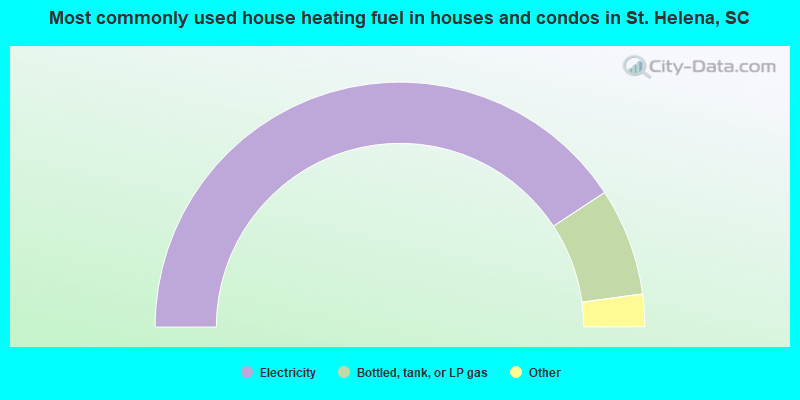
- 81.5%Electricity
- 14.2%Bottled, tank, or LP gas
- 2.1%Utility gas
- 1.0%Wood
- 0.7%Fuel oil, kerosene, etc.
- 0.4%No fuel used
- 0.2%Other fuel
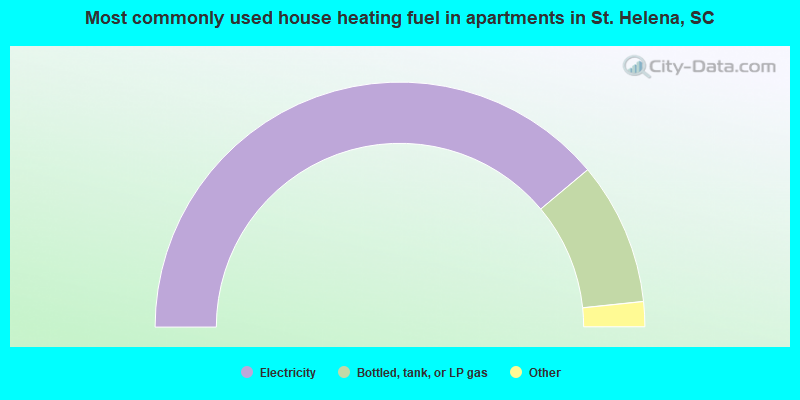
- 77.8%Electricity
- 18.9%Bottled, tank, or LP gas
- 2.5%Utility gas
- 0.5%Wood
- 0.3%Fuel oil, kerosene, etc.
Private vs. public school enrollment:
| Here: | 11.3% |
| South Carolina: | 9.2% |
| Here: | 7.7% |
| South Carolina: | 8.1% |
| Here: | 14.4% |
| South Carolina: | 20.3% |


