St. Stephen, SC (South Carolina) Houses and Residents
| St. Stephen: | $128,596 |
| South Carolina: | $254,600 |
Mean price in 2022:
Detached houses: $267,861
Here: $267,861 State: $368,255 Mobile homes: $75,243
Here: $75,243 State: $102,531
Total population: 1,777 (Urban population: 0, Rural population: 1,832 (9 farm, 1,823 nonfarm))
Houses: 662 (510 occupied: 290 owner occupied, 228 renter occupied)
| % of renters here: | 44% |
| State: | 28% |
Housing density: 269 houses/condos per square mile
Median price asked for vacant for-sale houses and condos in 2022 in this county: $222,405.
Median contract rent in 2022: $510 (lower quartile is $201, upper quartile is $800)
Median rent asked for vacant for-rent units in 2022: $610
Median gross rent in St. Stephen, SC in 2022: $834
Housing units in St. Stephen with a mortgage: 83 (0 second mortgage, 0 home equity loan, 0 both second mortgage and home equity loan)
Houses without a mortgage: 0
Median household income for houses/condos with a mortgage: $126,550
Median household income for apartments without a mortgage: $39,907
Median monthly housing costs: $543
Compare current foreclosures near St. Stephen, SC:
| Photo | Address | Area | Beds / Baths | Price | Details |
|---|---|---|---|---|---|

|
#1
Riverridge Ct
Moncks Corner, SC 29461
|
912 sq. feet
|
1 baths 1 beds |
show details | |

|
#2
Mcneil Ln
Moncks Corner, SC 29461
|
1,344 sq. feet
|
2 baths 4 beds |
show details | |

|
#3
Pooshee Plantation Way
Bonneau, SC 29431
|
2,128 sq. feet
|
3 baths 4 beds |
show details | |

|
#4
Pompey Town Rd
Greeleyville, SC 29056
|
- sq. feet
|
2 baths 2 beds |
show details | |

|
#5
Sandhurst St
Kingstree, SC 29556
|
1,340 sq. feet
|
1 baths 4 beds |
show details | |

|
#6
Hayfield Ln
Saint Stephen, SC 29479
|
1,809 sq. feet
|
- baths - beds |
show details | |

|
#7
Mishoe St
Greeleyville, SC 29056
|
1,200 sq. feet
|
- baths - beds |
show details | |

|
#8
Winter St
Moncks Corner, SC 29461
|
1,930 sq. feet
|
- baths - beds |
show details | |

|
#9
Tygerpaw Trl
Saint Stephen, SC 29479
|
2,356 sq. feet
|
- baths - beds |
show details | |

|
#10
Tram St
Moncks Corner, SC 29461
|
1,680 sq. feet
|
- baths - beds |
show details |
| Photo | Address | Area | Beds / Baths | Price | Details |
|---|---|---|---|---|---|

|
#11
Lacey Acres Ln
Cross, SC 29436
|
3,143 sq. feet
|
- baths - beds |
show details | |

|
#12
Azalea Ct
Moncks Corner, SC 29461
|
1,242 sq. feet
|
- baths - beds |
show details | |

|
#13
Hines Dr
Bonneau, SC 29431
|
2,432 sq. feet
|
- baths - beds |
show details | |

|
#14
Three Girls Ln
Cordesville, SC 29434
|
2,128 sq. feet
|
- baths - beds |
show details | |

|
#15
Light Ln
Saint Stephen, SC 29479
|
1,618 sq. feet
|
- baths - beds |
show details | |

|
#16
Burtwood Dr
Moncks Corner, SC 29461
|
- sq. feet
|
- baths - beds |
show details | |

|
#17
Bloomville Rd
Manning, SC 29102
|
- sq. feet
|
- baths - beds |
show details | |

|
#18
Highway 6
Pinopolis, SC 29469
|
- sq. feet
|
- baths - beds |
show details | |

|
#19
Kitfield Rd
Moncks Corner, SC 29461
|
2,308 sq. feet
|
- baths - beds |
show details | |

|
#20
Sanders Rd
Cross, SC 29436
|
888 sq. feet
|
- baths - beds |
show details |
| Photo | Address | Area | Beds / Baths | Price | Details |
|---|---|---|---|---|---|

|
#21
Saddle Brook Rd
Salters, SC 29590
|
- sq. feet
|
- baths - beds |
show details | |

|
#22
Shamrock Ct
Moncks Corner, SC 29461
|
1,050 sq. feet
|
- baths - beds |
show details | |

|
#23
Wells Cir
Saint Stephen, SC 29479
|
1,008 sq. feet
|
- baths - beds |
show details | |

|
#24
Oscar Haynes Rd
Moncks Corner, SC 29461
|
- sq. feet
|
- baths - beds |
show details | |

|
#25
Old Whitesville Rd
Moncks Corner, SC 29461
|
- sq. feet
|
- baths - beds |
show details | |

|
#26
Limerick Dr
Moncks Corner, SC 29461
|
1,313 sq. feet
|
- baths - beds |
show details | |

|
#27
Haynesville Rd
Moncks Corner, SC 29461
|
- sq. feet
|
- baths - beds |
show details | |

|
#28
Eagleston Dr
Moncks Corner, SC 29461
|
1,344 sq. feet
|
- baths - beds |
show details | |

|
#29
Rockville Rd
Moncks Corner, SC 29461
|
- sq. feet
|
- baths - beds |
show details | |

|
#30
Saint Michaels Pl
Moncks Corner, SC 29461
|
- sq. feet
|
- baths - beds |
show details |
| Photo | Address | Area | Beds / Baths | Price | Details |
|---|---|---|---|---|---|

|
#31
Rockville Rd
Moncks Corner, SC 29461
|
- sq. feet
|
- baths - beds |
show details | |

|
#32
Cedarwood Dr
Moncks Corner, SC 29461
|
- sq. feet
|
- baths - beds |
show details | |

|
#33
Crestwood Dr
Moncks Corner, SC 29461
|
1,512 sq. feet
|
- baths - beds |
show details | |

|
#34
Old Whitesville Rd
Moncks Corner, SC 29461
|
1,438 sq. feet
|
- baths - beds |
show details | |

|
#35
Bonnoitt St Apt 26c
Moncks Corner, SC 29461
|
- sq. feet
|
- baths - beds |
show details | |

|
#36
Highway 6
Pinopolis, SC 29469
|
- sq. feet
|
- baths - beds |
show details | |

|
#37
Pine Tree St
Greeleyville, SC 29056
|
- sq. feet
|
- baths - beds |
show details | |

|
#38
Yates Ln
Bonneau, SC 29431
|
- sq. feet
|
- baths - beds |
show details | |

|
#39
Peru Rd
Saint Stephen, SC 29479
|
1,842 sq. feet
|
- baths - beds |
show details | |

|
#40
W Point Dr
Saint Stephen, SC 29479
|
- sq. feet
|
- baths - beds |
show details |
| Photo | Address | Area | Beds / Baths | Price | Details |
|---|---|---|---|---|---|

|
#41
Dennis Ridge Rd
Bonneau, SC 29431
|
- sq. feet
|
- baths - beds |
show details | |

|
#42
Greentown Rd
Saint Stephen, SC 29479
|
1,136 sq. feet
|
- baths - beds |
show details | |

|
#43
Lexi Ln
Bonneau, SC 29431
|
- sq. feet
|
- baths - beds |
show details | |

|
#44
General Moultrie Dr
Bonneau, SC 29431
|
- sq. feet
|
- baths - beds |
show details | |

|
#45
Midlake Way
Bonneau, SC 29431
|
992 sq. feet
|
- baths - beds |
show details | |

|
#46
Valleywood Rd
Saint Stephen, SC 29479
|
- sq. feet
|
- baths - beds |
show details | |

|
#47
Mini Farm Rd
Bonneau, SC 29431
|
- sq. feet
|
- baths - beds |
show details | |

|
#48
Wren Rd
Bonneau, SC 29431
|
- sq. feet
|
- baths - beds |
show details | |

|
#49
Old 52 Rd
Salters, SC 29590
|
- sq. feet
|
- baths - beds |
show details | |

|
Check over 1 million property listings on Foreclosure.com!
|
browse all offers | |||


 | Jersey Gal and two grown children wanting to escape the hustle and bustle of citylife! (11 replies) |
| Moving from Sacramento, CA to St. Stephen, SC (12 replies) |
| SC native ... will answer questions (254 replies) |
| Charleston Living (38 replies) |
| How many of you are native SCs? (26 replies) |
| land in St.Stephens (5 replies) |

Median year apartment built: 1981
Household type by relationship:
Households: 1,468- Male householders: 224 (67 living alone), Female householders: 282 (74 living alone)
223 spouses (223 opposite-sex spouses), 10 unmarried partners, (10 opposite-sex unmarried partners), 471 children (460 natural, 7 adopted, 3 stepchildren), 38 grandchildren, 0 brothers or sisters, 0 parents, 43 foster children, 0 other relatives, 73 non-relatives
- In group quarters: 100
Size of family households: 138 2-persons, 105 3-persons, 60 4-persons, 21 5-persons, 17 6-persons, 11 7-or-more-persons.
Size of nonfamily households: 144 1-person, 3 2-persons, 1 3-persons, 11 6-persons.
188 married couples with children.
108 single-parent households (10 men, 98 women).
99.6% of residents of St. Stephen speak English at home.
0.2% of residents speak other Indo-European language at home (100% speak English very well).
Foreign born population: 14 (1.0%)
(35.7% of them are naturalized citizens)
| Here: | 5.5 |
| State: | 6.4 |
| Here: | 4.2 |
| State: | 4.5 |

- Bedrooms in owner-occupied houses and condos in St. Stephen, South Carolina
- 0no bedroom
- 01 bedroom
- 792 bedrooms
- 1763 bedrooms
- 334 bedrooms
- 35+ bedrooms

- Bedrooms in renter-occupied apartments in St. Stephen, South Carolina
- 11no bedroom
- 511 bedroom
- 832 bedrooms
- 503 bedrooms
- 344 bedrooms
- 05+ bedrooms

- Cars and other vehicles available in St. Stephen in owner-occupied houses/condos
- 29no vehicle
- 591 vehicle
- 1142 vehicles
- 363 vehicles
- 414 vehicles
- 125+ vehicles

- Cars and other vehicles available in St. Stephen in renter-occupied apartments
- 33no vehicle
- 1571 vehicle
- 282 vehicles
- 113 vehicles
- 04 vehicles
- 05+ vehicles

- Rooms in owner-occupied houses in St. Stephen, South Carolina
- 01 room
- 02 rooms
- 33 rooms
- 524 rooms
- 1005 rooms
- 626 rooms
- 167 rooms
- 158 rooms
- 429+ rooms

- Rooms in renter-occupied apartments in St. Stephen, South Carolina
- 111 room
- 92 rooms
- 153 rooms
- 1074 rooms
- 465 rooms
- 46 rooms
- 307 rooms
- 38 rooms
- 39+ rooms


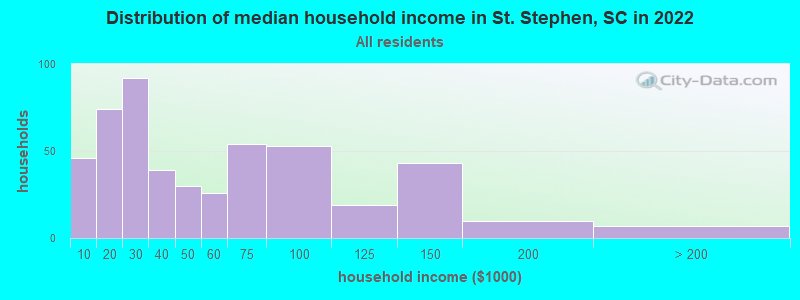
St. Stephen, SC household income distribution

- 46Less than $10,000
- 74$10,000 to $19,999
- 92$20,000 to $29,999
- 39$30,000 to $39,999
- 30$40,000 to $49,999
- 26$50,000 to $59,999
- 54$60,000 to $74,999
- 53$75,000 to $99,999
- 19$100,000 to $124,999
- 43$125,000 to $149,999
- 10$150,000 to $199,999
- 7$200,000 or more
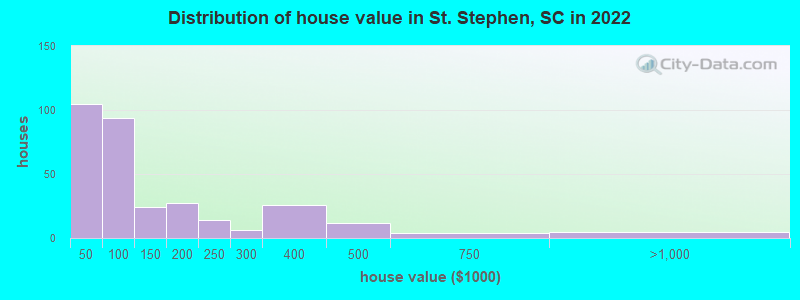
Home value of owner - occupied houses in 2022 in St. Stephen, SC
-
- 7Less than $10,000
- 8$10,000 to $14,999
- 9$15,000 to $19,999
- 40$25,000 to $29,999
- 12$35,000 to $39,999
- 26$40,000 to $49,999
- 46$60,000 to $69,999
- 14$70,000 to $79,999
- 5$80,000 to $89,999
- 7$100,000 to $124,999
- 16$125,000 to $149,999
- 19$150,000 to $174,999
- 7$175,000 to $199,999
- 13$200,000 to $249,999
- 6$250,000 to $299,999
- 26$300,000 to $399,999
- 12$400,000 to $499,999
- 3$500,000 to $749,999
- 5$750,000 to $999,999
Rent paid by renters in 2022 in St. Stephen, SC
-
- 9Less than $100
- 23$100 to $149
- 29$150 to $199
- 3$200 to $249
- 0$350 to $399
- 27$400 to $449
- 11$450 to $499
- 2$550 to $599
- 35$650 to $699
- 1$700 to $749
- 13$750 to $799
- 2$800 to $899
- 18$900 to $999
- 30No cash rent


Percentage of workers working in this county: 69.8%
Number of people working at home: 19 (5.1% of all workers)
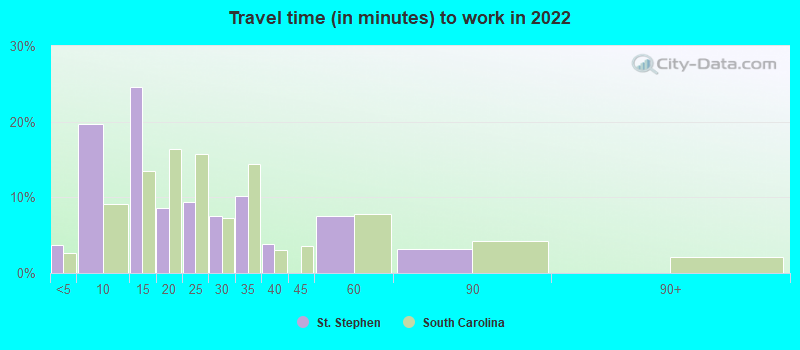
Travel time to work (commute)
- Less than 5 minutes: 14
- 5 to 9 minutes: 21
- 10 to 14 minutes: 18
- 15 to 19 minutes: 86
- 20 to 24 minutes: 22
- 25 to 29 minutes: 4
- 30 to 34 minutes: 58
- 35 to 39 minutes: 2
- 40 to 44 minutes: 10
- 45 to 59 minutes: 60
- 60 to 89 minutes: 30
- 90 or more minutes: 20
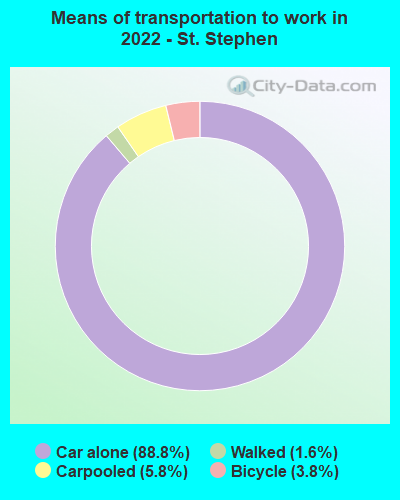
Means of transportation to work:
- Drove a car alone: 622 (84.2%)
- Carpooled: 39 (5.3%)
- Bicycle: 26 (3.5%)
- Walked: 9 (1.2%)
- Worked at home: 17 (2.3%)

- Unemployment by race in 2022
- Unemployment rate for White non-Hispanic residents
- 7.7%Males
- 5.6%Females

- Year of entry for the foreign-born population in St. Stephen, South Carolina
- 02010 or later
- 32000 to 2009
- 61990 to 1999
- 31980 to 1989
- 51970 to 1979
- 0Before 1970

First ancestries reported:
- American: 159 (17.9%)
- Irish: 103 (11.6%)
- English: 58 (6.5%)
- Scottish: 14 (1.6%)
- Polish: 11 (1.2%)
- German: 10 (1.1%)
- African: 10 (1.1%)
- Scotch-Irish: 6 (0.7%)
- European: 5 (0.6%)
- Swedish: 4 (0.5%)
Most common places of birth for foreign-born residents (%):
| St. Stephen: | 37.5% (6) |
| South Carolina: | 1.9% (5,117) |
| St. Stephen: | 18.8% (3) |
| South Carolina: | 3.7% (9,982) |
| St. Stephen: | 12.5% (2) |
| South Carolina: | 0.0% (49) |
| St. Stephen: | 12.5% (2) |
| South Carolina: | 0.3% (699) |
Place of birth for U.S.-born residents:
- This state: 1,077
- Other state: 379
- Northeast: 119
- Midwest: 76
- South: 168
- West: 18
85.9% of St. Stephen residents lived in the same house 1 years ago.
Out of people who lived in different houses, 17.9% lived in this county.
Out of people who lived in different counties, 97.8% lived in South Carolina.
| St. Stephen: | 85.9% |
| State average: | 86.5% |
Education attainment for males 25 years and older:
- No schooling: 6
- Nursery to 4th grade: 0
- 5th and 6th grade: 0
- 7th and 8th grade: 14
- 9th grade: 0
- 10th grade: 17
- 11th grade: 12
- 12th grade, no diploma: 6
- High school graduate (or equivalency): 135
- Less than 1 year of college: 16
- Some college more than 1 year, no degree: 71
- Associate degree: 13
- Bachelor's degree: 63
- Master's degree: 24
- Professional school degree: 16
- Doctorate degree: 0

Education attainment for females 25 years and older:
- No schooling: 0
- Nursery to 4th grade: 0
- 5th and 6th grade: 0
- 7th and 8th grade: 6
- 9th grade: 10
- 10th grade: 26
- 11th grade: 20
- 12th grade, no diploma: 15
- High school graduate (or equivalency): 160
- Less than 1 year of college: 18
- Some college more than 1 year, no degree: 78
- Associate degree: 65
- Bachelor's degree: 43
- Master's degree: 0
- Professional school degree: 0
- Doctorate degree: 3


Housing units in structures:
- One, detached: 300
- Two: 72
- 3 or 4: 59
- 5 to 9: 22
- 10 to 19: 4
- 50 or more: 13
- Mobile homes: 188
Median worth of mobile homes: $36,936
Housing units lacking complete kitchen facilities in 2022: 2.7%
House/condo owner moved in on average 18 years ago
Renter moved in on average 7 years ago

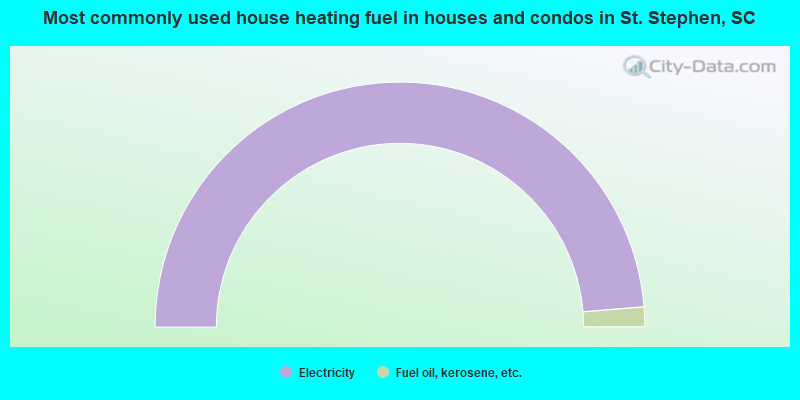
- 97.4%Electricity
- 2.6%Fuel oil, kerosene, etc.
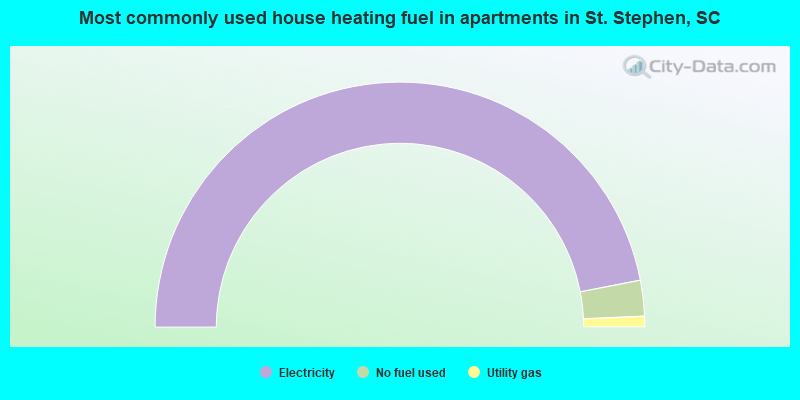
- 93.8%Electricity
- 4.7%No fuel used
- 1.4%Utility gas
Private vs. public school enrollment:
| Here: | 10.1% |
| South Carolina: | 14.4% |
| Here: | 13.3% |
| South Carolina: | 11.1% |
| Here: | 0.0% |
| South Carolina: | 21.9% |


