Swift Creek, GA (Georgia) Houses and Residents
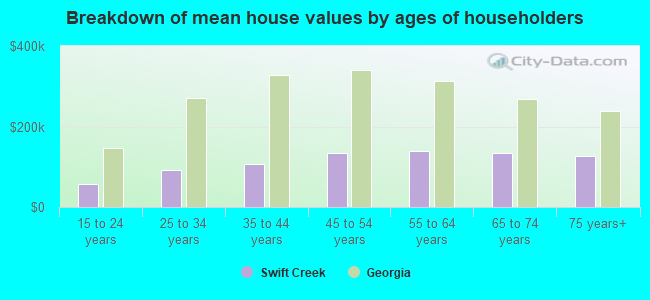
| Swift Creek: | $126,192 |
| Georgia: | $297,400 |
Total population: 5,542 (Urban population: 3,149, Rural population: 2,281 (all nonfarm))
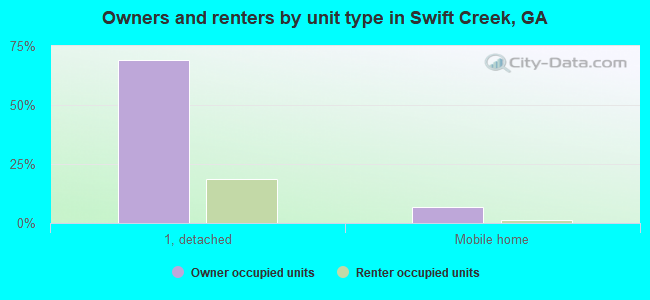
Houses: 2,102 (1,935 occupied: 1,469 owner occupied, 466 renter occupied)
| % of renters here: | 24% |
| State: | 34% |
Housing density: 65 houses/condos per square mile
Median price asked for vacant for-sale houses and condos in 2022 in this county: $106,222.
Median contract rent in 2022: $681 (lower quartile is $522, upper quartile is $879)
Median rent asked for vacant for-rent units in 2022: $739
Median gross rent in Swift Creek, GA in 2022: $881
Housing units in Swift Creek with a mortgage: 779 (103 second mortgage, 57 home equity loan, 0 both second mortgage and home equity loan)
Houses without a mortgage: 523


Household type by relationship:
Households: 149,496- In family households: 123,727 (20,525 male householders, 18,189 female householders)
22,613 spouses, 46,186 children (42,820 natural, 1,126 adopted, 2,240 stepchildren), 5,754 grandchildren, 2,095 brothers or sisters, 1,418 parents, foster children, 2,642 other relatives, 3,654 non-relatives
- In nonfamily households: 25,769 (9,319 male householders (7,502 living alone)), 12,262 female householders (10,742 living alone)), 4,188 nonrelatives
- In group quarters: 6,051 (3,480 institutionalized population)
19,119 married couples with children.
15,667 single-parent households (1,738 men, 13,929 women).
97.3% of residents of Swift Creek speak English at home.
2.0% of residents speak Spanish at home (36% speak English very well, 17% speak English well, 47% speak English not well).
0.7% of residents speak other Indo-European language at home (41% speak English very well, 59% speak English well).
Foreign born population: 189 (3.4%)
(75.1% of them are naturalized citizens)
| Here: | 5.2 |
| State: | 6.8 |
| Here: | 5.9 |
| State: | 4.6 |
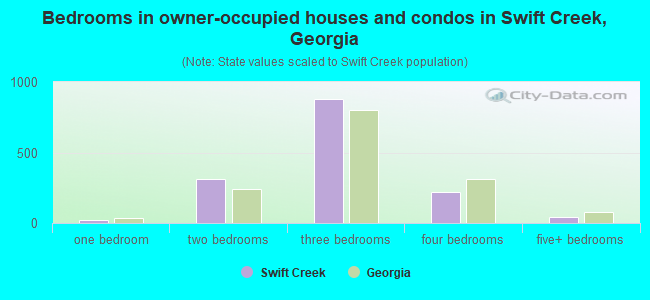
- Bedrooms in owner-occupied houses and condos in Swift Creek, Georgia
- 0no bedroom
- 181 bedroom
- 3092 bedrooms
- 8823 bedrooms
- 2184 bedrooms
- 425+ bedrooms
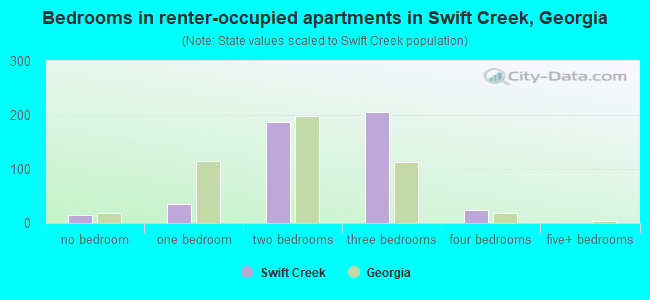
- Bedrooms in renter-occupied apartments in Swift Creek, Georgia
- 14no bedroom
- 361 bedroom
- 1872 bedrooms
- 2053 bedrooms
- 244 bedrooms
- 05+ bedrooms
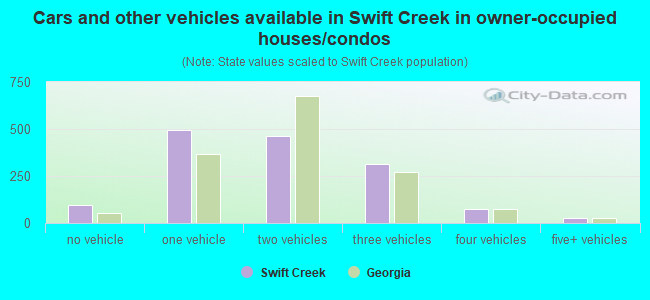
- Cars and other vehicles available in Swift Creek in owner-occupied houses/condos
- 97no vehicle
- 4951 vehicle
- 4632 vehicles
- 3133 vehicles
- 734 vehicles
- 285+ vehicles
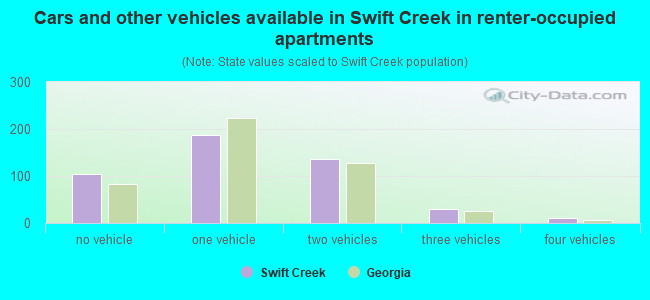
- Cars and other vehicles available in Swift Creek in renter-occupied apartments
- 104no vehicle
- 1871 vehicle
- 1362 vehicles
- 293 vehicles
- 104 vehicles
- 05+ vehicles
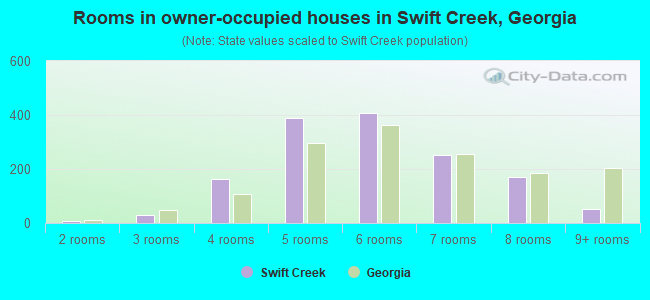
- Rooms in owner-occupied houses in Swift Creek, Georgia
- 01 room
- 62 rooms
- 283 rooms
- 1624 rooms
- 3885 rooms
- 4086 rooms
- 2537 rooms
- 1718 rooms
- 539+ rooms
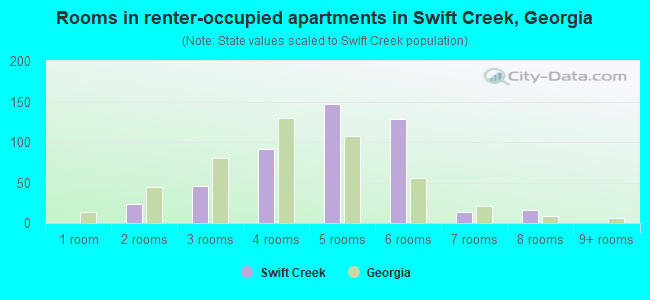
- Rooms in renter-occupied apartments in Swift Creek, Georgia
- 01 room
- 232 rooms
- 463 rooms
- 914 rooms
- 1475 rooms
- 1296 rooms
- 147 rooms
- 168 rooms
- 09+ rooms
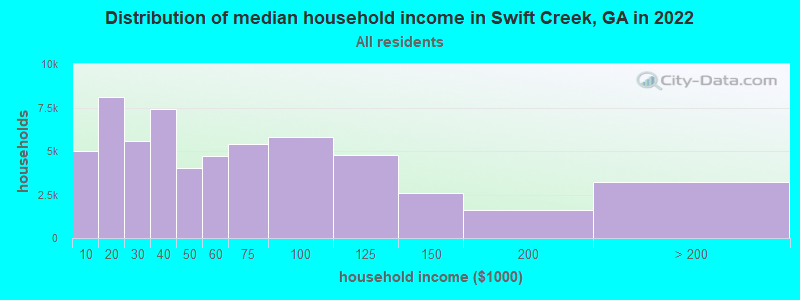
Swift Creek, GA household income distribution

- 5,028Less than $10,000
- 8,125$10,000 to $19,999
- 5,556$20,000 to $29,999
- 7,406$30,000 to $39,999
- 4,038$40,000 to $49,999
- 4,715$50,000 to $59,999
- 5,389$60,000 to $74,999
- 5,781$75,000 to $99,999
- 4,766$100,000 to $124,999
- 2,596$125,000 to $149,999
- 1,596$150,000 to $199,999
- 3,194$200,000 or more
Percentage of workers working in this county: 79.7%
Number of people working at home: 397 (15.0% of all workers)
Travel time to work (commute)
- Less than 5 minutes: 46
- 5 to 9 minutes: 199
- 10 to 14 minutes: 249
- 15 to 19 minutes: 444
- 20 to 24 minutes: 427
- 25 to 29 minutes: 122
- 30 to 34 minutes: 324
- 35 to 39 minutes: 51
- 40 to 44 minutes: 9
- 45 to 59 minutes: 54
- 60 to 89 minutes: 28
- 90 or more minutes: 38
Means of transportation to work:
- Drove a car alone: 1,579 (78.6%)
- Carpooled: 362 (18.0%)
- Bus or trolley bus: 19 (0.9%)
- Walked: 31 (1.5%)
- Worked at home: 19 (0.9%)
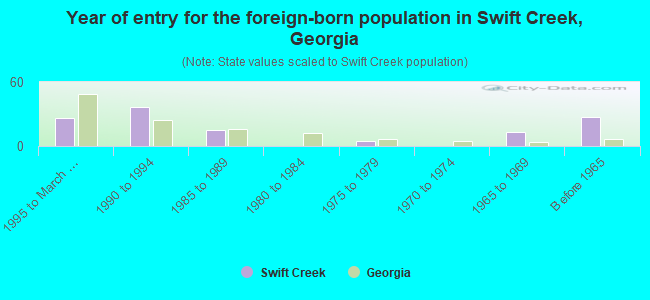
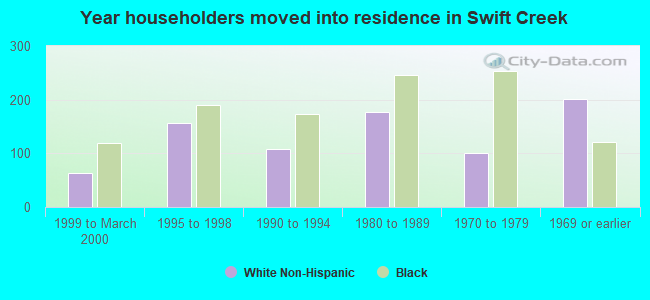
- Year of entry for the foreign-born population in Swift Creek, Georgia
- 261995 to March 2000
- 371990 to 1994
- 151985 to 1989
- 01980 to 1984
- 51975 to 1979
- 01970 to 1974
- 131965 to 1969
- 27Before 1965
Most common places of birth for foreign-born residents (%):
| Swift Creek: | 35.8% (44) |
| Georgia: | 0.3% (1,899) |
| Swift Creek: | 29.3% (36) |
| Georgia: | 2.9% (16,457) |
| Swift Creek: | 11.4% (14) |
| Georgia: | 0.2% (1,401) |
| Swift Creek: | 10.6% (13) |
| Georgia: | 1.1% (6,408) |
| Swift Creek: | 8.1% (10) |
| Georgia: | 0.7% (4,103) |
| Swift Creek: | 4.9% (6) |
| Georgia: | 0.2% (956) |
Place of birth for U.S.-born residents:
- This state: 4,651
- Other state: 631
- Northeast: 119
- Midwest: 76
- South: 367
- West: 69
66% of Swift Creek residents lived in the same house 5 years ago.
Out of people who lived in different houses, 69% lived in this county.
Out of people who lived in different counties, 88% lived in Georgia.
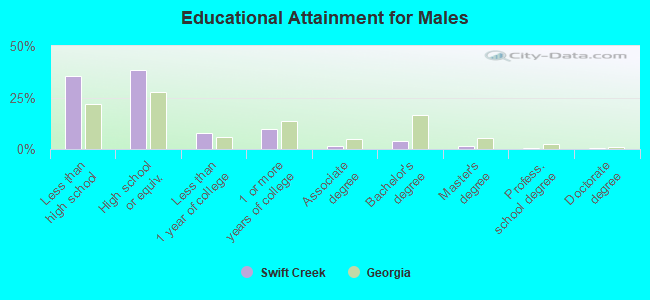
Education attainment for males 25 years and older:
- No schooling: 38
- Nursery to 4th grade: 36
- 5th and 6th grade: 57
- 7th and 8th grade: 101
- 9th grade: 67
- 10th grade: 118
- 11th grade: 82
- 12th grade, no diploma: 56
- High school graduate (or equivalency): 599
- Less than 1 year of college: 120
- Some college more than 1 year, no degree: 154
- Associate degree: 25
- Bachelor's degree: 64
- Master's degree: 24
- Professional school degree: 11
- Doctorate degree: 10
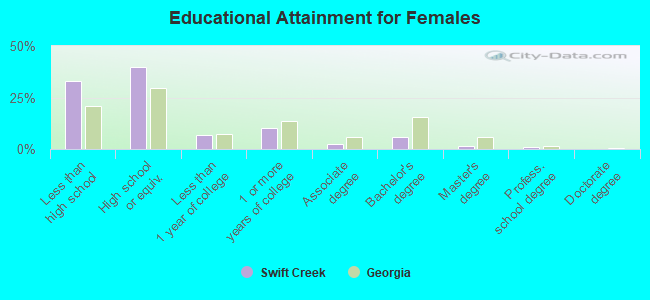
Education attainment for females 25 years and older:
- No schooling: 14
- Nursery to 4th grade: 33
- 5th and 6th grade: 31
- 7th and 8th grade: 148
- 9th grade: 64
- 10th grade: 118
- 11th grade: 134
- 12th grade, no diploma: 69
- High school graduate (or equivalency): 735
- Less than 1 year of college: 125
- Some college more than 1 year, no degree: 186
- Associate degree: 43
- Bachelor's degree: 108
- Master's degree: 28
- Professional school degree: 20
- Doctorate degree: 0
Housing units in structures:
- One, detached: 1,833
- One, attached: 10
- Two: 10
- 5 to 9: 68
- Mobile homes: 181
Median worth of mobile homes: $67,883
Housing units lacking complete kitchen facilities: 1.0%
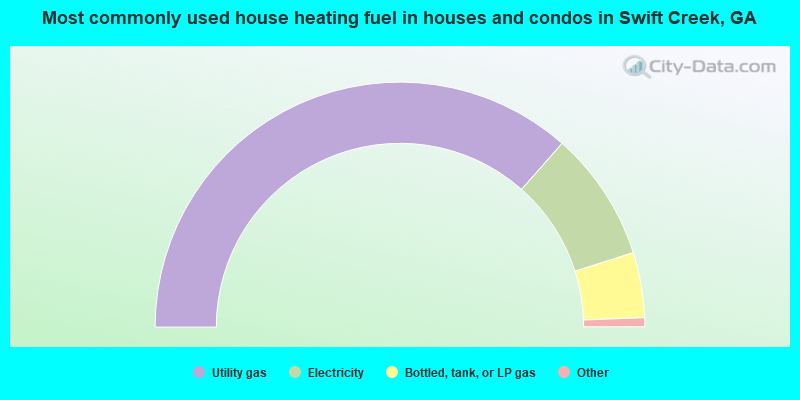
- 73.1%Utility gas
- 17.2%Electricity
- 8.6%Bottled, tank, or LP gas
- 0.4%Fuel oil, kerosene, etc.
- 0.4%Wood
- 0.3%No fuel used
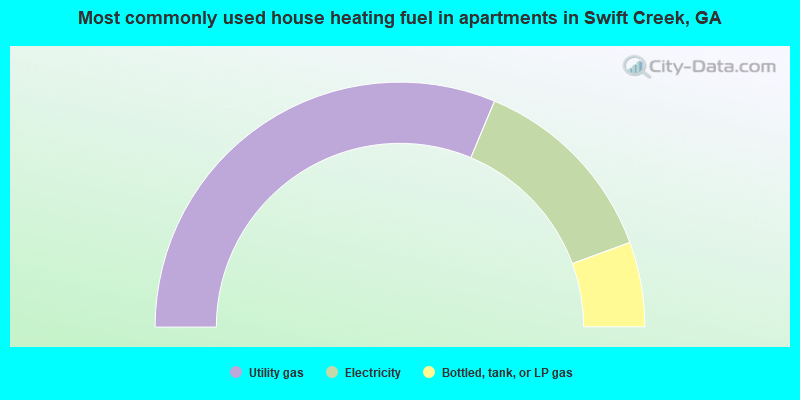
- 62.7%Utility gas
- 26.2%Electricity
- 11.2%Bottled, tank, or LP gas
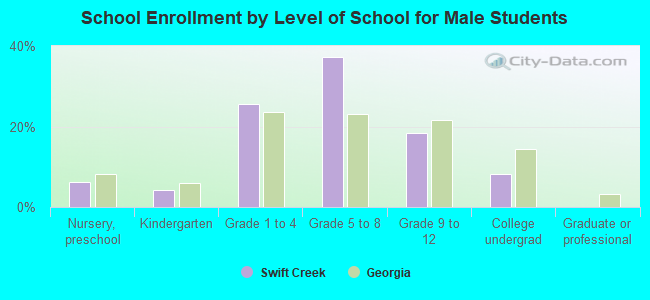
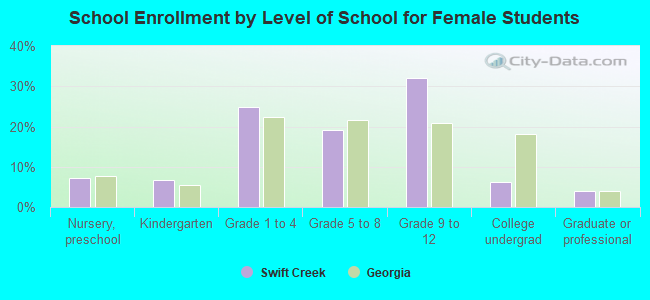
Private vs. public school enrollment:
| Here: | 4.6% |
| Georgia: | 8.4% |
| Here: | 2.6% |
| Georgia: | 8.5% |
| Here: | 0.0% |
| Georgia: | 22.9% |