Housing density: 1,510 houses/condos per square mile
Median price asked for vacant for-sale houses and condos in 2022 in this county: $989,514.
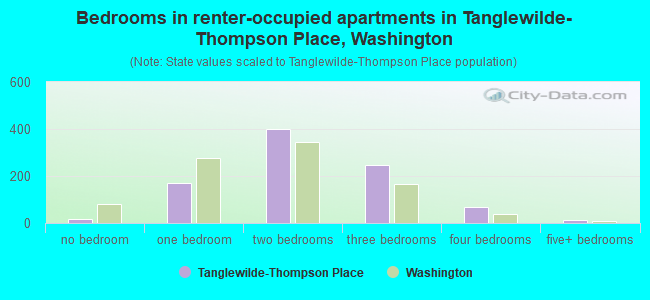
Median contract rent in 2022: $1,391 (lower quartile is $989, upper quartile is $1,707)
Median rent asked for vacant for-rent units in 2022: $1,001
Median gross rent in Tanglewilde-Thompson Place, WA in 2022: $1,568
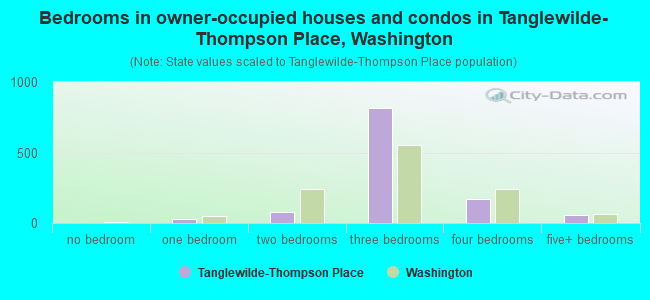
Housing units in Tanglewilde-Thompson Place with a mortgage: 918 (177 second mortgage, 113 home equity loan, 10 both second mortgage and home equity loan) Houses without a mortgage: 143
Compare current foreclosures near Tanglewilde-Thompson Place, WA:
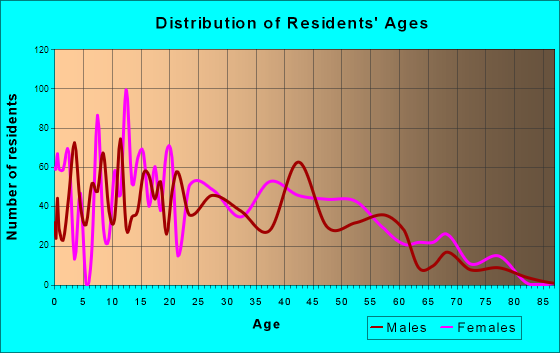
In family households: 202,402 (45,867 male householders, 20,294 female householders)
50,237 spouses, 67,556 children (61,286 natural, 2,052 adopted, 4,218 stepchildren), 3,913 grandchildren, 1,865 brothers or sisters, 1,842 parents, foster children, 2,345 other relatives, 7,096 non-relatives
In nonfamily households: 45,640 (15,464 male householders (11,003 living alone)), 19,025 female householders (15,101 living alone)), 11,151 nonrelatives
In group quarters: 4,222 (1,971 institutionalized population)
35,692 married couples with children.
12,281 single-parent households (3,025 men, 9,256 women).
82.9% of residents of Tanglewilde-Thompson Place speak English at home.
6.6% of residents speak Spanish at home (60% speak English very well, 26% speak English well, 13% speak English not well, 2% don't speak English at all).
2.1% of residents speak other Indo-European language at home (55% speak English very well, 28% speak English well, 18% speak English not well).
7.7% of residents speak Asian or Pacific Island language at home (47% speak English very well, 32% speak English well, 9% speak English not well, 12% don't speak English at all).
0.7% of residents speak other language at home (50% speak English very well, 26% speak English well, 24% speak English not well).
Foreign born population: 1,081 (13.1%)
(57.0% of them are naturalized citizens)
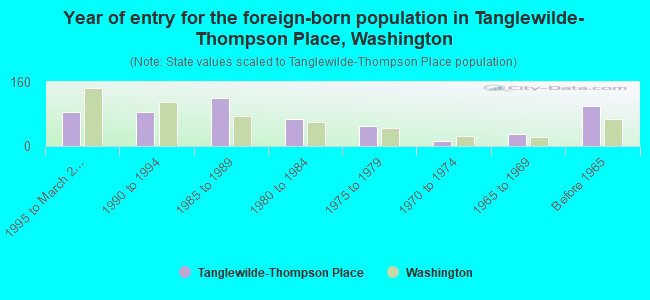
Year of entry for the foreign-born population in Tanglewilde-Thompson Place, Washington
851995 to March 2000
861990 to 1994
1191985 to 1989
681980 to 1984
511975 to 1979
121970 to 1974
301965 to 1969
99Before 1965
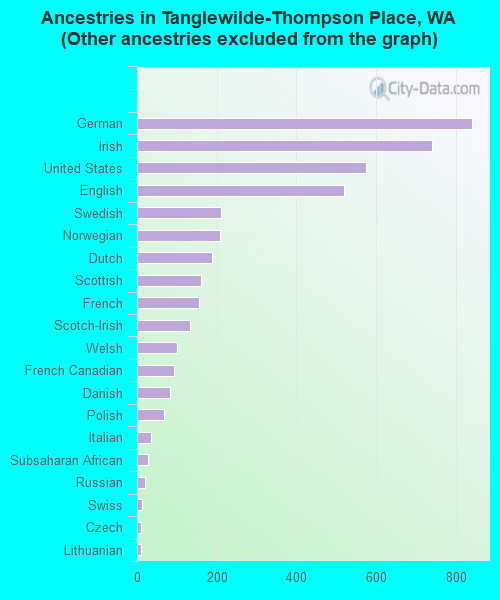
First ancestries reported:
Other: 2,106 (33.5%)
German: 842 (13.4%)
Irish: 741 (11.8%)
United States: 574 (9.1%)
English: 519 (8.2%)
Swedish: 210 (3.3%)
Norwegian: 209 (3.3%)
Dutch: 189 (3.0%)
Scottish: 160 (2.5%)
French: 155 (2.5%)
Scotch-Irish: 133 (2.1%)
Welsh: 100 (1.6%)
French Canadian: 93 (1.5%)
Danish: 83 (1.3%)
Polish: 69 (1.1%)
Italian: 34 (0.5%)
Subsaharan African: 28 (0.4%)
Russian: 19 (0.3%)
Swiss: 13 (0.2%)
Czech: 9 (0.1%)
Lithuanian: 9 (0.1%)
Most common places of birth for foreign-born residents (%):
Germany
Tanglewilde-Thompson Place:
14.2% (78)
Washington:
3.4% (21,167)
Mexico
Tanglewilde-Thompson Place:
14.2% (78)
Washington:
24.1% (148,115)
Korea
Tanglewilde-Thompson Place:
13.3% (73)
Washington:
6.2% (38,172)
Cambodia
Tanglewilde-Thompson Place:
12.4% (68)
Washington:
1.7% (10,656)
Vietnam
Tanglewilde-Thompson Place:
10.2% (56)
Washington:
6.7% (40,879)
Philippines
Tanglewilde-Thompson Place:
6.0% (33)
Washington:
7.6% (46,733)
Middle Africa
Tanglewilde-Thompson Place:
5.1% (28)
Washington:
0.0% (170)
United Kingdom
Tanglewilde-Thompson Place:
4.4% (24)
Washington:
3.3% (20,321)
Japan
Tanglewilde-Thompson Place:
3.6% (20)
Washington:
2.8% (16,936)
Thailand
Tanglewilde-Thompson Place:
3.5% (19)
Washington:
1.0% (6,294)
Guyana
Tanglewilde-Thompson Place:
3.3% (18)
Washington:
0.1% (379)
Ecuador
Tanglewilde-Thompson Place:
2.7% (15)
Washington:
0.1% (473)
Laos
Tanglewilde-Thompson Place:
2.0% (11)
Washington:
1.1% (6,542)
Canada
Tanglewilde-Thompson Place:
1.6% (9)
Washington:
7.7% (47,568)
Place of birth for U.S.-born residents:
This state: 2,416
Other state: 2,401
Northeast: 221
Midwest: 495
South: 498
West: 1,187
46% of Tanglewilde-Thompson Place residents lived in the same house 5 years ago. Out of people who lived in different houses, 54% lived in this county. Out of people who lived in different counties, 51% lived in Washington.
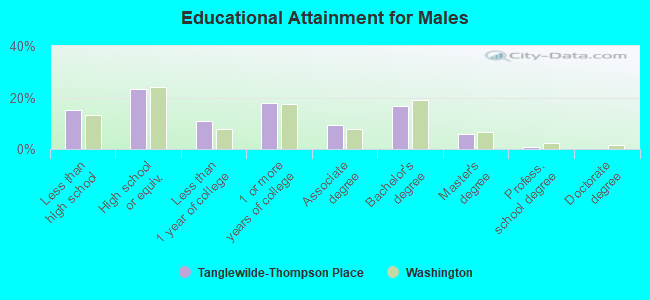
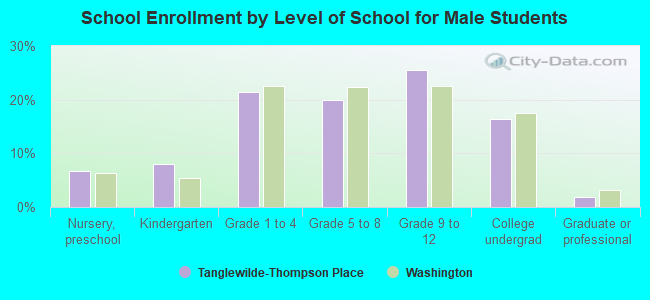
Education attainment for males 25 years and older:
No schooling: 17
Nursery to 4th grade: 0
5th and 6th grade: 34
7th and 8th grade: 28
9th grade: 19
10th grade: 16
11th grade: 47
12th grade, no diploma: 78
High school graduate (or equivalency): 371
Less than 1 year of college: 175
Some college more than 1 year, no degree: 285
Associate degree: 150
Bachelor's degree: 269
Master's degree: 91
Professional school degree: 15
Doctorate degree: 0
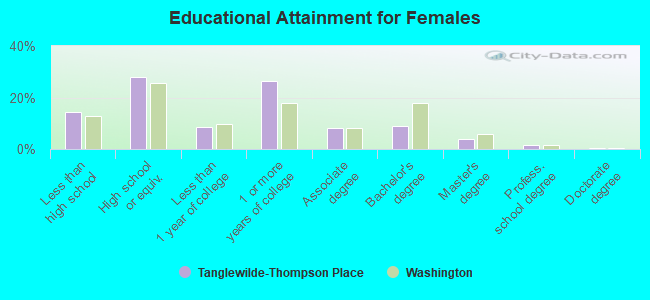
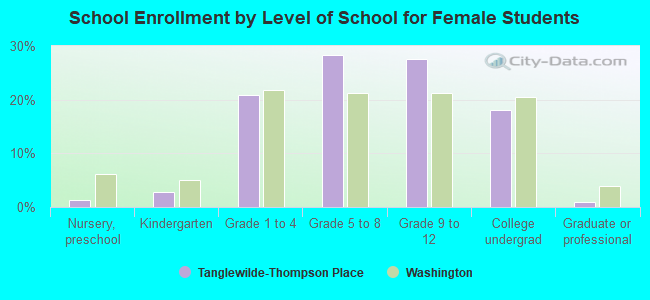
Education attainment for females 25 years and older: