Housing density: 327 houses/condos per square mile
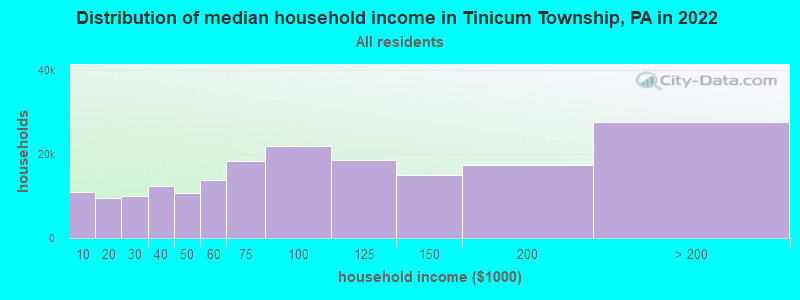
Median price asked for vacant for-sale houses and condos in 2022 in this county: $246,679.
Median contract rent in 2022: $1,088 (lower quartile is $946, upper quartile is $1,318)
Median rent asked for vacant for-rent units in 2022: $1,142
Median gross rent in Tinicum Township, PA in 2022: $1,283
Housing units in Tinicum Township with a mortgage: 642 (31 second mortgage, 71 home equity loan, 15 both second mortgage and home equity loan) Houses without a mortgage: 477
Compare current foreclosures near Tinicum Township, PA:
In family households: 453,586 (91,569 male householders, 48,290 female householders)
99,383 spouses, 170,789 children (161,642 natural, 3,823 adopted, 5,324 stepchildren), 11,365 grandchildren, 5,918 brothers or sisters, 5,812 parents, foster children, 6,644 other relatives, 10,420 non-relatives
In nonfamily households: 82,338 (29,827 male householders (23,777 living alone)), 39,014 female householders (33,920 living alone)), 13,497 nonrelatives
In group quarters: 23,055 (7,828 institutionalized population)
94,926 married couples with children.
28,980 single-parent households (5,380 men, 23,600 women).
95.0% of residents of Tinicum Township speak English at home.
0.7% of residents speak Spanish at home (81% speak English very well, 19% speak English well).
3.5% of residents speak other Indo-European language at home (61% speak English very well, 23% speak English well, 16% speak English not well).
0.3% of residents speak Asian or Pacific Island language at home (100% speak English very well).
0.5% of residents speak other language at home (100% speak English very well).
Foreign born population: 129 (2.8%)
(86.0% of them are naturalized citizens)
Year of entry for the foreign-born population in Tinicum Township, Pennsylvania
01995 to March 2000
131990 to 1994
01985 to 1989
141980 to 1984
61975 to 1979
81970 to 1974
01965 to 1969
41Before 1965
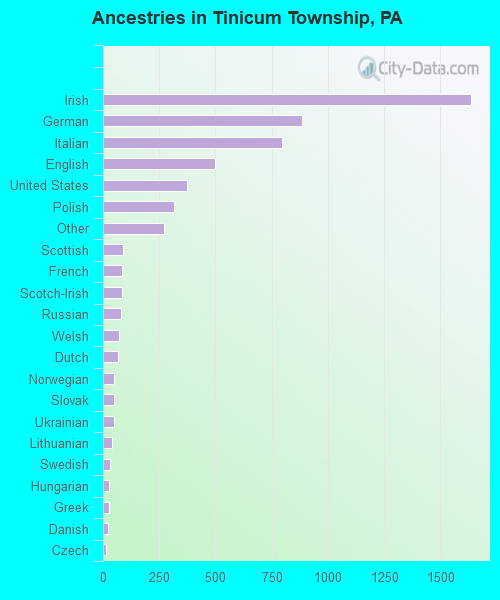
First ancestries reported:
Irish: 1,635 (29.4%)
German: 886 (15.9%)
Italian: 795 (14.3%)
English: 499 (9.0%)
United States: 375 (6.7%)
Polish: 314 (5.6%)
Other: 273 (4.9%)
Scottish: 89 (1.6%)
French: 86 (1.5%)
Scotch-Irish: 84 (1.5%)
Russian: 82 (1.5%)
Welsh: 69 (1.2%)
Dutch: 67 (1.2%)
Norwegian: 51 (0.9%)
Slovak: 48 (0.9%)
Ukrainian: 48 (0.9%)
Lithuanian: 41 (0.7%)
Swedish: 32 (0.6%)
Hungarian: 26 (0.5%)
Greek: 25 (0.4%)
Danish: 22 (0.4%)
Czech: 15 (0.3%)
Arab: 5 (0.09%)
Most common places of birth for foreign-born residents (%):
Italy
Tinicum Township:
22.0% (18)
Pennsylvania:
6.0% (30,559)
Iran
Tinicum Township:
18.3% (15)
Pennsylvania:
0.6% (3,034)
Greece
Tinicum Township:
9.8% (8)
Pennsylvania:
1.4% (7,362)
India
Tinicum Township:
8.5% (7)
Pennsylvania:
7.4% (37,541)
Turkey
Tinicum Township:
8.5% (7)
Pennsylvania:
0.4% (2,237)
United Kingdom
Tinicum Township:
7.3% (6)
Pennsylvania:
4.6% (23,171)
Germany
Tinicum Township:
7.3% (6)
Pennsylvania:
5.1% (25,685)
Canada
Tinicum Township:
7.3% (6)
Pennsylvania:
3.0% (15,200)
France
Tinicum Township:
6.1% (5)
Pennsylvania:
0.8% (4,181)
Czechoslovakia (includes Czech Republic and Slovakia)
Tinicum Township:
4.9% (4)
Pennsylvania:
0.7% (3,451)
Place of birth for U.S.-born residents:
This state: 3,903
Other state: 360
Northeast: 143
Midwest: 34
South: 172
West: 11
66% of Tinicum Township residents lived in the same house 5 years ago. Out of people who lived in different houses, 62% lived in this county. Out of people who lived in different counties, 69% lived in Pennsylvania.
Education attainment for males 25 years and older:
No schooling: 21
Nursery to 4th grade: 0
5th and 6th grade: 0
7th and 8th grade: 27
9th grade: 66
10th grade: 51
11th grade: 67
12th grade, no diploma: 75
High school graduate (or equivalency): 751
Less than 1 year of college: 138
Some college more than 1 year, no degree: 93
Associate degree: 74
Bachelor's degree: 74
Master's degree: 22
Professional school degree: 8
Doctorate degree: 7
Education attainment for females 25 years and older: