Toledo, OH (Ohio) Houses and Residents
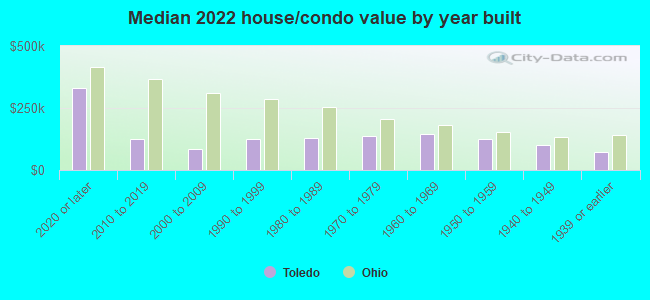
| Toledo: | $106,400 |
| Ohio: | $204,100 |
Mean price in 2022:
Detached houses: $131,824
Here: $131,824 State: $254,366 Townhouses or other attached units: $138,651
Here: $138,651 State: $225,733 In 2-unit structures: $69,256
Here: $69,256 State: $144,384 In 3-to-4-unit structures: $676,342
Here: $676,342 State: $203,002 In 5-or-more-unit structures: $123,968
Here: $123,968 State: $211,593 Mobile homes: $23,049
Here: $23,049 State: $62,719
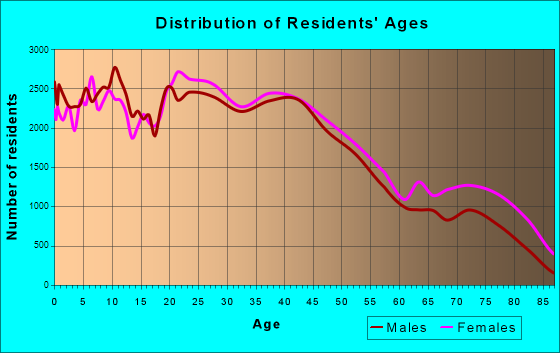
Total population: 281,031 (All urban)
Houses: 132,209 (121,261 occupied: 68,044 owner occupied, 53,217 renter occupied)
| % of renters here: | 44% |
| State: | 33% |
Housing density: 1,640 houses/condos per square mile
Median price asked for vacant for-sale houses and condos in 2022: $26,723.
Median contract rent in 2022: $673 (lower quartile is $532, upper quartile is $834)
Median rent asked for vacant for-rent units in 2022: $670
Median gross rent in Toledo, OH in 2022: $846
Housing units in Toledo with a mortgage: 37,115 (3,147 second mortgage, 132 home equity loan, 2,296 both second mortgage and home equity loan)
Houses without a mortgage: 2,175
Median household income for houses/condos with a mortgage: $71,202
Median household income for apartments without a mortgage: $47,032
Median monthly housing costs: $794
Compare current foreclosures in Toledo, OH:
| Photo | Address | Area | Beds / Baths | Price | Details |
|---|---|---|---|---|---|

|
#1
Leybourn Ave
Toledo, OH 43612
|
1,126 sq. feet
|
1 baths 3 beds |
$47,900
|
show details |

|
#2
Nottingham Ter
Toledo, OH 43610
|
2,073 sq. feet
|
1 baths 4 beds |
$47,500
|
show details |

|
#3
Bricker Ave
Toledo, OH 43608
|
1,611 sq. feet
|
1 baths 3 beds |
$37,500
|
show details |

|
#4
Duncan Rd
Toledo, OH 43613
|
820 sq. feet
|
1 baths 2 beds |
$34,900
|
show details |

|
#5
Birckhead Pl
Toledo, OH 43608
|
2,753 sq. feet
|
1 baths 3 beds |
$84,900
|
show details |

|
#6
Pratt St
Toledo, OH 43605
|
857 sq. feet
|
1 baths 3 beds |
$4,900
|
show details |

|
#7
Burger St
Toledo, OH 43605
|
860 sq. feet
|
1 baths 2 beds |
$19,900
|
show details |

|
#8
Asbury Dr
Toledo, OH 43612
|
1,364 sq. feet
|
1 baths 5 beds |
show details | |

|
#9
Claxton St
Toledo, OH 43615
|
1,234 sq. feet
|
1 baths 3 beds |
show details | |

|
#10
Hampton Ave
Toledo, OH 43609
|
988 sq. feet
|
1 baths 2 beds |
show details |
| Photo | Address | Area | Beds / Baths | Price | Details |
|---|---|---|---|---|---|

|
#11
Wallingford Dr
Toledo, OH 43612
|
1,224 sq. feet
|
1 baths 3 beds |
show details | |

|
#12
Austin Bluffs Ct
Toledo, OH 43615
|
2,100 sq. feet
|
2 baths 4 beds |
show details | |

|
#13
Letchworth Pkwy
Toledo, OH 43606
|
1,526 sq. feet
|
1 baths 3 beds |
show details | |

|
#14
Copland Blvd
Toledo, OH 43614
|
2,936 sq. feet
|
2 baths 3 beds |
show details | |

|
#15
Wildwood Blvd
Toledo, OH 43614
|
1,078 sq. feet
|
1 baths 2 beds |
show details | |

|
#16
Berdan Ave
Toledo, OH 43613
|
1,352 sq. feet
|
1 baths 3 beds |
show details | |

|
#17
118th St
Toledo, OH 43611
|
1,279 sq. feet
|
1 baths 4 beds |
show details | |

|
#18
Licking St
Toledo, OH 43605
|
- sq. feet
|
- baths - beds |
$7,900
|
show details |

|
#19
293rd St
Toledo, OH 43611
|
1,716 sq. feet
|
1 baths 3 beds |
show details | |

|
#20
Walden Ave
Toledo, OH 43605
|
1 sq. feet
|
1 baths 3 beds |
show details |
| Photo | Address | Area | Beds / Baths | Price | Details |
|---|---|---|---|---|---|

|
#21
Palmer St
Toledo, OH 43608
|
- sq. feet
|
- baths - beds |
$2,968
|
show details |

|
#22
Cuba St
Toledo, OH 43615
|
1,363 sq. feet
|
1 baths 3 beds |
show details | |

|
#23
Secor Rd
Toledo, OH 43607
|
882 sq. feet
|
1 baths 2 beds |
show details | |

|
#24
Glenbrook Dr
Toledo, OH 43614
|
1,180 sq. feet
|
1 baths 3 beds |
show details | |

|
#25
Parkside Blvd
Toledo, OH 43607
|
1,554 sq. feet
|
1 baths 3 beds |
show details | |

|
#26
Gould Rd
Toledo, OH 43612
|
748 sq. feet
|
1 baths 2 beds |
show details | |

|
#27
San Jose Dr
Toledo, OH 43615
|
1,504 sq. feet
|
1 baths 3 beds |
show details | |

|
#28
Bonaparte Dr
Toledo, OH 43615
|
1,152 sq. feet
|
1 baths 3 beds |
show details | |

|
#29
Westgate Rd
Toledo, OH 43615
|
1,056 sq. feet
|
1 baths 2 beds |
show details | |

|
#30
Lakeside Ave
Toledo, OH 43611
|
1,320 sq. feet
|
1 baths 2 beds |
show details |
| Photo | Address | Area | Beds / Baths | Price | Details |
|---|---|---|---|---|---|

|
#31
Vinal St
Toledo, OH 43605
|
1,030 sq. feet
|
1 baths 2 beds |
show details | |

|
#32
Reineck Dr
Toledo, OH 43605
|
925 sq. feet
|
1 baths 3 beds |
show details | |

|
#33
Sweetbriar Ct
Toledo, OH 43615
|
1,401 sq. feet
|
2 baths 2 beds |
show details | |

|
#34
Heatherdowns Blvd
Toledo, OH 43614
|
1,205 sq. feet
|
1 baths 3 beds |
show details | |

|
#35
Derbyshire Rd
Toledo, OH 43615
|
1,275 sq. feet
|
1 baths 3 beds |
show details | |

|
#36
Northtowne Dr
Toledo, OH 43611
|
2,052 sq. feet
|
1 baths 3 beds |
show details | |

|
#37
E Oakland St
Toledo, OH 43608
|
836 sq. feet
|
1 baths 2 beds |
show details | |

|
#38
Giant St
Toledo, OH 43613
|
852 sq. feet
|
1 baths 2 beds |
show details | |

|
#39
Winona Dr
Toledo, OH 43613
|
1,752 sq. feet
|
2 baths 3 beds |
show details | |

|
#40
Fairhaven Dr
Toledo, OH 43623
|
1,009 sq. feet
|
1 baths 3 beds |
show details |
| Photo | Address | Area | Beds / Baths | Price | Details |
|---|---|---|---|---|---|

|
#41
Carrietowne Ln
Toledo, OH 43615
|
2,778 sq. feet
|
3 baths 3 beds |
show details | |

|
#42
Kenilworth Ave
Toledo, OH 43610
|
1,631 sq. feet
|
1 baths 3 beds |
show details | |

|
#43
Andora Dr
Toledo, OH 43609
|
1,170 sq. feet
|
1 baths 3 beds |
show details | |

|
#44
Pinelawn Dr
Toledo, OH 43614
|
1,887 sq. feet
|
2 baths 3 beds |
show details | |

|
#45
Leybourn Ave
Toledo, OH 43612
|
888 sq. feet
|
1 baths 2 beds |
show details | |

|
#46
Steel St
Toledo, OH 43605
|
1,200 sq. feet
|
1 baths 3 beds |
show details | |

|
#47
Apple Ave
Toledo, OH 43609
|
946 sq. feet
|
1 baths 3 beds |
show details | |

|
#48
Asbury Dr
Toledo, OH 43612
|
950 sq. feet
|
1 baths 2 beds |
show details | |

|
#49
Upton Ave
Toledo, OH 43606
|
1,114 sq. feet
|
1 baths 3 beds |
show details | |

|
Check over 1 million property listings on Foreclosure.com!
|
browse all offers | |||

Latest news about housing in Toledo, OH collected exclusively by city-data.com from local newspapers, TV, and radio stations


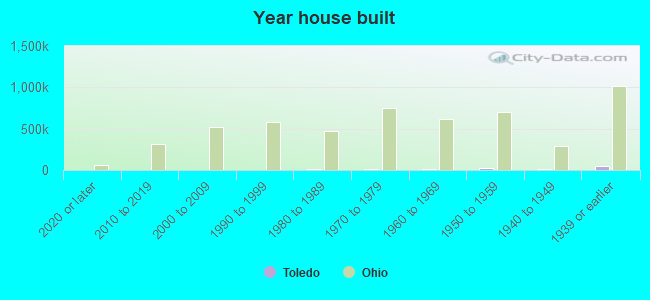
Median year apartment built: 1961
Household type by relationship:
Households: 266,289- Male householders: 52,590 (22,272 living alone), Female householders: 68,671 (26,267 living alone)
35,987 spouses (35,587 opposite-sex spouses), 10,148 unmarried partners, (9,775 opposite-sex unmarried partners), 70,600 children (65,481 natural, 1,533 adopted, 3,586 stepchildren), 5,684 grandchildren, 1,796 brothers or sisters, 1,181 parents, 66 foster children, 2,860 other relatives, 11,117 non-relatives
- In group quarters: 5,589
Size of family households: 30,466 2-persons, 14,142 3-persons, 10,031 4-persons, 4,368 5-persons, 1,541 6-persons, 1,303 7-or-more-persons.
Size of nonfamily households: 48,539 1-person, 8,025 2-persons, 1,501 3-persons, 705 4-persons, 517 5-persons, 123 7-or-more-persons.
22,119 married couples with children.
29,177 single-parent households (4,946 men, 24,231 women).
93.3% of residents of Toledo speak English at home.
3.1% of residents speak Spanish at home (72% speak English very well, 15% speak English well, 9% speak English not well, 3% don't speak English at all).
1.3% of residents speak other Indo-European language at home (78% speak English very well, 15% speak English well, 6% speak English not well).
0.8% of residents speak Asian or Pacific Island language at home (56% speak English very well, 25% speak English well, 16% speak English not well, 3% don't speak English at all).
1.3% of residents speak other language at home (78% speak English very well, 15% speak English well, 5% speak English not well, 2% don't speak English at all).
Foreign born population: 9,487 (3.6%)
(58.4% of them are naturalized citizens)
| Here: | 6.4 |
| State: | 6.7 |
| Here: | 4.6 |
| State: | 4.4 |
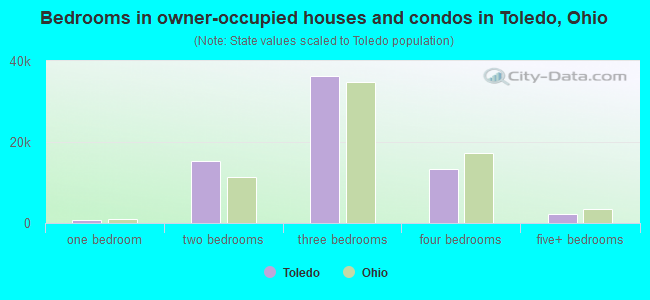
- Bedrooms in owner-occupied houses and condos in Toledo, Ohio
- 112no bedroom
- 7561 bedroom
- 15,2542 bedrooms
- 36,3643 bedrooms
- 13,3354 bedrooms
- 2,2235+ bedrooms
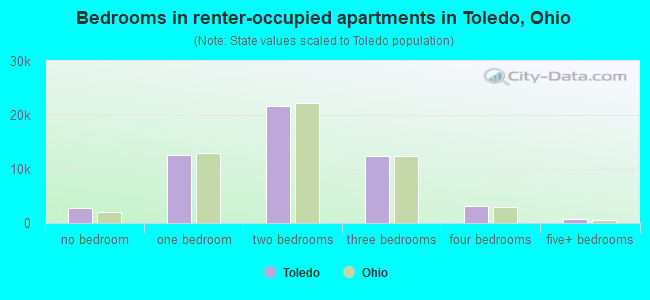
- Bedrooms in renter-occupied apartments in Toledo, Ohio
- 2,833no bedroom
- 12,5141 bedroom
- 21,7032 bedrooms
- 12,3733 bedrooms
- 3,0574 bedrooms
- 7375+ bedrooms
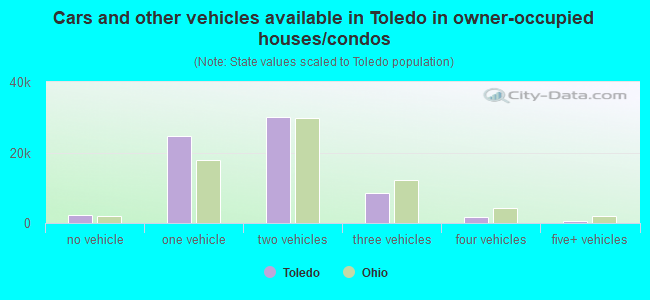
- Cars and other vehicles available in Toledo in owner-occupied houses/condos
- 2,394no vehicle
- 24,5841 vehicle
- 30,1522 vehicles
- 8,6153 vehicles
- 1,6234 vehicles
- 6765+ vehicles
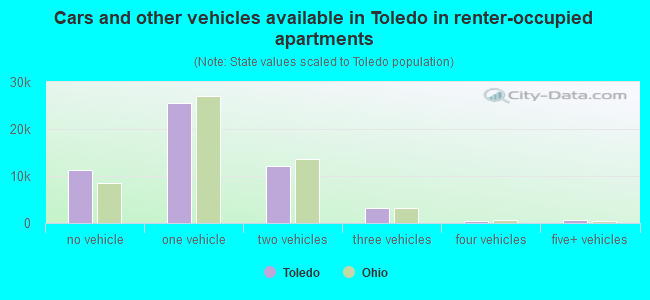
- Cars and other vehicles available in Toledo in renter-occupied apartments
- 11,294no vehicle
- 25,6091 vehicle
- 12,1272 vehicles
- 3,1323 vehicles
- 3534 vehicles
- 7025+ vehicles
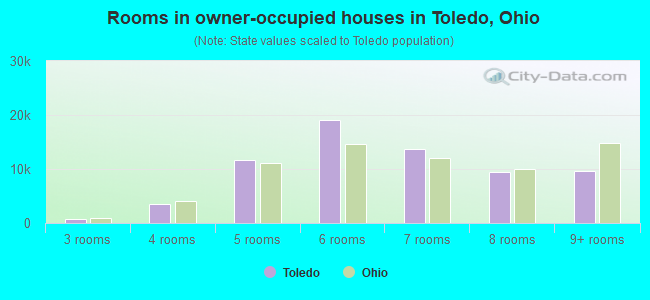
- Rooms in owner-occupied houses in Toledo, Ohio
- 1121 room
- 692 rooms
- 8303 rooms
- 3,4814 rooms
- 11,6945 rooms
- 19,0986 rooms
- 13,6457 rooms
- 9,5018 rooms
- 9,6149+ rooms
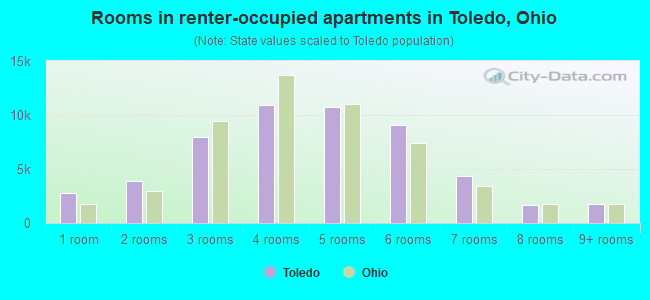
- Rooms in renter-occupied apartments in Toledo, Ohio
- 2,7731 room
- 3,9242 rooms
- 8,0033 rooms
- 10,9554 rooms
- 10,7415 rooms
- 9,0946 rooms
- 4,3387 rooms
- 1,6298 rooms
- 1,7609+ rooms
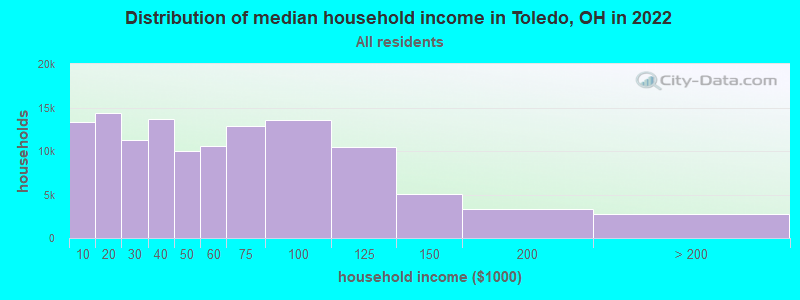
Toledo, OH household income distribution

- 13,330Less than $10,000
- 14,355$10,000 to $19,999
- 11,321$20,000 to $29,999
- 13,690$30,000 to $39,999
- 10,011$40,000 to $49,999
- 10,605$50,000 to $59,999
- 12,837$60,000 to $74,999
- 13,514$75,000 to $99,999
- 10,496$100,000 to $124,999
- 5,023$125,000 to $149,999
- 3,305$150,000 to $199,999
- 2,774$200,000 or more
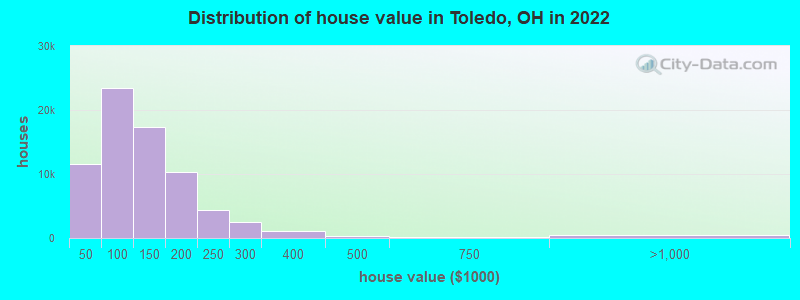
Home value of owner - occupied houses in 2022 in Toledo, OH
-
- 1,592Less than $10,000
- 978$10,000 to $14,999
- 918$15,000 to $19,999
- 1,537$20,000 to $24,999
- 800$25,000 to $29,999
- 1,437$30,000 to $34,999
- 788$35,000 to $39,999
- 3,491$40,000 to $49,999
- 3,955$50,000 to $59,999
- 4,537$60,000 to $69,999
- 3,504$70,000 to $79,999
- 4,455$80,000 to $89,999
- 3,508$90,000 to $99,999
- 9,865$100,000 to $124,999
- 7,429$125,000 to $149,999
- 6,631$150,000 to $174,999
- 3,666$175,000 to $199,999
- 4,453$200,000 to $249,999
- 2,522$250,000 to $299,999
- 1,142$300,000 to $399,999
- 286$400,000 to $499,999
- 85$500,000 to $749,999
- 127$750,000 to $999,999
- 104$1,000,000 to $1,499,999
- 234$2,000,000 or more
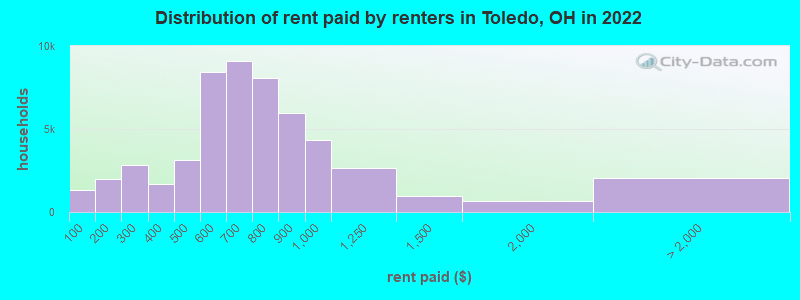
Rent paid by renters in 2022 in Toledo, OH
-
- 1,301Less than $100
- 992$100 to $149
- 968$150 to $199
- 1,769$200 to $249
- 1,086$250 to $299
- 940$300 to $349
- 718$350 to $399
- 1,020$400 to $449
- 2,094$450 to $499
- 3,037$500 to $549
- 5,387$550 to $599
- 4,069$600 to $649
- 5,046$650 to $699
- 4,093$700 to $749
- 3,995$750 to $799
- 5,959$800 to $899
- 4,346$900 to $999
- 2,671$1,000 to $1,249
- 981$1,250 to $1,499
- 680$1,500 to $1,999
- 147$2,000 to $2,499
- 72$2,500 to $2,999
- 1,846No cash rent
Percentage of workers working in this county: 79.6%
Number of people working at home: 6,627 (5.7% of all workers)
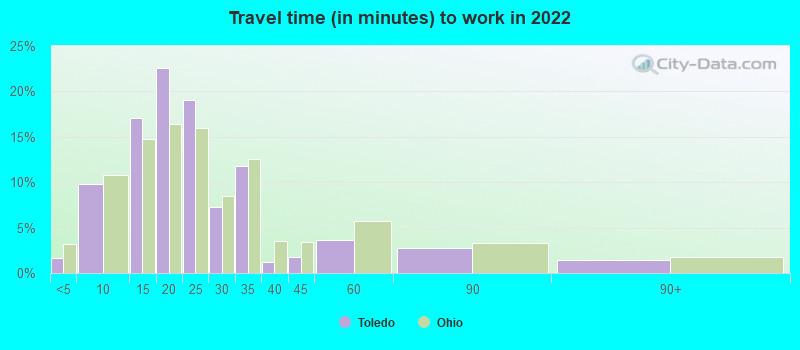
Travel time to work (commute)
- Less than 5 minutes: 2,403
- 5 to 9 minutes: 11,573
- 10 to 14 minutes: 20,520
- 15 to 19 minutes: 26,571
- 20 to 24 minutes: 20,655
- 25 to 29 minutes: 7,411
- 30 to 34 minutes: 10,190
- 35 to 39 minutes: 1,747
- 40 to 44 minutes: 1,869
- 45 to 59 minutes: 2,622
- 60 to 89 minutes: 2,827
- 90 or more minutes: 1,596
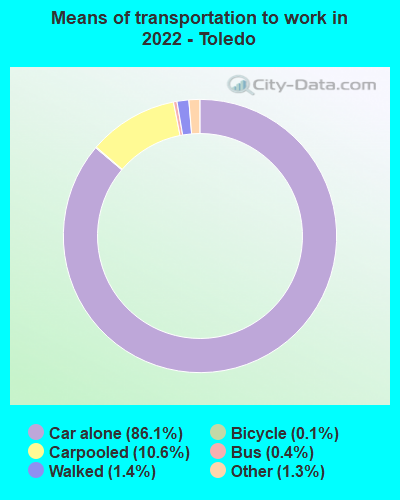
Means of transportation to work:
- Drove a car alone: 101,467 (81.5%)
- Carpooled: 12,501 (10.0%)
- Bus: 528 (0.4%)
- Taxi: 1,561 (1.3%)
- Bicycle: 125 (0.1%)
- Walked: 1,638 (1.3%)
- Worked at home: 6,627 (5.3%)
- Unemployment by race in 2022
- Unemployment rate for White non-Hispanic residents
- 3.9%Males
- 3.4%Females
- Unemployment rate for Black residents
- 9.6%Males
- 8.5%Females
- Unemployment rate for American Indian and Alaska Native residents
- 10.0%Males
- Unemployment rate for Asian residents
- 5.3%Males
- 2.6%Females
- Unemployment rate for other race residents
- 10.0%Males
- 9.9%Females
- Unemployment rate for two or more race residents
- 12.8%Males
- 5.8%Females
- Unemployment rate for Hispanic or Latino residents
- 4.1%Males
- 7.4%Females
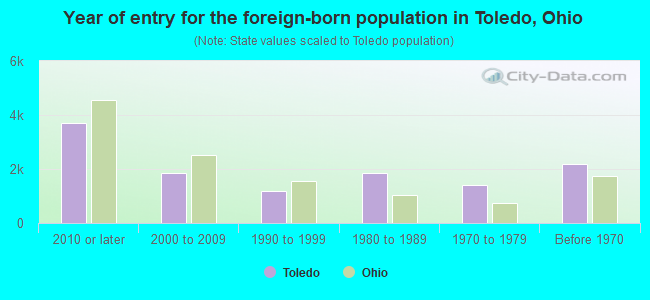
- Year of entry for the foreign-born population in Toledo, Ohio
- 3,7042010 or later
- 1,8372000 to 2009
- 1,1981990 to 1999
- 1,8421980 to 1989
- 1,4061970 to 1979
- 2,179Before 1970
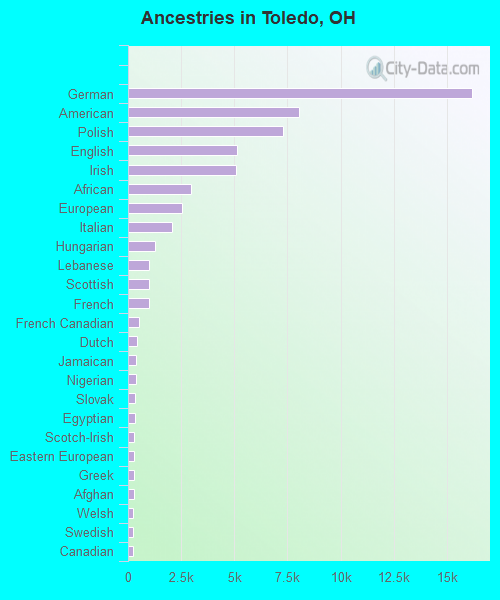
First ancestries reported:
- German: 16,173 (12.3%)
- American: 8,031 (6.1%)
- Polish: 7,276 (5.6%)
- English: 5,117 (3.9%)
- Irish: 5,079 (3.9%)
- African: 2,983 (2.3%)
- European: 2,537 (1.9%)
- Italian: 2,087 (1.6%)
- Hungarian: 1,250 (1.0%)
- Lebanese: 1,011 (0.8%)
- Scottish: 996 (0.8%)
- French: 980 (0.7%)
- French Canadian: 500 (0.4%)
- Dutch: 413 (0.3%)
- Jamaican: 389 (0.3%)
- Nigerian: 368 (0.3%)
- Slovak: 329 (0.3%)
- Egyptian: 320 (0.2%)
- Scotch-Irish: 300 (0.2%)
- Eastern European: 287 (0.2%)
- Greek: 282 (0.2%)
- Afghan: 262 (0.2%)
- Welsh: 247 (0.2%)
- Swedish: 236 (0.2%)
- Canadian: 223 (0.2%)
- Haitian: 194 (0.1%)
- Norwegian: 193 (0.1%)
- Czech: 183 (0.1%)
- Arab: 171 (0.1%)
- Liberian: 162 (0.1%)
- Ghanaian: 148 (0.1%)
- Guyanese: 144 (0.1%)
- Jordanian: 141 (0.1%)
- Ukrainian: 128 (0.10%)
- British: 122 (0.09%)
- West Indian: 114 (0.09%)
- Finnish: 112 (0.09%)
- Romanian: 109 (0.08%)
- Zimbabwean: 106 (0.08%)
- Russian: 96 (0.07%)
- Belgian: 89 (0.07%)
- Palestinian: 75 (0.06%)
- Brazilian: 69 (0.05%)
- Iranian: 65 (0.05%)
- Northern European: 62 (0.05%)
- Sierra Leonean: 61 (0.05%)
- Swiss: 55 (0.04%)
- Syrian: 51 (0.04%)
- Scandinavian: 49 (0.04%)
- Iraqi: 44 (0.03%)
- Czechoslovakian: 43 (0.03%)
- Soviet Union: 42 (0.03%)
- Somali: 36 (0.03%)
- Slovene: 35 (0.03%)
- Turkish: 34 (0.03%)
- Pennsylvania German: 33 (0.03%)
- Sudanese: 30 (0.02%)
- Austrian: 26 (0.02%)
- Yugoslavian: 23 (0.02%)
- Albanian: 22 (0.02%)
- Portuguese: 21 (0.02%)
- Bulgarian: 21 (0.02%)
- Croatian: 20 (0.02%)
- Bahamian: 17 (0.01%)
- British West Indian: 15 (0.01%)
- Danish: 14 (0.01%)
- German Russian: 14 (0.01%)
- Lithuanian: 11 (0.01%)
- Trinidadian and Tobagonian: 10 (0.01%)
- Ethiopian: 10 (0.01%)
- Cypriot: 8 (0.01%)
- Australian: 8 (0.01%)
- Armenian: 8 (0.01%)
Most common places of birth for foreign-born residents (%):
| Toledo: | 13.3% (1,205) |
| Ohio: | 7.8% (44,796) |
| Toledo: | 5.8% (524) |
| Ohio: | 6.2% (35,703) |
| Toledo: | 5.2% (469) |
| Ohio: | 0.7% (3,862) |
| Toledo: | 4.7% (424) |
| Ohio: | 0.7% (4,187) |
| Toledo: | 4.4% (396) |
| Ohio: | 11.6% (66,525) |
| Toledo: | 3.5% (321) |
| Ohio: | 2.2% (12,846) |
| Toledo: | 3.3% (297) |
| Ohio: | 2.6% (14,988) |
| Toledo: | 2.7% (246) |
| Ohio: | 2.0% (11,398) |
| Toledo: | 2.7% (242) |
| Ohio: | 0.5% (2,773) |
| Toledo: | 2.6% (237) |
| Ohio: | 0.8% (4,651) |
| Toledo: | 2.5% (229) |
| Ohio: | 0.6% (3,669) |
| Toledo: | 2.4% (221) |
| Ohio: | 0.2% (1,151) |
| Toledo: | 2.2% (199) |
| Ohio: | 1.2% (7,029) |
| Toledo: | 2.0% (184) |
| Ohio: | 1.6% (9,312) |
| Toledo: | 2.0% (180) |
| Ohio: | 1.0% (5,444) |
| Toledo: | 1.9% (176) |
| Ohio: | 0.3% (1,707) |
| Toledo: | 1.8% (166) |
| Ohio: | 3.1% (17,818) |
| Toledo: | 1.7% (157) |
| Ohio: | 1.1% (6,549) |
| Toledo: | 1.5% (140) |
| Ohio: | 0.3% (1,435) |
Place of birth for U.S.-born residents:
- This state: 203,922
- Other state: 51,284
- Northeast: 5,601
- Midwest: 24,623
- South: 16,344
- West: 4,716
87.8% of Toledo residents lived in the same house 1 years ago.
Out of people who lived in different houses, 38.3% lived in this county.
Out of people who lived in different counties, 64.7% lived in Ohio.
| Toledo: | 87.8% |
| State average: | 87.8% |
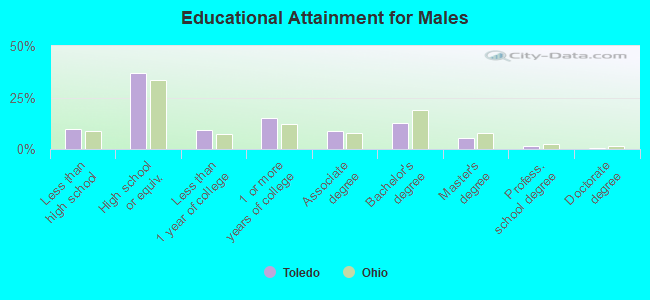
Education attainment for males 25 years and older:
- No schooling: 1,125
- Nursery to 4th grade: 128
- 5th and 6th grade: 750
- 7th and 8th grade: 468
- 9th grade: 873
- 10th grade: 1,023
- 11th grade: 1,249
- 12th grade, no diploma: 2,555
- High school graduate (or equivalency): 31,159
- Less than 1 year of college: 7,782
- Some college more than 1 year, no degree: 12,609
- Associate degree: 7,550
- Bachelor's degree: 10,681
- Master's degree: 4,640
- Professional school degree: 1,239
- Doctorate degree: 602
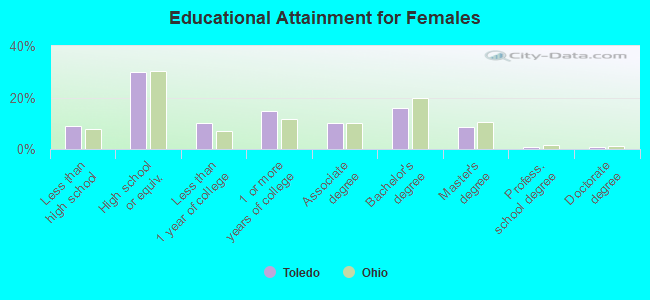
Education attainment for females 25 years and older:
- No schooling: 1,242
- Nursery to 4th grade: 181
- 5th and 6th grade: 207
- 7th and 8th grade: 467
- 9th grade: 1,437
- 10th grade: 1,303
- 11th grade: 2,271
- 12th grade, no diploma: 1,532
- High school graduate (or equivalency): 28,448
- Less than 1 year of college: 9,633
- Some college more than 1 year, no degree: 13,910
- Associate degree: 9,563
- Bachelor's degree: 15,196
- Master's degree: 7,991
- Professional school degree: 739
- Doctorate degree: 671
Housing units in structures:
- One, detached: 89,841
- One, attached: 2,342
- Two: 5,749
- 3 or 4: 4,406
- 5 to 9: 6,699
- 10 to 19: 6,901
- 20 to 49: 4,651
- 50 or more: 8,441
- Mobile homes: 3,179
Median worth of mobile homes: $9,999
Housing units lacking complete kitchen facilities in 2022: 4.4%
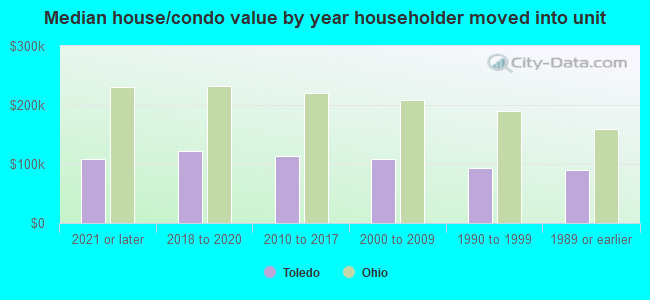
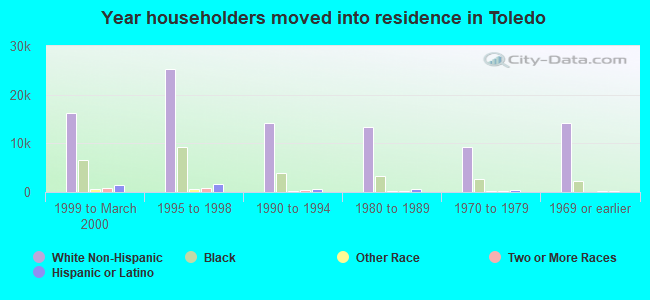
House/condo owner moved in on average 14 years ago
Renter moved in on average 3 years ago
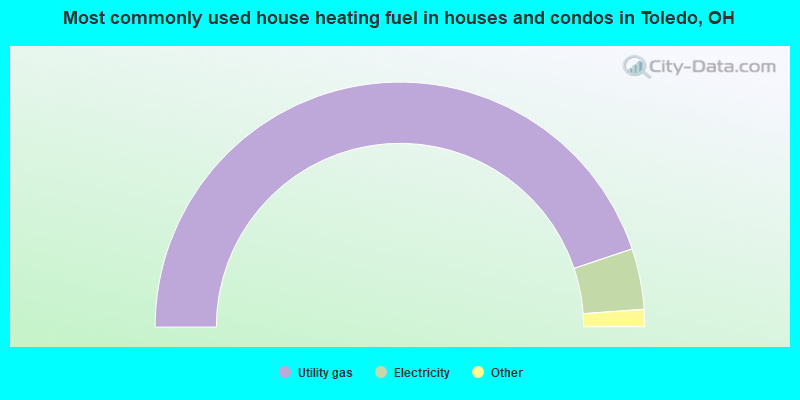
- 89.7%Utility gas
- 8.0%Electricity
- 1.4%Bottled, tank, or LP gas
- 0.3%Fuel oil, kerosene, etc.
- 0.3%No fuel used
- 0.2%Wood
- 0.1%Other fuel
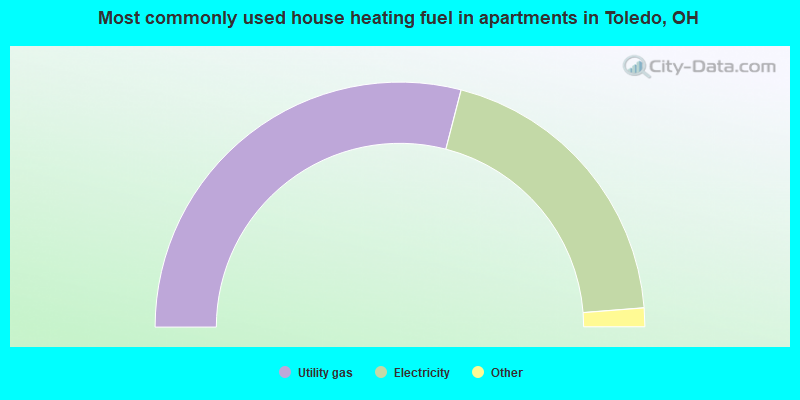
- 58.1%Utility gas
- 39.5%Electricity
- 1.3%Bottled, tank, or LP gas
- 0.6%No fuel used
- 0.4%Other fuel
- 0.1%Wood
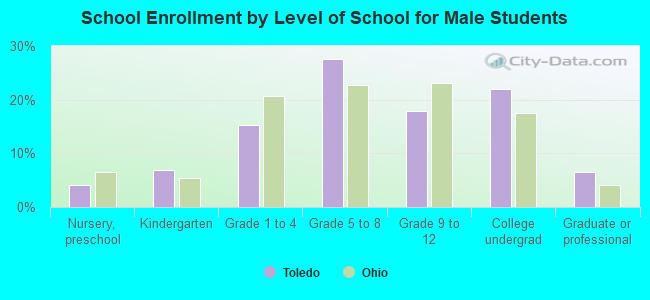
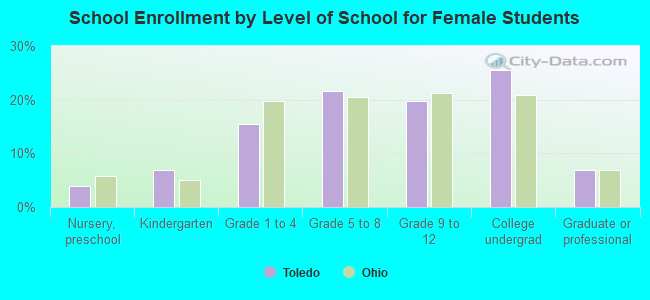
Private vs. public school enrollment:
| Here: | 22.6% |
| Ohio: | 16.0% |
| Here: | 17.6% |
| Ohio: | 13.1% |
| Here: | 5.8% |
| Ohio: | 22.3% |