Housing density: 117 houses/condos per square mile
Median price asked for vacant for-sale houses and condos in 2022 in this county: $251,692.
Median contract rent in 2022: $1,252 (lower quartile is $959, upper quartile is $1,578)
Median rent asked for vacant for-rent units in 2022: $484
Median gross rent in Tolland, CT in 2022: $1,437
Housing units in Tolland with a mortgage: 3,155 (271 second mortgage, 465 home equity loan, 16 both second mortgage and home equity loan) Houses without a mortgage: 776
In family households: 112,649 (26,574 male householders, 10,133 female householders)
29,922 spouses, 38,844 children (36,460 natural, 1,015 adopted, 1,369 stepchildren), 1,606 grandchildren, 688 brothers or sisters, 931 parents, foster children, 693 other relatives, 2,519 non-relatives
In nonfamily households: 23,925 (8,485 male householders (5,980 living alone)), 9,285 female householders (7,198 living alone)), 6,155 nonrelatives
In group quarters: 16,117 (4,028 institutionalized population)
24,754 married couples with children.
5,247 single-parent households (1,309 men, 3,938 women).
93.7% of residents of Tolland speak English at home.
1.3% of residents speak Spanish at home (82% speak English very well, 4% speak English well, 14% speak English not well).
4.2% of residents speak other Indo-European language at home (78% speak English very well, 16% speak English well, 5% speak English not well, 1% don't speak English at all).
0.5% of residents speak Asian or Pacific Island language at home (84% speak English very well, 16% speak English well).
0.3% of residents speak other language at home (100% speak English very well).
Foreign born population: 870 (5.9%)
(70.9% of them are naturalized citizens)
Year of entry for the foreign-born population in Tolland, Connecticut
361995 to March 2000
951990 to 1994
521985 to 1989
261980 to 1984
611975 to 1979
311970 to 1974
851965 to 1969
159Before 1965
First ancestries reported:
Irish: 3,022 (17.3%)
English: 2,078 (11.9%)
Italian: 1,885 (10.8%)
German: 1,807 (10.3%)
French: 1,631 (9.3%)
Polish: 1,492 (8.5%)
Other: 1,322 (7.6%)
French Canadian: 987 (5.7%)
United States: 617 (3.5%)
Scottish: 397 (2.3%)
Swedish: 348 (2.0%)
Lithuanian: 300 (1.7%)
Scotch-Irish: 220 (1.3%)
Russian: 180 (1.0%)
Czech: 174 (1.0%)
Portuguese: 150 (0.9%)
Dutch: 141 (0.8%)
Swiss: 136 (0.8%)
Slovak: 93 (0.5%)
Hungarian: 91 (0.5%)
Greek: 82 (0.5%)
Danish: 77 (0.4%)
Ukrainian: 75 (0.4%)
Welsh: 59 (0.3%)
Norwegian: 49 (0.3%)
Subsaharan African: 22 (0.1%)
West Indian: 17 (0.10%)
Arab: 7 (0.04%)
Most common places of birth for foreign-born residents (%):
Poland
Tolland:
13.6% (74)
Connecticut:
6.9% (25,507)
Canada
Tolland:
10.5% (57)
Connecticut:
5.2% (19,083)
Italy
Tolland:
7.3% (40)
Connecticut:
7.0% (26,023)
India
Tolland:
6.8% (37)
Connecticut:
4.1% (15,108)
United Kingdom
Tolland:
5.3% (29)
Connecticut:
4.4% (16,395)
Other Eastern Europe
Tolland:
5.0% (27)
Connecticut:
2.1% (7,596)
Yugoslavia
Tolland:
3.7% (20)
Connecticut:
0.5% (1,894)
Australia
Tolland:
3.5% (19)
Connecticut:
0.3% (1,032)
China, excluding Hong Kong and Taiwan
Tolland:
3.3% (18)
Connecticut:
2.5% (9,358)
Laos
Tolland:
2.9% (16)
Connecticut:
0.7% (2,692)
Portugal
Tolland:
2.8% (15)
Connecticut:
3.6% (13,234)
Colombia
Tolland:
2.8% (15)
Connecticut:
3.2% (12,009)
Ireland
Tolland:
2.6% (14)
Connecticut:
1.2% (4,344)
Korea
Tolland:
2.4% (13)
Connecticut:
1.5% (5,508)
Lebanon
Tolland:
2.4% (13)
Connecticut:
0.3% (1,286)
Ghana
Tolland:
2.4% (13)
Connecticut:
0.3% (1,058)
Chile
Tolland:
2.4% (13)
Connecticut:
0.4% (1,527)
Sweden
Tolland:
2.0% (11)
Connecticut:
0.4% (1,374)
Germany
Tolland:
2.0% (11)
Connecticut:
3.1% (11,432)
Spain
Tolland:
1.8% (10)
Connecticut:
0.4% (1,463)
Bolivia
Tolland:
1.8% (10)
Connecticut:
0.1% (327)
Place of birth for U.S.-born residents:
This state: 8,094
Other state: 4,422
Northeast: 3,385
Midwest: 359
South: 476
West: 202
71% of Tolland residents lived in the same house 5 years ago. Out of people who lived in different houses, 44% lived in this county. Out of people who lived in different counties, 71% lived in Connecticut.
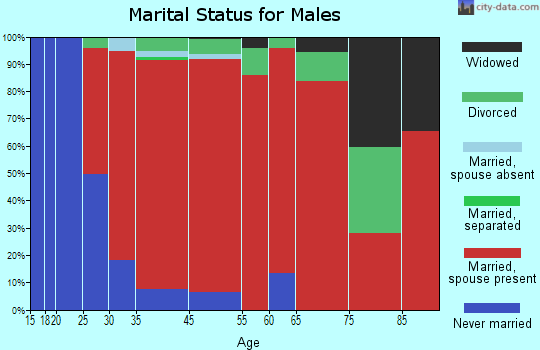
Education attainment for males 25 years and older:
No schooling: 0
Nursery to 4th grade: 0
5th and 6th grade: 5
7th and 8th grade: 98
9th grade: 33
10th grade: 45
11th grade: 59
12th grade, no diploma: 62
High school graduate (or equivalency): 1,060
Less than 1 year of college: 233
Some college more than 1 year, no degree: 456
Associate degree: 291
Bachelor's degree: 1,145
Master's degree: 548
Professional school degree: 83
Doctorate degree: 112
Education attainment for females 25 years and older:
No schooling: 12
Nursery to 4th grade: 0
5th and 6th grade: 0
7th and 8th grade: 98
9th grade: 7
10th grade: 49
11th grade: 30
12th grade, no diploma: 91
High school graduate (or equivalency): 1,108
Less than 1 year of college: 256
Some college more than 1 year, no degree: 477
Associate degree: 545
Bachelor's degree: 1,205
Master's degree: 506
Professional school degree: 77
Doctorate degree: 35
Housing units in structures:
One, detached: 4,349
One, attached: 74
Two: 46
3 or 4: 67
5 to 9: 89
10 to 19: 40
Housing units lacking complete kitchen facilities: 0.5%