Toquerville, UT (Utah) Houses and Residents
| Toquerville: | $527,894 |
| Utah: | $499,500 |
Mean price in 2022:
Detached houses: $453,498
Here: $453,498 State: $607,750
Total population: 1,448 (Urban population: 77 (all inside urban clusters), Rural population: 836 (13 farm, 823 nonfarm))
Houses: 710 (628 occupied: 599 owner occupied, 45 renter occupied)
| % of renters here: | 7% |
| State: | 29% |
Housing density: 50 houses/condos per square mile
Median price asked for vacant for-sale houses and condos in 2022: $12,553,991.
Median contract rent in 2022: $1,358 (lower quartile is $904, upper quartile is over $2,000)
Median rent asked for vacant for-rent units in 2022: $1,621
Median gross rent in Toquerville, UT in 2022: $1,598
Housing units in Toquerville with a mortgage: 404 (74 second mortgage, 0 home equity loan, 78 both second mortgage and home equity loan)
Houses without a mortgage: 8
Median household income for houses/condos with a mortgage: $113,419
Median household income for apartments without a mortgage: $66,166
Median monthly housing costs: $1,440
Compare current foreclosures near Toquerville, UT:
| Photo | Address | Area | Beds / Baths | Price | Details |
|---|---|---|---|---|---|

|
#1
W 2440 S
Hurricane, UT 84737
|
2,513 sq. feet
|
3 baths 5 beds |
show details | |

|
#2
E Fourteen Fairway Dr
Washington, UT 84780
|
1,284 sq. feet
|
2 baths 2 beds |
show details | |

|
#3
W 310 N
Hurricane, UT 84737
|
1,396 sq. feet
|
2 baths 3 beds |
show details | |

|
#4
W 200 N
La Verkin, UT 84745
|
1,266 sq. feet
|
2 baths 3 beds |
show details | |

|
#5
N Ocotillo Dr
Washington, UT 84780
|
2,120 sq. feet
|
3 baths 5 beds |
show details | |

|
#6
Jeffs Dr
Washington, UT 84780
|
1,219 sq. feet
|
2 baths 3 beds |
show details | |

|
#7
W 40 N
Hurricane, UT 84737
|
1,289 sq. feet
|
2 baths 3 beds |
show details | |

|
#8
W Blue Mountain Rd
Washington, UT 84780
|
4,177 sq. feet
|
3 baths 4 beds |
show details | |

|
#9
E Sweetwater Springs Dr
Washington, UT 84780
|
1,442 sq. feet
|
2 baths 3 beds |
show details | |

|
#10
Quail Ridge Dr
Washington, UT 84780
|
1,354 sq. feet
|
2 baths 3 beds |
show details |
| Photo | Address | Area | Beds / Baths | Price | Details |
|---|---|---|---|---|---|

|
#11
E Telegraph St Lot 64
Washington, UT 84780
|
408 sq. feet
|
1 baths 1 beds |
show details | |

|
#12
N 560 W
La Verkin, UT 84745
|
1,735 sq. feet
|
2 baths 4 beds |
show details | |

|
#13
W 500 N
La Verkin, UT 84745
|
4,185 sq. feet
|
5 baths 5 beds |
show details | |

|
#14
E 700 N
Saint George, UT 84790
|
1,424 sq. feet
|
2 baths 3 beds |
show details | |

|
#15
Alamosa Dr
Washington, UT 84780
|
1,749 sq. feet
|
3 baths 5 beds |
show details | |

|
#16
W 175 N
Hurricane, UT 84737
|
1,357 sq. feet
|
2 baths 3 beds |
show details | |

|
#17
S White Sands Dr
Washington, UT 84780
|
2,330 sq. feet
|
2 baths 3 beds |
show details | |

|
#18
W Washington Palms Way
Washington, UT 84780
|
1,733 sq. feet
|
2 baths 3 beds |
show details | |

|
#19
N 2480 W
Hurricane, UT 84737
|
1,251 sq. feet
|
2 baths 3 beds |
show details | |

|
#20
Bluff View Dr Unit 96
Washington, UT 84780
|
1,868 sq. feet
|
3 baths 3 beds |
show details |
| Photo | Address | Area | Beds / Baths | Price | Details |
|---|---|---|---|---|---|

|
#21
N 2270 East Cir
Saint George, UT 84790
|
1,139 sq. feet
|
2 baths 3 beds |
show details | |

|
#22
N 120 E
Hurricane, UT 84737
|
1,542 sq. feet
|
2 baths 3 beds |
show details | |

|
#23
N Tortoise Rock Dr, Unit 13
Washington, UT 84780
|
- sq. feet
|
- baths - beds |
show details | |

|
#24
N 1100 E Unit 171
Washington, UT 84780
|
- sq. feet
|
- baths - beds |
show details | |

|
#25
N 195 W
La Verkin, UT 84745
|
- sq. feet
|
- baths - beds |
show details | |

|
#26
Playa Della Rosita Apt 3
Washington, UT 84780
|
- sq. feet
|
- baths - beds |
show details | |

|
#27
N Viatranquila
Washington, UT 84780
|
- sq. feet
|
- baths - beds |
show details | |

|
#28
Buena Vista Blvd Unit 120
Washington, UT 84780
|
- sq. feet
|
- baths - beds |
show details | |

|
#29
N Creek Ridge Dr
Washington, UT 84780
|
- sq. feet
|
- baths - beds |
show details | |

|
#30
N Juniper Dr
Washington, UT 84780
|
- sq. feet
|
- baths - beds |
show details |
| Photo | Address | Area | Beds / Baths | Price | Details |
|---|---|---|---|---|---|

|
#31
W 200 S, Unit 111
Washington, UT 84780
|
- sq. feet
|
- baths - beds |
show details | |

|
#32
W 200 S, Unit 123
Washington, UT 84780
|
- sq. feet
|
- baths - beds |
show details | |

|
#33
E 450 N, Apt 317
Saint George, UT 84790
|
- sq. feet
|
- baths - beds |
show details | |

|
#34
E Riverside Dr Unit 162
Saint George, UT 84790
|
- sq. feet
|
- baths - beds |
show details | |

|
#35
Colorado Dr
Saint George, UT 84770
|
- sq. feet
|
- baths - beds |
show details | |

|
#36
S Waterfront Dr
Saint George, UT 84790
|
- sq. feet
|
- baths - beds |
show details | |

|
#37
E Bulloch St, Unit 3
Washington, UT 84780
|
- sq. feet
|
- baths - beds |
show details | |

|
#38
N Verde St
Washington, UT 84780
|
- sq. feet
|
- baths - beds |
show details | |

|
#39
E Bulloch St, Unit 23
Washington, UT 84780
|
- sq. feet
|
- baths - beds |
show details | |

|
#40
W 175 N
Hurricane, UT 84737
|
- sq. feet
|
- baths - beds |
show details |
| Photo | Address | Area | Beds / Baths | Price | Details |
|---|---|---|---|---|---|

|
#41
N 300 W
Hurricane, UT 84737
|
- sq. feet
|
- baths - beds |
show details | |

|
#42
W 300 N
Hurricane, UT 84737
|
- sq. feet
|
- baths - beds |
show details | |

|
#43
E 200 N, Apt 12
Hurricane, UT 84737
|
- sq. feet
|
- baths - beds |
show details | |

|
#44
N 2480 W
Hurricane, UT 84737
|
- sq. feet
|
- baths - beds |
show details | |

|
#45
S 460 W
Hurricane, UT 84737
|
- sq. feet
|
- baths - beds |
show details | |

|
#46
N 2585 W
Hurricane, UT 84737
|
- sq. feet
|
- baths - beds |
show details | |

|
#47
W Spilsbury Ct
Hurricane, UT 84737
|
- sq. feet
|
- baths - beds |
show details | |

|
#48
S 1480 W
Hurricane, UT 84737
|
- sq. feet
|
- baths - beds |
show details | |

|
#49
W Coronado Dr
Hurricane, UT 84737
|
- sq. feet
|
- baths - beds |
show details | |

|
Check over 1 million property listings on Foreclosure.com!
|
browse all offers | |||

Latest news about housing in Toquerville, UT collected exclusively by city-data.com from local newspapers, TV, and radio stations

 | Reputable Real Estate Agent St. George area (10 replies) |
| Population of at George now? Washington county? (8 replies) |
| St. George/Cedar City vs. everywhere else (7 replies) |
| Seeking a more rural area than St. George (5 replies) |
| visiting st george / cedar in a few weeks (13 replies) |
| Interested in the St.George, Wash. Cty. area (29 replies) |

Median year apartment built: 1988
Household type by relationship:
Households: 2,193- Male householders: 354 (58 living alone), Female householders: 266 (61 living alone)
480 spouses (480 opposite-sex spouses), 7 unmarried partners, (7 opposite-sex unmarried partners), 756 children (666 natural, 85 adopted, 4 stepchildren), 80 grandchildren, 12 brothers or sisters, 16 parents, 0 foster children, 95 other relatives, 93 non-relatives
- In group quarters: 28
Size of family households: 178 2-persons, 89 3-persons, 82 4-persons, 64 5-persons, 62 6-persons, 30 7-or-more-persons.
Size of nonfamily households: 121 1-person, 15 2-persons.
490 married couples with children.
16 single-parent households (0 men, 16 women).
93.4% of residents of Toquerville speak English at home.
4.0% of residents speak Spanish at home (96% speak English very well, 4% speak English well).
1.0% of residents speak other Indo-European language at home (100% speak English very well).
1.8% of residents speak Asian or Pacific Island language at home (100% speak English very well).
Foreign born population: 126 (5.7%)
(74.6% of them are naturalized citizens)
| Here: | 7.3 |
| State: | 7.6 |
| Here: | 5.4 |
| State: | 4.3 |

- Bedrooms in owner-occupied houses and condos in Toquerville, Utah
- 0no bedroom
- 01 bedroom
- 852 bedrooms
- 2593 bedrooms
- 1264 bedrooms
- 1305+ bedrooms

- Bedrooms in renter-occupied apartments in Toquerville, Utah
- 0no bedroom
- 11 bedroom
- 02 bedrooms
- 353 bedrooms
- 104 bedrooms
- 05+ bedrooms

- Cars and other vehicles available in Toquerville in owner-occupied houses/condos
- 0no vehicle
- 681 vehicle
- 2102 vehicles
- 1683 vehicles
- 834 vehicles
- 715+ vehicles

- Cars and other vehicles available in Toquerville in renter-occupied apartments
- 0no vehicle
- 221 vehicle
- 182 vehicles
- 63 vehicles
- 04 vehicles
- 05+ vehicles

- Rooms in owner-occupied houses in Toquerville, Utah
- 01 room
- 02 rooms
- 23 rooms
- 254 rooms
- 775 rooms
- 716 rooms
- 1707 rooms
- 958 rooms
- 1599+ rooms

- Rooms in renter-occupied apartments in Toquerville, Utah
- 01 room
- 02 rooms
- 03 rooms
- 04 rooms
- 345 rooms
- 26 rooms
- 47 rooms
- 68 rooms
- 09+ rooms


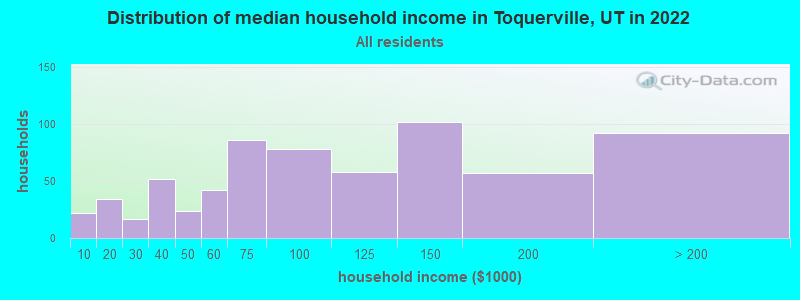
Toquerville, UT household income distribution

- 22Less than $10,000
- 34$10,000 to $19,999
- 17$20,000 to $29,999
- 52$30,000 to $39,999
- 24$40,000 to $49,999
- 42$50,000 to $59,999
- 86$60,000 to $74,999
- 78$75,000 to $99,999
- 58$100,000 to $124,999
- 102$125,000 to $149,999
- 57$150,000 to $199,999
- 92$200,000 or more
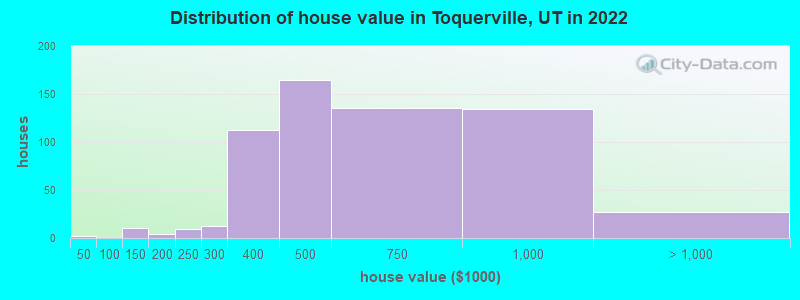
Home value of owner - occupied houses in 2022 in Toquerville, UT
-
- 2$30,000 to $34,999
- 10$125,000 to $149,999
- 2$150,000 to $174,999
- 2$175,000 to $199,999
- 8$200,000 to $249,999
- 11$250,000 to $299,999
- 112$300,000 to $399,999
- 164$400,000 to $499,999
- 135$500,000 to $749,999
- 134$750,000 to $999,999
- 26$1,000,000 to $1,499,999
Rent paid by renters in 2022 in Toquerville, UT
-
- 6$700 to $749
- 1$900 to $999
- 5$1,250 to $1,499
- 7$2,000 to $2,499
- 24No cash rent


Percentage of workers working in this county: 95.4%
Number of people working at home: 204 (20.9% of all workers)
Travel time to work (commute)
- Less than 5 minutes: 6
- 5 to 9 minutes: 33
- 10 to 14 minutes: 88
- 15 to 19 minutes: 150
- 20 to 24 minutes: 66
- 25 to 29 minutes: 97
- 30 to 34 minutes: 203
- 35 to 39 minutes: 44
- 40 to 44 minutes: 41
- 45 to 59 minutes: 51
- 60 to 89 minutes: 29
- 90 or more minutes: 0
Means of transportation to work:
- Drove a car alone: 279 (76.0%)
- Carpooled: 56 (15.3%)
- Subway or elevated: 2 (0.5%)
- Walked: 2 (0.5%)
- Other means: 4 (1.1%)
- Worked at home: 24 (6.5%)

- Unemployment by race in 2022
- Unemployment rate for White non-Hispanic residents
- 2.3%Males
- 1.6%Females

- Year of entry for the foreign-born population in Toquerville, Utah
- 52010 or later
- 32000 to 2009
- 221990 to 1999
- 01980 to 1989
- 21970 to 1979
- 14Before 1970

First ancestries reported:
- English: 384 (43.4%)
- German: 73 (8.3%)
- Irish: 54 (6.1%)
- American: 49 (5.5%)
- Swedish: 24 (2.7%)
- Scottish: 23 (2.6%)
- European: 18 (2.0%)
- Danish: 10 (1.1%)
- Swiss: 10 (1.1%)
- Portuguese: 7 (0.8%)
- Scandinavian: 7 (0.8%)
- Canadian: 3 (0.3%)
- Norwegian: 3 (0.3%)
- Scotch-Irish: 3 (0.3%)
- Welsh: 3 (0.3%)
- Italian: 2 (0.2%)
- Slovak: 2 (0.2%)
- Polish: 1 (0.1%)
Most common places of birth for foreign-born residents (%):
| Toquerville: | 42.2% (46) |
| Utah: | 36.1% (99,740) |
| Toquerville: | 18.3% (20) |
| Utah: | 0.4% (996) |
| Toquerville: | 14.7% (16) |
| Utah: | 3.0% (8,341) |
| Toquerville: | 12.8% (14) |
| Utah: | 2.7% (7,472) |
| Toquerville: | 7.3% (8) |
| Utah: | 2.3% (6,468) |
| Toquerville: | 1.8% (2) |
| Utah: | 0.1% (373) |
Place of birth for U.S.-born residents:
- This state: 1,200
- Other state: 820
- Northeast: 43
- Midwest: 84
- South: 113
- West: 582
88.6% of Toquerville residents lived in the same house 1 years ago.
Out of people who lived in different houses, 15.7% lived in this county.
Out of people who lived in different counties, 68.5% lived in Utah.
| Toquerville: | 88.6% |
| State average: | 85.7% |
Education attainment for males 25 years and older:
- No schooling: 0
- Nursery to 4th grade: 0
- 5th and 6th grade: 0
- 7th and 8th grade: 0
- 9th grade: 8
- 10th grade: 0
- 11th grade: 0
- 12th grade, no diploma: 6
- High school graduate (or equivalency): 157
- Less than 1 year of college: 19
- Some college more than 1 year, no degree: 124
- Associate degree: 74
- Bachelor's degree: 201
- Master's degree: 37
- Professional school degree: 11
- Doctorate degree: 3

Education attainment for females 25 years and older:
- No schooling: 0
- Nursery to 4th grade: 0
- 5th and 6th grade: 0
- 7th and 8th grade: 0
- 9th grade: 1
- 10th grade: 0
- 11th grade: 6
- 12th grade, no diploma: 22
- High school graduate (or equivalency): 139
- Less than 1 year of college: 68
- Some college more than 1 year, no degree: 145
- Associate degree: 80
- Bachelor's degree: 111
- Master's degree: 65
- Professional school degree: 18
- Doctorate degree: 9


Housing units in structures:
- One, detached: 684
- One, attached: 9
- Two: 3
- Mobile homes: 13
House/condo owner moved in on average 9 years ago
Renter moved in on average 3 years ago

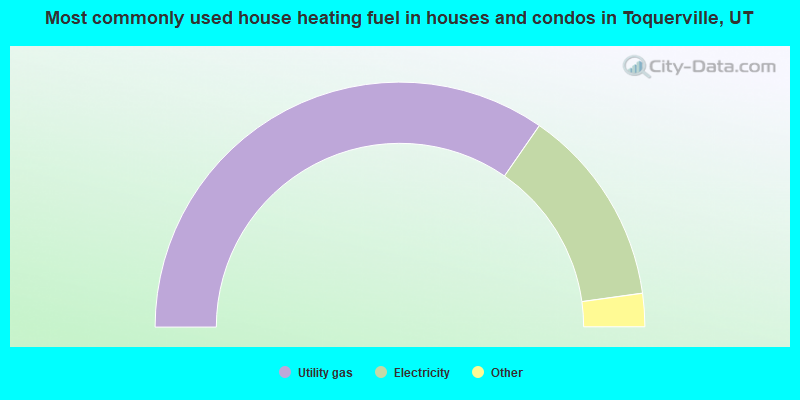
- 69.5%Utility gas
- 26.4%Electricity
- 2.4%Wood
- 1.3%Solar energy
- 0.4%Bottled, tank, or LP gas
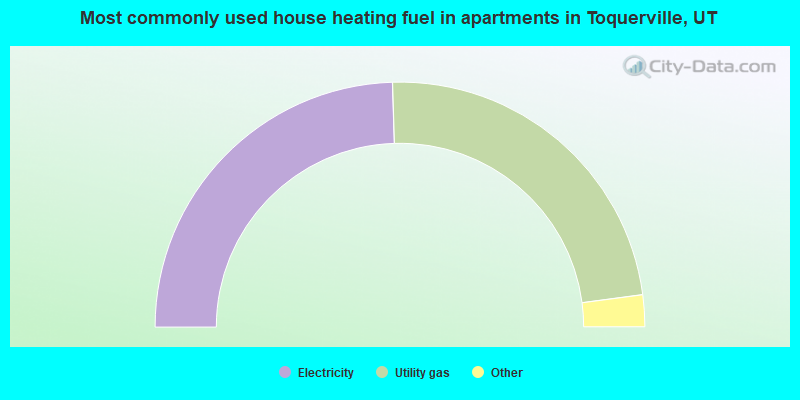
- 51.2%Electricity
- 48.8%Utility gas
Private vs. public school enrollment:
| Here: | 17.3% |
| Utah: | 7.2% |
| Here: | 6.4% |
| Utah: | 5.3% |
| Here: | 14.5% |
| Utah: | 26.7% |


