Tuckahoe, VA (Virginia) Houses and Residents
Estimated median house or condo value in 2022: $440,959 (it was $150,400 in 2000 )
Tuckahoe:
$440,959Virginia:
$365,700
Lower value quartile - upper value quartile: $327,893 - $713,018Mean price in 2022: Detached houses: $579,626 Here:
$579,626State:
$472,865
Townhouses or other attached units: $324,852 Here:
$324,852State:
$457,437
In 2-unit structures: $455,588 Here:
$455,588State:
$396,289
In 3-to-4-unit structures: $315,764 Here:
$315,764State:
$252,346
In 5-or-more-unit structures: $297,994 Here:
$297,994State:
$382,551
Total population: 44,990 (Urban population: 42,922, Rural population: 275 (all nonfarm) )
Houses: 20,904 (19,688 occupied: 12,443 owner occupied, 7,262 renter occupied )
% of renters here:
37%State:
33%
Housing density: 1,016 houses/condos per square mile
Median price asked for vacant for-sale houses and condos in 2022: $278,224.
Median contract rent in 2022: $1,247 (lower quartile is $945, upper quartile is $1,673)
Median rent asked for vacant for-rent units in 2022: $1,528
Median gross rent in Tuckahoe, VA in 2022: $1,389
Housing units in Tuckahoe with a mortgage: 7,889 (1,184 second mortgage, 12 home equity loan, 999 both second mortgage and home equity loan )Houses without a mortgage: 135
Median household income for houses/condos with a mortgage: $130,474
Median household income for apartments without a mortgage: $107,170
Median monthly housing costs: $1,394
Data:
Median house or condo value ($)
Median house or condo value ($ change since 2000)
Median house or condo value ($) - White
Median house or condo value ($) - Black or African American
Median house or condo value ($) - Asian
Median house or condo value ($) - Hispanic or Latino
Median house or condo value ($) - American Indian and Alaska Native
Median house or condo value ($) - Multirace
Median house or condo value ($) - Other Race
Median price asked for mobile homes ($)
Household density (households per square mile)
Mean house or condo value by units in structure - 1, detached ($)
Mean house or condo value by units in structure - 1, attached ($)
Mean house or condo value by units in structure - 2 ($)
Mean house or condo value by units in structure by units in structure - 3 or 4 ($)
Mean house or condo value by units in structure - 5 or more ($)
Mean house or condo value by units in structure - Boat, RV, van, etc. ($)
Mean house or condo value by units in structure - Mobile home ($)
Median contract rent ($)
Median contract rent - Lower quartile ($)
Median contract rent - Upper quartile ($)
Median gross rent ($)
Urban houses (%)
Rural houses (%)
Houses occupied (%)
Houses occupied (% change since 2000)
Houses owner occupied (%)
Houses owner occupied (% change since 2000)
Houses renter occupied (%)
Houses renter occupied (% change since 2000)
Vacant housing units - For rent (%)
Vacant housing units - For rent (% change since 2000)
Vacant housing units - For sale only (%)
Vacant housing units - For sale only (% change since 2000)
Vacant housing units - Rented or sold, not occupied (%)
Vacant housing units - Rented or sold, not occupied (% change since 2000)
Vacant housing units - For seasonal, recreational, or occasional use (%)
Vacant housing units - For seasonal, recreational, or occasional use (% change since 2000)
Vacant housing units - For migrant workers (%)
Vacant housing units - For migrant workers (% change since 2000)
Vacant housing units - Other vacant (%)
Vacant housing units - Other vacant (% change since 2000)
Median monthly housing costs ($)
Median household income for houses/condos with a mortgage ($)
Median household income for houses/condos without a mortgage ($)
Median household income ($)
Median household income ($) - White
Median household income ($) - Black or African American
Median household income ($) - Asian
Median household income ($) - Hispanic or Latino
Median household income ($) - American Indian and Alaska Native
Median household income ($) - Multirace
Median household income ($) - Other Race
Mortgage status - with mortgage (%)
Mortgage status - with second mortgage (%)
Mortgage status - with home equity loan (%)
Mortgage status - with both second mortgage and home equity loan (%)
Mortgage status - without a mortgage (%)
Median year house/condo built
Median year apartment built
Household type by relationship - Male householder living alone (%)
Household type by relationship - Male householder not living alone (%)
Household type by relationship - Female householder living alone (%)
Household type by relationship - Female householder not living alone (%)
Household type by relationship - Opposite-Sex spouse (%)
Household type by relationship - Same-Sex spouse (%)
Household type by relationship - Opposite-Sex unmarried partner (%)
Household type by relationship - Same-Sex unmarried partner (%)
Household type by relationship - In group quarters (%)
Size of family households - 2-person household (%)
Size of family households - 3-person household (%)
Size of family households - 4-person household (%)
Size of family households - 5-person household (%)
Size of family households - 6-person household (%)
Size of family households - 7-or-more-person household (%)
Size of nonfamily households - 1-person household (%)
Size of nonfamily households - 2-person household (%)
Size of nonfamily households - 3-person household (%)
Size of nonfamily households - 4-person household (%)
Size of nonfamily households - 5-person household (%)
Size of nonfamily households - 6-person household (%)
Size of nonfamily households - 7-or-moreperson household (%)
Year house built - Built 2010 or later (%)
Year house built - Built 2000 to 2009 (%)
Year house built - Built 1990 to 1999 (%)
Year house built - Built 1980 to 1989 (%)
Year house built - Built 1970 to 1979 (%)
Year house built - Built 1960 to 1969 (%)
Year house built - Built 1950 to 1959 (%)
Year house built - Built 1940 to 1949 (%)
Year house built - Built 1939 or earlier (%)
Median number of rooms in houses and condos
Median number of rooms in apartments
Median number of bedrooms in owner occupied houses
Mean number of bedrooms in owner occupied houses
Median number of bedrooms in renter occupied houses
Mean number of bedrooms in renter occupied houses
Median number of vehichles in owner occupied houses
Mean number of vehichles in owner occupied houses
Median number of vehichles in renter occupied houses
Mean number of vehichles in renter occupied houses
Rooms in owner-occupied houses - 1 room (%)
Rooms in owner-occupied houses - 2 rooms (%)
Rooms in owner-occupied houses - 3 rooms (%)
Rooms in owner-occupied houses - 4 rooms (%)
Rooms in owner-occupied houses - 5 rooms (%)
Rooms in owner-occupied houses - 6 rooms (%)
Rooms in owner-occupied houses - 7 rooms (%)
Rooms in owner-occupied houses - 8 rooms (%)
Rooms in owner-occupied houses - 9+ rooms (%)
Rooms in renter-occupied houses - 1 room (%)
Rooms in renter-occupied houses - 2 rooms (%)
Rooms in renter-occupied houses - 3 rooms (%)
Rooms in renter-occupied houses - 4 rooms (%)
Rooms in renter-occupied houses - 5 rooms (%)
Rooms in renter-occupied houses - 6 rooms (%)
Rooms in renter-occupied houses - 7 rooms (%)
Rooms in renter-occupied houses - 8 rooms (%)
Rooms in renter-occupied houses - 9+ rooms (%)
Bedrooms in owner-occupied houses - no bedrooms (%)
Bedrooms in owner-occupied houses - 1 bedroom (%)
Bedrooms in owner-occupied houses - 2 bedrooms (%)
Bedrooms in owner-occupied houses - 3 bedrooms (%)
Bedrooms in owner-occupied houses - 4 bedrooms (%)
Bedrooms in owner-occupied houses - 5+ bedrooms (%)
Bedrooms in renter-occupied houses - no bedrooms (%)
Bedrooms in renter-occupied houses - 1 bedroom (%)
Bedrooms in renter-occupied houses - 2 bedrooms (%)
Bedrooms in renter-occupied houses - 3 bedrooms (%)
Bedrooms in renter-occupied houses - 4 bedrooms (%)
Bedrooms in renter-occupied houses - 5+ bedrooms (%)
Vehicles available in owner-occupied houses - no vehicle available (%)
Vehicles available in owner-occupied houses - 1 vehicle available(%)
Vehicles available in owner-occupied houses - 2 Vehicles available (%)
Vehicles available in owner-occupied houses - 3 Vehicles available (%)
Vehicles available in owner-occupied houses - 4 Vehicles available (%)
Vehicles available in owner-occupied houses - 5+ Vehicles available (%)
Vehicles available in renter-occupied houses - no vehicle available (%)
Vehicles available in renter-occupied houses - 1 vehicle available (%)
Vehicles available in renter-occupied houses - 2 Vehicles available (%)
Vehicles available in renter-occupied houses - 3 Vehicles available (%)
Vehicles available in renter-occupied houses - 4 Vehicles available (%)
Vehicles available in renter-occupied houses - 5+ Vehicles available (%)
Housing units in structures - 1, detached (%)
Housing units in structures - 1, attached (%)
Housing units in structures - 2 (%)
Housing units in structures - 3 or 4 (%)
Housing units in structures - 5 to 9 (%)
Housing units in structures - 10 to 19 (%)
Housing units in structures - 20 to 49 (%)
Housing units in structures - 50 or more (%)
Housing units in structures - Mobile home (%)
Housing units in structures - Boat, RV, van, etc. (%)
Housing units in structures - Owners - 1, detached (%)
Housing units in structures - Owners - 1, attached (%)
Housing units in structures - Owners - 2 (%)
Housing units in structures - Owners - 3 or 4 (%)
Housing units in structures - Owners - 5 to 9 (%)
Housing units in structures - Owners - 10 to 19 (%)
Housing units in structures - Owners - 20 to 49 (%)
Housing units in structures - Owners - 50 or more (%)
Housing units in structures - Owners - Mobile home (%)
Housing units in structures - Owners - Boat, RV, van, etc. (%)
Housing units in structures - Renters - 1, detached (%)
Housing units in structures - Renters - 1, attached (%)
Housing units in structures - Renters - 2 (%)
Housing units in structures - Renters - 3 or 4 (%)
Housing units in structures - Renters - 5 to 9 (%)
Housing units in structures - Renters - 10 to 19 (%)
Housing units in structures - Renters - 20 to 49 (%)
Housing units in structures - Renters - 50 or more (%)
Housing units in structures - Renters - Mobile home (%)
Housing units in structures - Renters - Boat, RV, van, etc. (%)
House/condo owner moved in on average (years ago)
Renter moved in on average (years ago)
Year householder moved into unit - Moved in 1999 to March 2000 (%)
Year householder moved into unit - Moved in 1999 to March 2000 (%) - White
Year householder moved into unit - Moved in 1999 to March 2000 (%) - Black or African American
Year householder moved into unit - Moved in 1999 to March 2000 (%) - Asian
Year householder moved into unit - Moved in 1999 to March 2000 (%) - Hispanic or Latino
Year householder moved into unit - Moved in 1999 to March 2000 (%) - American Indian and Alaska Native
Year householder moved into unit - Moved in 1999 to March 2000 (%) - Multirace
Year householder moved into unit - Moved in 1999 to March 2000 (%) - Other Race
Year householder moved into unit - Moved in 1995 to 1998 (%)
Year householder moved into unit - Moved in 1995 to 1998 (%) - White
Year householder moved into unit - Moved in 1995 to 1998 (%) - Black or African American
Year householder moved into unit - Moved in 1995 to 1998 (%) - Asian
Year householder moved into unit - Moved in 1995 to 1998 (%) - Hispanic or Latino
Year householder moved into unit - Moved in 1995 to 1998 (%) - American Indian and Alaska Native
Year householder moved into unit - Moved in 1995 to 1998 (%) - Multirace
Year householder moved into unit - Moved in 1995 to 1998 (%) - Other Race
Year householder moved into unit - Moved in 1990 to 1994 (%)
Year householder moved into unit - Moved in 1990 to 1994 (%) - White
Year householder moved into unit - Moved in 1990 to 1994 (%) - Black or African American
Year householder moved into unit - Moved in 1990 to 1994 (%) - Asian
Year householder moved into unit - Moved in 1990 to 1994 (%) - Hispanic or Latino
Year householder moved into unit - Moved in 1990 to 1994 (%) - American Indian and Alaska Native
Year householder moved into unit - Moved in 1990 to 1994 (%) - Multirace
Year householder moved into unit - Moved in 1990 to 1994 (%) - Other Race
Year householder moved into unit - Moved in 1980 to 1989 (%)
Year householder moved into unit - Moved in 1980 to 1989 (%) - White
Year householder moved into unit - Moved in 1980 to 1989 (%) - Black or African American
Year householder moved into unit - Moved in 1980 to 1989 (%) - Asian
Year householder moved into unit - Moved in 1980 to 1989 (%) - Hispanic or Latino
Year householder moved into unit - Moved in 1980 to 1989 (%) - American Indian and Alaska Native
Year householder moved into unit - Moved in 1980 to 1989 (%) - Multirace
Year householder moved into unit - Moved in 1980 to 1989 (%) - Other Race
Year householder moved into unit - Moved in 1970 to 1979 (%)
Year householder moved into unit - Moved in 1970 to 1979 (%) - White
Year householder moved into unit - Moved in 1970 to 1979 (%) - Black or African American
Year householder moved into unit - Moved in 1970 to 1979 (%) - Asian
Year householder moved into unit - Moved in 1970 to 1979 (%) - Hispanic or Latino
Year householder moved into unit - Moved in 1970 to 1979 (%) - American Indian and Alaska Native
Year householder moved into unit - Moved in 1970 to 1979 (%) - Multirace
Year householder moved into unit - Moved in 1970 to 1979 (%) - Other Race
Year householder moved into unit - Moved in 1969 or earlier (%)
Year householder moved into unit - Moved in 1969 or earlier (%) - White
Year householder moved into unit - Moved in 1969 or earlier (%) - Black or African American
Year householder moved into unit - Moved in 1969 or earlier (%) - Asian
Year householder moved into unit - Moved in 1969 or earlier (%) - Hispanic or Latino
Year householder moved into unit - Moved in 1969 or earlier (%) - American Indian and Alaska Native
Year householder moved into unit - Moved in 1969 or earlier (%) - Multirace
Year householder moved into unit - Moved in 1969 or earlier (%) - Other Race
Housing units lacking complete plumbing facilities (%)
Housing units lacking complete kitchen facilities (%)
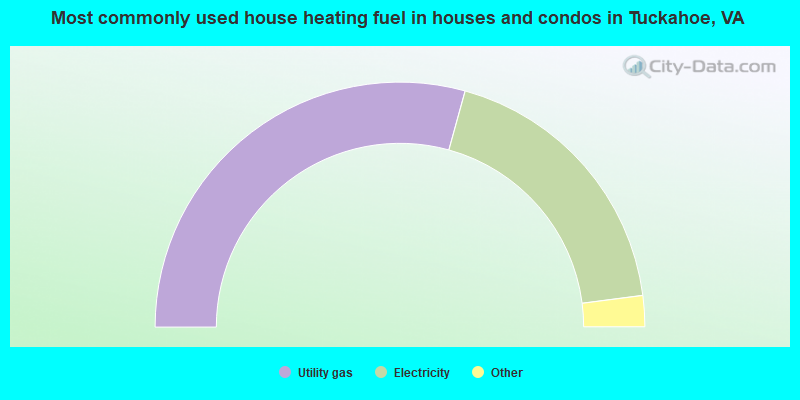
House heating fuel used in houses and condos - Utility gas (%)
House heating fuel used in houses and condos - Bottled, tank, or LP gas (%)
House heating fuel used in houses and condos - Electricity (%)
House heating fuel used in houses and condos - Fuel oil, kerosene, etc. (%)
House heating fuel used in houses and condos - Coal or coke (%)
House heating fuel used in houses and condos - Wood (%)
House heating fuel used in houses and condos - Solar energy (%)
House heating fuel used in houses and condos - Other fuel (%)
House heating fuel used in houses and condos - No fuel used (%)
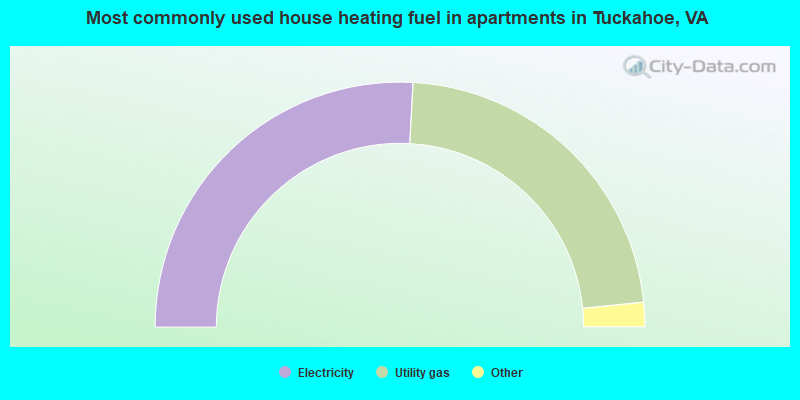
House heating fuel used in apartments - Utility gas (%)
House heating fuel used in apartments - Bottled, tank, or LP gas (%)
House heating fuel used in apartments - Electricity (%)
House heating fuel used in apartments - Fuel oil, kerosene, etc. (%)
House heating fuel used in apartments - Coal or coke (%)
House heating fuel used in apartments - Wood (%)
House heating fuel used in apartments - Solar energy (%)
House heating fuel used in apartments - Other fuel (%)
House heating fuel used in apartments - No fuel used (%)
Latest news about housing in Tuckahoe, VA collected exclusively by city-data.com from local newspapers, TV, and radio stations
Median year house/condo built: 1968Median year apartment built: 1977Household type by relationship:
Households: 48,170
Male householders: 8,868 (2,004 living alone ), Female householders: 10,416 (3,815 living alone )9,196 spouses (9,097 opposite-sex spouses ), 1,405 unmarried partners , (1,380 opposite-sex unmarried partners ), 15,319 children (14,581 natural , 483 adopted , 254 stepchildren ), 348 grandchildren , 370 brothers or sisters , 360 parents , 0 foster children , 342 other relatives , 1,160 non-relatives In group quarters: 379
Size of family households: 5,502 2-persons , 3,114 3-persons , 2,326 4-persons , 1,006 5-persons , 358 6-persons , 47 7-or-more-persons .
Size of nonfamily households: 6,003 1-person , 1,071 2-persons , 198 3-persons , 24 4-persons .
8,541 married couples with children. single-parent households (1,025 men , 1,319 women ).
85.4% of residents of Tuckahoe speak English at home. of residents speak Spanish at home (66% speak English very well , 16% speak English well , 16% speak English not well , 2% don't speak English at all ).of residents speak other Indo-European language at home (43% speak English very well , 28% speak English well , 26% speak English not well , 4% don't speak English at all ).of residents speak Asian or Pacific Island language at home (47% speak English very well , 11% speak English well , 11% speak English not well , 31% don't speak English at all ).of residents speak other language at home (66% speak English very well , 14% speak English well , 20% speak English not well ).
Foreign born population: 6,065 (12.6%)of them are naturalized citizens )
Median number of rooms in houses and condos:
Median number of rooms in apartments
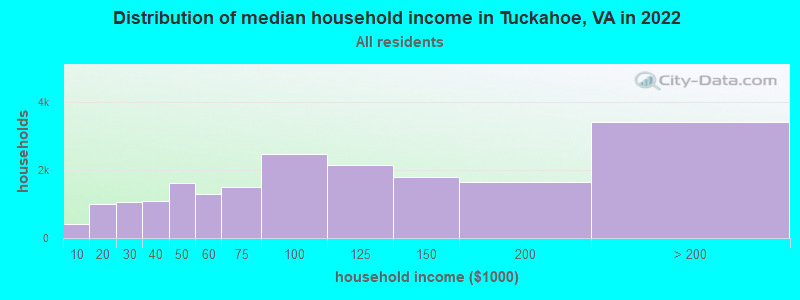
Tuckahoe, VA household income distribution 419 Less than $10,000986 $10,000 to $19,9991,049 $20,000 to $29,9991,095 $30,000 to $39,9991,617 $40,000 to $49,9991,290 $50,000 to $59,9991,491 $60,000 to $74,9992,475 $75,000 to $99,9992,129 $100,000 to $124,9991,781 $125,000 to $149,9991,658 $150,000 to $199,9993,406 $200,000 or more
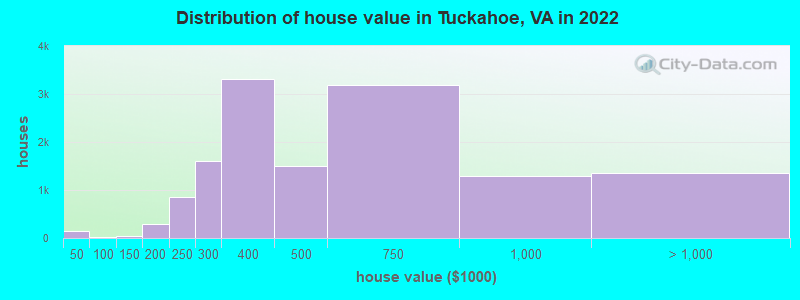
Home value of owner - occupied houses in 2022 in Tuckahoe, VA 41 Less than $10,00030 $15,000 to $19,99921 $20,000 to $24,99922 $30,000 to $34,99912 $35,000 to $39,99915 $40,000 to $49,99913 $60,000 to $69,9999 $100,000 to $124,99934 $125,000 to $149,999170 $150,000 to $174,999118 $175,000 to $199,999858 $200,000 to $249,9991,611 $250,000 to $299,9993,316 $300,000 to $399,9991,498 $400,000 to $499,9993,178 $500,000 to $749,9991,297 $750,000 to $999,9991,158 $1,000,000 to $1,499,99982 $1,500,000 to $1,999,999115 $2,000,000 or moreRent paid by renters in 2022 in Tuckahoe, VA 54 $100 to $14943 $150 to $199157 $200 to $24979 $300 to $349163 $350 to $399145 $400 to $44940 $450 to $4991 $550 to $59929 $600 to $64938 $650 to $699256 $700 to $749263 $750 to $799219 $800 to $899768 $900 to $9991,328 $1,000 to $1,2491,204 $1,250 to $1,4991,999 $1,500 to $1,999217 $2,000 to $2,499125 $2,500 to $2,99941 $3,000 to $3,49951 $3,500 or more301 No cash rent
Percentage of workers working in this county: 64.6%Number of people working at home: 5,909 (25.0% of all workers )
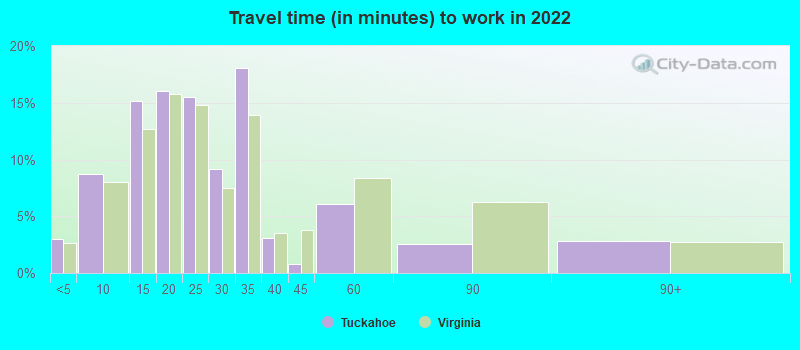
Travel time to work (commute)
Less than 5 minutes: 3935 to 9 minutes: 1,70710 to 14 minutes: 2,32715 to 19 minutes: 4,24220 to 24 minutes: 3,38325 to 29 minutes: 1,76330 to 34 minutes: 2,41335 to 39 minutes: 36840 to 44 minutes: 16445 to 59 minutes: 54560 to 89 minutes: 26090 or more minutes: 260
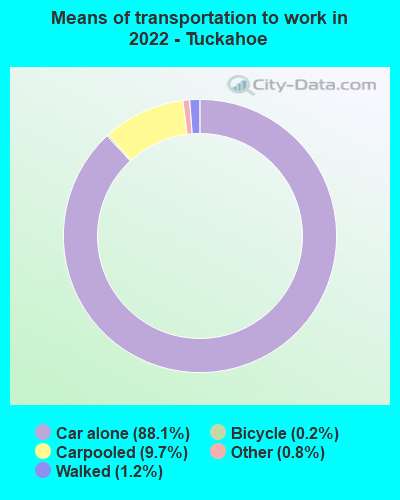
Means of transportation to work:
Drove a car alone: 9,370 (58.4%)Carpooled: 1,124 (7.0%)Subway or elevated rail : 2 (0.0%)Long-distance train or commuter rail : 1 (0.0%)Taxi: 155 (1.0%)Bicycle: 19 (0.1%)Walked: 170 (1.1%)Worked at home: 5,909 (36.9%)
Unemployment by race in 2022
Unemployment rate for White non-Hispanic residents 3.0% Males3.6% FemalesUnemployment rate for Black residents 12.2% Males6.6% FemalesUnemployment rate for Asian residents 3.1% Males1.7% FemalesUnemployment rate for two or more race residents 4.2% Males18.9% FemalesUnemployment rate for Hispanic or Latino residents 1.4% Males
Year of entry for the foreign-born population in Tuckahoe, Virginia
2,846 2010 or later 1,152 2000 to 2009 1,112 1990 to 1999 737 1980 to 1989 464 1970 to 1979 662 Before 1970
First ancestries reported:
English: 4,151 (16.8%)
American: 1,899 (7.7%)
Irish: 1,697 (6.9%)
German: 1,417 (5.8%)
Italian: 1,147 (4.7%)
European: 719 (2.9%)
Scotch-Irish: 588 (2.4%)
Scottish: 564 (2.3%)
Egyptian: 496 (2.0%)
Polish: 406 (1.6%)
Afghan: 258 (1.0%)
British: 240 (1.0%)
Jamaican: 224 (0.9%)
Iraqi: 221 (0.9%)
Brazilian: 211 (0.9%)
Turkish: 176 (0.7%)
African: 171 (0.7%)
Yugoslavian: 144 (0.6%)
Greek: 135 (0.5%)
Welsh: 134 (0.5%)
Liberian: 122 (0.5%)
French: 118 (0.5%)
Canadian: 112 (0.5%)
Scandinavian: 108 (0.4%)
Russian: 108 (0.4%)
Northern European: 101 (0.4%)
Armenian: 91 (0.4%)
Lebanese: 86 (0.3%)
French Canadian: 86 (0.3%)
Dutch: 78 (0.3%)
Ukrainian: 73 (0.3%)
Norwegian: 72 (0.3%)
Czech: 68 (0.3%)
Portuguese: 62 (0.3%)
Cajun: 61 (0.2%)
Arab: 55 (0.2%)
Slovak: 53 (0.2%)
Eastern European: 49 (0.2%)
Hungarian: 47 (0.2%)
Romanian: 42 (0.2%)
Lithuanian: 36 (0.1%)
Swedish: 32 (0.1%)
Danish: 32 (0.1%)
Soviet Union: 28 (0.1%)
Kenyan: 19 (0.08%)
Trinidadian and Tobagonian: 19 (0.08%)
Barbadian: 15 (0.06%)
Haitian: 15 (0.06%)
South African: 12 (0.05%)
Latvian: 9 (0.04%)
Swiss: 9 (0.04%)
Serbian: 8 (0.03%)
Czechoslovakian: 7 (0.03%)
Most common places of birth for foreign-born residents (%): Vietnam Tuckahoe:
8.4% (530)Virginia:
4.2% (45,750)
Afghanistan Tuckahoe:
7.1% (448)Virginia:
1.8% (19,426)
Egypt Tuckahoe:
6.8% (428)Virginia:
0.9% (9,672)
El Salvador Tuckahoe:
5.0% (315)Virginia:
9.9% (107,534)
Liberia Tuckahoe:
4.7% (298)Virginia:
0.2% (2,214)
Italy Tuckahoe:
4.7% (294)Virginia:
0.5% (5,147)
Honduras Tuckahoe:
4.6% (287)Virginia:
3.0% (32,892)
Brazil Tuckahoe:
4.5% (285)Virginia:
0.7% (8,081)
Mexico Tuckahoe:
4.1% (258)Virginia:
5.3% (57,498)
China, excluding Hong Kong and Taiwan Tuckahoe:
3.7% (233)Virginia:
3.9% (42,989)
Philippines Tuckahoe:
2.9% (181)Virginia:
4.8% (52,629)
India Tuckahoe:
2.9% (180)Virginia:
9.0% (97,830)
Sudan Tuckahoe:
2.7% (169)Virginia:
0.4% (4,442)
Jamaica Tuckahoe:
2.7% (169)Virginia:
1.0% (10,734)
Russia Tuckahoe:
2.1% (134)Virginia:
0.9% (9,440)
Canada Tuckahoe:
2.1% (131)Virginia:
1.2% (12,984)
Iraq Tuckahoe:
2.0% (125)Virginia:
0.9% (9,351)
Uzbekistan Tuckahoe:
1.6% (102)Virginia:
0.1% (853)
Place of birth for U.S.-born residents:
This state: 25,234Other state: 16,170Northeast: 5,410Midwest: 2,269South: 6,903West: 1,596 88.3% of Tuckahoe residents lived in the same house 1 years ago.
Out of people who lived in different houses, 37.1% lived in this county.
Out of people who lived in different counties, 76.0% lived in Virginia.
Tuckahoe:
88.3%State average:
86.6%
Education attainment for males 25 years and older:
No schooling: 166Nursery to 4th grade: 505th and 6th grade: 1507th and 8th grade: 389th grade: 14210th grade: 2611th grade: 6412th grade, no diploma: 358High school graduate (or equivalency): 2,123Less than 1 year of college: 626Some college more than 1 year, no degree: 1,616Associate degree: 829Bachelor's degree: 5,430Master's degree: 2,452Professional school degree: 1,005Doctorate degree: 532
Education attainment for females 25 years and older:
No schooling: 243Nursery to 4th grade: 805th and 6th grade: 847th and 8th grade: 339th grade: 11310th grade: 17411th grade: 5612th grade, no diploma: 249High school graduate (or equivalency): 2,500Less than 1 year of college: 684Some college more than 1 year, no degree: 1,942Associate degree: 1,096Bachelor's degree: 6,417Master's degree: 3,154Professional school degree: 668Doctorate degree: 464
Housing units in structures:
One, detached: 13,363One, attached: 2,510Two: 3423 or 4: 1,3265 to 9: 88110 to 19: 66220 to 49: 60350 or more: 1,141Mobile homes: 72Housing units lacking complete plumbing facilities in 2022: 0.5%Housing units lacking complete kitchen facilities in 2022: 2.4%House/condo owner moved in on average 13 years ago
Renter moved in on average 1 years ago
Private vs. public school enrollment:
Students in private schools in grades 1 to 8 (elementary and middle school): 1,381 Students in private schools in grades 9 to 12 (high school): 765 Students in private undergraduate colleges: 192