Tuckerton, NJ (New Jersey) Houses and Residents
| Tuckerton: | $296,672 |
| New Jersey: | $428,900 |
Mean price in 2022:
Detached houses: $388,235
Here: $388,235 State: $537,591 Townhouses or other attached units: $215,750
Here: $215,750 State: $381,113 Mobile homes: $36,988
Here: $36,988 State: $119,788
Total population: 3,396 (All urban)
Houses: 1,800 (1,548 occupied: 1,088 owner occupied, 466 renter occupied)
| % of renters here: | 30% |
| State: | 35% |
Housing density: 492 houses/condos per square mile
Median price asked for vacant for-sale houses and condos in 2022 in this county: $113,957.
Median contract rent in 2022: $1,357 (lower quartile is $993, upper quartile is $1,655)
Median rent asked for vacant for-rent units in 2022: $1,246
Median gross rent in Tuckerton, NJ in 2022: $1,565
Housing units in Tuckerton with a mortgage: 720 (83 second mortgage, 0 home equity loan, 69 both second mortgage and home equity loan)
Houses without a mortgage: 11
Median household income for houses/condos with a mortgage: $99,798
Median household income for apartments without a mortgage: $75,285
Median monthly housing costs: $1,555
Compare current foreclosures in Tuckerton, NJ:
| Photo | Address | Area | Beds / Baths | Price | Details |
|---|---|---|---|---|---|

|
#1
W Mullica Rd
Tuckerton, NJ 08087
|
1,024 sq. feet
|
1 baths 3 beds |
show details | |

|
#2
N Maple Ave
Tuckerton, NJ 08087
|
- sq. feet
|
- baths - beds |
$400,000
|
show details |

|
#3
Driftwood Dr
Tuckerton, NJ 08087
|
1,034 sq. feet
|
- baths - beds |
show details | |

|
#4
Saratoga Lake Dr
Tuckerton, NJ 08087
|
1,208 sq. feet
|
- baths - beds |
show details | |

|
#5
Lake Winnepesaukee Dr
Tuckerton, NJ 08087
|
- sq. feet
|
- baths - beds |
show details | |

|
#6
National Union Blvd
Tuckerton, NJ 08087
|
- sq. feet
|
- baths - beds |
show details | |

|
#7
Bass Rd
Tuckerton, NJ 08087
|
- sq. feet
|
- baths - beds |
show details | |

|
#8
Ash Rd
Tuckerton, NJ 08087
|
1,296 sq. feet
|
- baths - beds |
show details | |

|
#9
Dock St
Tuckerton, NJ 08087
|
- sq. feet
|
- baths - beds |
show details | |

|
#10
Marlin Rd
Tuckerton, NJ 08087
|
1,280 sq. feet
|
- baths - beds |
show details |
| Photo | Address | Area | Beds / Baths | Price | Details |
|---|---|---|---|---|---|

|
#11
Lake Medford Ln
Tuckerton, NJ 08087
|
1,488 sq. feet
|
- baths - beds |
show details | |

|
#12
Ash Rd
Tuckerton, NJ 08087
|
- sq. feet
|
- baths - beds |
show details | |

|
#13
Hunter Dr
Tuckerton, NJ 08087
|
- sq. feet
|
- baths - beds |
show details | |

|
#14
Seameadow Dr
Tuckerton, NJ 08087
|
- sq. feet
|
- baths - beds |
show details | |

|
#15
Lake Winnepesaukee Dr
Tuckerton, NJ 08087
|
- sq. feet
|
- baths - beds |
show details | |

|
#16
1st Ave
Tuckerton, NJ 08087
|
1,152 sq. feet
|
- baths - beds |
show details | |

|
#17
Otis Ave
Tuckerton, NJ 08087
|
- sq. feet
|
- baths - beds |
show details | |

|
#18
Angela Dr
Tuckerton, NJ 08087
|
- sq. feet
|
- baths - beds |
show details | |

|
#19
Seameadow Dr
Tuckerton, NJ 08087
|
- sq. feet
|
- baths - beds |
show details | |

|
#20
E Main St
Tuckerton, NJ 08087
|
- sq. feet
|
- baths - beds |
show details |
| Photo | Address | Area | Beds / Baths | Price | Details |
|---|---|---|---|---|---|

|
#21
Hannah Pl
Tuckerton, NJ 08087
|
- sq. feet
|
- baths - beds |
show details | |

|
#22
Falcon Dr
Tuckerton, NJ 08087
|
- sq. feet
|
- baths - beds |
show details | |

|
#23
W Main St
Tuckerton, NJ 08087
|
2,147 sq. feet
|
- baths - beds |
show details | |

|
#24
Marlin Rd
Tuckerton, NJ 08087
|
1,280 sq. feet
|
- baths - beds |
show details | |

|
#25
Southwinds Dr
Tuckerton, NJ 08087
|
- sq. feet
|
- baths - beds |
show details | |

|
#26
Clay St
Tuckerton, NJ 08087
|
1,742 sq. feet
|
- baths - beds |
show details | |

|
#27
Phillips Rd
Tuckerton, NJ 08087
|
2,028 sq. feet
|
- baths - beds |
show details | |

|
#28
S Commodore Dr
Tuckerton, NJ 08087
|
- sq. feet
|
- baths - beds |
show details | |

|
#29
Sandpiper Ln
Tuckerton, NJ 08087
|
- sq. feet
|
- baths - beds |
show details | |

|
#30
E Main St
Tuckerton, NJ 08087
|
2,209 sq. feet
|
- baths - beds |
show details |
| Photo | Address | Area | Beds / Baths | Price | Details |
|---|---|---|---|---|---|

|
#31
Maria Dr
Tuckerton, NJ 08087
|
- sq. feet
|
- baths - beds |
show details | |

|
#32
Philips Rd
Tuckerton, NJ 08087
|
2,028 sq. feet
|
- baths - beds |
show details | |

|
#33
N Maple Ave
Tuckerton, NJ 08087
|
- sq. feet
|
- baths - beds |
show details | |

|
#34
Ash Rd
Tuckerton, NJ 08087
|
1,306 sq. feet
|
- baths - beds |
show details | |

|
#35
Thomas Ave
Tuckerton, NJ 08087
|
- sq. feet
|
- baths - beds |
show details | |

|
#36
Wood St
Tuckerton, NJ 08087
|
2,944 sq. feet
|
- baths - beds |
show details | |

|
#37
Ash Rd
Tuckerton, NJ 08087
|
1,428 sq. feet
|
- baths - beds |
show details | |

|
#38
1st Ave
Tuckerton, NJ 08087
|
1,468 sq. feet
|
- baths - beds |
show details | |

|
#39
Brigantine Ter
Tuckerton, NJ 08087
|
2,113 sq. feet
|
- baths - beds |
show details | |

|
#40
Greenwood Lake Rd
Tuckerton, NJ 08087
|
- sq. feet
|
- baths - beds |
show details |
| Photo | Address | Area | Beds / Baths | Price | Details |
|---|---|---|---|---|---|

|
#41
W Delaware Dr
Tuckerton, NJ 08087
|
- sq. feet
|
- baths - beds |
show details | |

|
#42
Landing Ct
Tuckerton, NJ 08087
|
1,284 sq. feet
|
- baths - beds |
show details | |

|
#43
W Anchor Dr
Tuckerton, NJ 08087
|
- sq. feet
|
- baths - beds |
show details | |

|
#44
Osbourn Ct
Tuckerton, NJ 08087
|
- sq. feet
|
- baths - beds |
show details | |

|
#45
Saratoga Lake Dr
Tuckerton, NJ 08087
|
- sq. feet
|
- baths - beds |
show details | |

|
#46
Stage Rd
Tuckerton, NJ 08087
|
- sq. feet
|
- baths - beds |
show details | |

|
#47
Leitz Blvd
Tuckerton, NJ 08087
|
- sq. feet
|
- baths - beds |
show details | |

|
#48
Stage Rd
Tuckerton, NJ 08087
|
- sq. feet
|
- baths - beds |
show details | |

|
#49
Pinehurst Dr
Tuckerton, NJ 08087
|
- sq. feet
|
- baths - beds |
show details | |

|
Check over 1 million property listings on Foreclosure.com!
|
browse all offers | |||

Latest news about housing in Tuckerton, NJ collected exclusively by city-data.com from local newspapers, TV, and radio stations

 | Suggestions needed! Waterfront Home with FRESH WATER boating location? (4 replies) |
| New Jersey shore or Connecticut Shore? (71 replies) |
| Manahawkin, Forked River, Tuckerton, Little Egg Harbor. Good Jersey shore towns for retirement? (19 replies) |
| 50 miles of Wall, NJ - where to buy a home in a quiet neighborhood? (11 replies) |
| Modular homes (30 replies) |
| Piney People? (50 replies) |

Median year apartment built: 1989
Household type by relationship:
Households: 3,677- Male householders: 739 (217 living alone), Female householders: 840 (300 living alone)
702 spouses (677 opposite-sex spouses), 158 unmarried partners, (118 opposite-sex unmarried partners), 983 children (974 natural, 0 adopted, 9 stepchildren), 50 grandchildren, 58 brothers or sisters, 0 parents, 0 foster children, 19 other relatives, 89 non-relatives
- In group quarters: 35
Size of family households: 463 2-persons, 132 3-persons, 280 4-persons, 13 5-persons, 26 7-or-more-persons.
Size of nonfamily households: 480 1-person, 140 2-persons, 12 3-persons.
381 married couples with children.
188 single-parent households (22 men, 166 women).
94.4% of residents of Tuckerton speak English at home.
3.7% of residents speak Spanish at home (80% speak English very well, 20% speak English not well).
0.6% of residents speak other Indo-European language at home (100% speak English very well).
1.4% of residents speak Asian or Pacific Island language at home (65% speak English very well, 35% speak English not well).
Foreign born population: 50 (1.4%)
(60.0% of them are naturalized citizens)
| Here: | 6.6 |
| State: | 6.8 |
| Here: | 4.7 |
| State: | 3.9 |

- Bedrooms in owner-occupied houses and condos in Tuckerton, New Jersey
- 0no bedroom
- 71 bedroom
- 2532 bedrooms
- 5813 bedrooms
- 2164 bedrooms
- 315+ bedrooms

- Bedrooms in renter-occupied apartments in Tuckerton, New Jersey
- 0no bedroom
- 1051 bedroom
- 3472 bedrooms
- 153 bedrooms
- 04 bedrooms
- 05+ bedrooms

- Cars and other vehicles available in Tuckerton in owner-occupied houses/condos
- 35no vehicle
- 2791 vehicle
- 5042 vehicles
- 1893 vehicles
- 714 vehicles
- 105+ vehicles

- Cars and other vehicles available in Tuckerton in renter-occupied apartments
- 45no vehicle
- 2601 vehicle
- 1352 vehicles
- 263 vehicles
- 04 vehicles
- 05+ vehicles

- Rooms in owner-occupied houses in Tuckerton, New Jersey
- 01 room
- 02 rooms
- 143 rooms
- 564 rooms
- 2735 rooms
- 1876 rooms
- 2647 rooms
- 1768 rooms
- 1199+ rooms

- Rooms in renter-occupied apartments in Tuckerton, New Jersey
- 01 room
- 122 rooms
- 693 rooms
- 1344 rooms
- 2255 rooms
- 66 rooms
- 07 rooms
- 128 rooms
- 89+ rooms


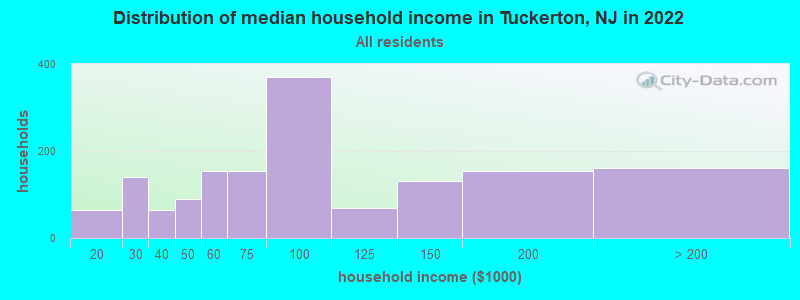
Tuckerton, NJ household income distribution

- 64$10,000 to $19,999
- 141$20,000 to $29,999
- 64$30,000 to $39,999
- 90$40,000 to $49,999
- 153$50,000 to $59,999
- 154$60,000 to $74,999
- 370$75,000 to $99,999
- 70$100,000 to $124,999
- 132$125,000 to $149,999
- 153$150,000 to $199,999
- 161$200,000 or more
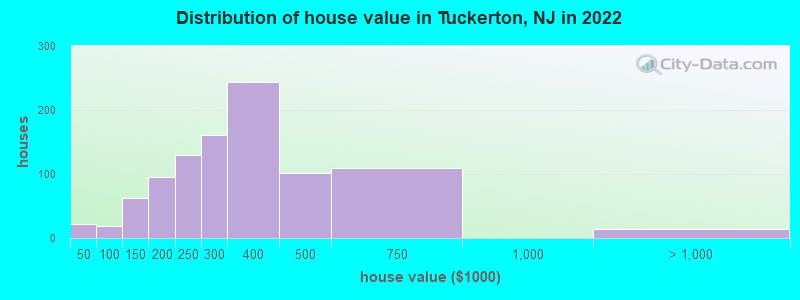
Home value of owner - occupied houses in 2022 in Tuckerton, NJ
-
- 17Less than $10,000
- 3$15,000 to $19,999
- 19$60,000 to $69,999
- 20$100,000 to $124,999
- 42$125,000 to $149,999
- 20$150,000 to $174,999
- 75$175,000 to $199,999
- 129$200,000 to $249,999
- 160$250,000 to $299,999
- 243$300,000 to $399,999
- 102$400,000 to $499,999
- 110$500,000 to $749,999
- 14$1,000,000 to $1,499,999
Rent paid by renters in 2022 in Tuckerton, NJ
-
- 9$250 to $299
- 92$500 to $549
- 38$550 to $599
- 37$1,000 to $1,249
- 146$1,250 to $1,499
- 113$1,500 to $1,999
- 27$2,000 to $2,499
- 10No cash rent


Percentage of workers working in this county: 72.5%
Number of people working at home: 282 (16.5% of all workers)
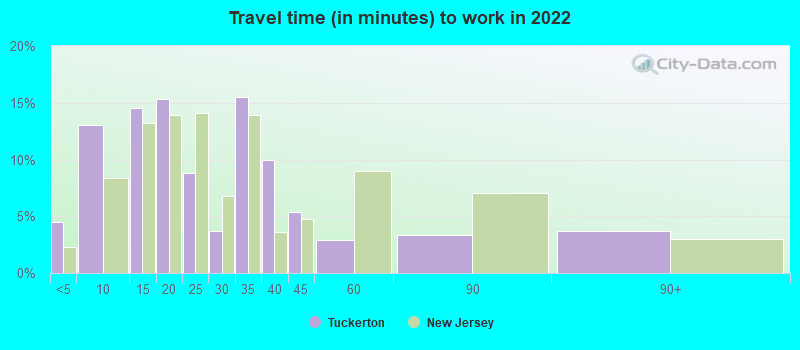
Travel time to work (commute)
- Less than 5 minutes: 48
- 5 to 9 minutes: 75
- 10 to 14 minutes: 170
- 15 to 19 minutes: 189
- 20 to 24 minutes: 72
- 25 to 29 minutes: 82
- 30 to 34 minutes: 154
- 35 to 39 minutes: 108
- 40 to 44 minutes: 172
- 45 to 59 minutes: 117
- 60 to 89 minutes: 118
- 90 or more minutes: 132
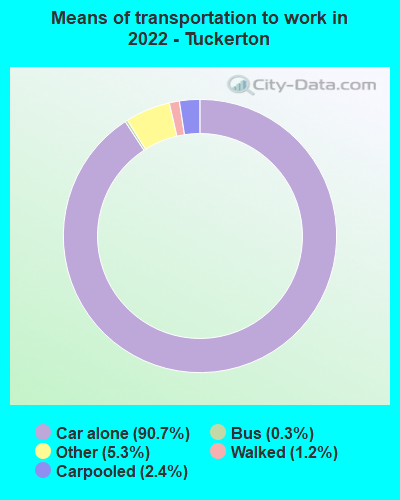
Means of transportation to work:
- Drove a car alone: 829 (69.4%)
- Carpooled: 25 (2.1%)
- Bus: 2 (0.2%)
- Taxi: 45 (3.8%)
- Walked: 14 (1.2%)
- Worked at home: 282 (23.6%)

- Unemployment by race in 2022
- Unemployment rate for White non-Hispanic residents
- 7.6%Males
- 7.3%Females
- Unemployment rate for two or more race residents
- 48.7%Males
- Unemployment rate for Hispanic or Latino residents
- 61.3%Males

- Year of entry for the foreign-born population in Tuckerton, New Jersey
- 02010 or later
- 172000 to 2009
- 281990 to 1999
- 01980 to 1989
- 81970 to 1979
- 50Before 1970

First ancestries reported:
- Italian: 343 (22.9%)
- Irish: 233 (15.5%)
- Norwegian: 150 (10.0%)
- American: 128 (8.5%)
- English: 75 (5.0%)
- British: 47 (3.1%)
- German: 42 (2.8%)
- French Canadian: 37 (2.5%)
- Lithuanian: 35 (2.3%)
- Scottish: 35 (2.3%)
- Slovak: 24 (1.6%)
- Polish: 23 (1.5%)
- Czech: 19 (1.3%)
- European: 19 (1.3%)
- French: 17 (1.1%)
- Dutch: 11 (0.7%)
- Ukrainian: 6 (0.4%)
- Russian: 4 (0.3%)
Most common places of birth for foreign-born residents (%):
| Tuckerton: | 62.0% (31) |
| New Jersey: | 2.1% (45,435) |
| Tuckerton: | 34.0% (17) |
| New Jersey: | 3.3% (70,512) |
Place of birth for U.S.-born residents:
- This state: 2,405
- Other state: 1,188
- Northeast: 908
- Midwest: 8
- South: 68
- West: 191
96.1% of Tuckerton residents lived in the same house 1 years ago.
Out of people who lived in different houses, 17.9% lived in this county.
Out of people who lived in different counties, 3.2% lived in New Jersey.
| Tuckerton: | 96.1% |
| State average: | 90.4% |
Education attainment for males 25 years and older:
- No schooling: 9
- Nursery to 4th grade: 0
- 5th and 6th grade: 0
- 7th and 8th grade: 0
- 9th grade: 18
- 10th grade: 0
- 11th grade: 12
- 12th grade, no diploma: 42
- High school graduate (or equivalency): 319
- Less than 1 year of college: 50
- Some college more than 1 year, no degree: 238
- Associate degree: 139
- Bachelor's degree: 388
- Master's degree: 136
- Professional school degree: 20
- Doctorate degree: 23

Education attainment for females 25 years and older:
- No schooling: 15
- Nursery to 4th grade: 0
- 5th and 6th grade: 10
- 7th and 8th grade: 0
- 9th grade: 0
- 10th grade: 0
- 11th grade: 0
- 12th grade, no diploma: 20
- High school graduate (or equivalency): 392
- Less than 1 year of college: 56
- Some college more than 1 year, no degree: 220
- Associate degree: 107
- Bachelor's degree: 365
- Master's degree: 144
- Professional school degree: 15
- Doctorate degree: 0


Housing units in structures:
- One, detached: 1,150
- One, attached: 311
- Two: 5
- 3 or 4: 22
- 5 to 9: 44
- 20 to 49: 50
- 50 or more: 97
- Mobile homes: 118
Housing units lacking complete kitchen facilities in 2022: 2.7%
House/condo owner moved in on average 14 years ago
Renter moved in on average 4 years ago


- 86.5%Utility gas
- 7.1%Electricity
- 5.4%Fuel oil, kerosene, etc.
- 1.0%Solar energy
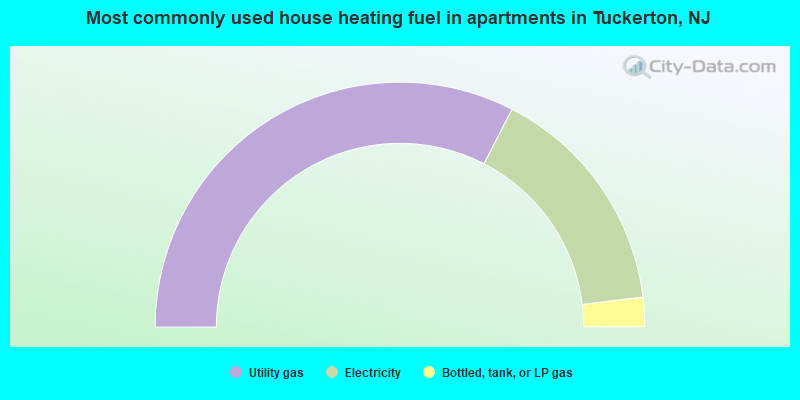
- 65.2%Utility gas
- 31.0%Electricity
- 3.9%Bottled, tank, or LP gas
Private vs. public school enrollment:
| Here: | 22.4% |
| New Jersey: | 12.3% |
| Here: | 7.8% |
| New Jersey: | 13.1% |
| Here: | 40.1% |
| New Jersey: | 33.2% |


