Turnbull, WA (Washington) Houses and Residents
| Turnbull: | $483,131 |
| Washington: | $569,500 |
Total population: 2,632 (Urban population: 0, Rural population: 2,264 (108 farm, 2,156 nonfarm))
Houses: 1,002 (854 occupied: 770 owner occupied, 84 renter occupied)
| % of renters here: | 10% |
| State: | 36% |
Housing density: 4 houses/condos per square mile
Median price asked for vacant for-sale houses and condos in 2022 in this county: $398,010.
Median contract rent in 2022: $1,196 (lower quartile is $958, upper quartile is $1,792)
Median rent asked for vacant for-rent units in 2022: $765
Median gross rent in Turnbull, WA in 2022: $1,336
Housing units in Turnbull with a mortgage: 148 (25 second mortgage, 13 home equity loan, 0 both second mortgage and home equity loan)
Houses without a mortgage: 55


Household type by relationship:
Households: 456,529- In family households: 366,690 (83,287 male householders, 34,925 female householders)
88,280 spouses, 127,815 children (116,710 natural, 4,033 adopted, 7,072 stepchildren), 7,024 grandchildren, 3,522 brothers or sisters, 2,875 parents, foster children, 3,766 other relatives, 12,897 non-relatives
- In nonfamily households: 89,839 (32,533 male householders (24,107 living alone)), 36,422 female householders (29,515 living alone)), 20,884 nonrelatives
- In group quarters: 14,692 (5,666 institutionalized population)
72,314 married couples with children.
26,546 single-parent households (6,454 men, 20,092 women).
96.8% of residents of Turnbull speak English at home.
1.8% of residents speak Spanish at home (74% speak English very well, 13% speak English well, 13% speak English not well).
1.4% of residents speak other Indo-European language at home (81% speak English very well, 19% speak English not well).
Foreign born population: 81 (2.7%)
(81.5% of them are naturalized citizens)
| Here: | 7.1 |
| State: | 6.5 |
| Here: | 6.0 |
| State: | 3.9 |

- Bedrooms in owner-occupied houses and condos in Turnbull, Washington
- 0no bedroom
- 121 bedroom
- 2012 bedrooms
- 4033 bedrooms
- 1104 bedrooms
- 445+ bedrooms

- Bedrooms in renter-occupied apartments in Turnbull, Washington
- 0no bedroom
- 01 bedroom
- 252 bedrooms
- 463 bedrooms
- 134 bedrooms
- 05+ bedrooms

- Cars and other vehicles available in Turnbull in owner-occupied houses/condos
- 0no vehicle
- 1111 vehicle
- 3472 vehicles
- 1753 vehicles
- 904 vehicles
- 475+ vehicles

- Cars and other vehicles available in Turnbull in renter-occupied apartments
- 0no vehicle
- 381 vehicle
- 302 vehicles
- 103 vehicles
- 64 vehicles
- 05+ vehicles

- Rooms in owner-occupied houses in Turnbull, Washington
- 01 room
- 02 rooms
- 293 rooms
- 834 rooms
- 1735 rooms
- 1756 rooms
- 1117 rooms
- 908 rooms
- 1099+ rooms

- Rooms in renter-occupied apartments in Turnbull, Washington
- 01 room
- 02 rooms
- 03 rooms
- 54 rooms
- 165 rooms
- 296 rooms
- 277 rooms
- 08 rooms
- 79+ rooms


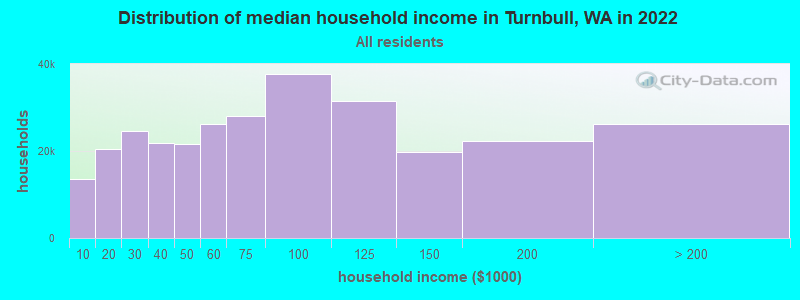
Turnbull, WA household income distribution

- 13,646Less than $10,000
- 20,550$10,000 to $19,999
- 24,513$20,000 to $29,999
- 21,818$30,000 to $39,999
- 21,590$40,000 to $49,999
- 26,319$50,000 to $59,999
- 28,042$60,000 to $74,999
- 37,673$75,000 to $99,999
- 31,487$100,000 to $124,999
- 19,749$125,000 to $149,999
- 22,344$150,000 to $199,999
- 26,306$200,000 or more
Percentage of workers working in this county: 95.3%
Number of people working at home: 249 (16.0% of all workers)
Travel time to work (commute)
- Less than 5 minutes: 13
- 5 to 9 minutes: 45
- 10 to 14 minutes: 76
- 15 to 19 minutes: 112
- 20 to 24 minutes: 184
- 25 to 29 minutes: 154
- 30 to 34 minutes: 237
- 35 to 39 minutes: 76
- 40 to 44 minutes: 61
- 45 to 59 minutes: 109
- 60 to 89 minutes: 14
- 90 or more minutes: 11
Means of transportation to work:
- Drove a car alone: 854 (74.3%)
- Carpooled: 218 (19.0%)
- Motorcycle: 8 (0.7%)
- Walked: 5 (0.4%)
- Other means: 7 (0.6%)
- Worked at home: 58 (5.0%)


- Year of entry for the foreign-born population in Turnbull, Washington
- 61995 to March 2000
- 61990 to 1994
- 181985 to 1989
- 01980 to 1984
- 01975 to 1979
- 01970 to 1974
- 01965 to 1969
- 25Before 1965
Most common places of birth for foreign-born residents (%):
| Turnbull: | 20.0% (11) |
| Washington: | 3.4% (21,167) |
| Turnbull: | 18.2% (10) |
| Washington: | 24.1% (148,115) |
| Turnbull: | 14.5% (8) |
| Washington: | 0.2% (1,344) |
| Turnbull: | 14.5% (8) |
| Washington: | 2.4% (14,714) |
| Turnbull: | 10.9% (6) |
| Washington: | 2.5% (15,491) |
| Turnbull: | 10.9% (6) |
| Washington: | 1.0% (6,438) |
| Turnbull: | 10.9% (6) |
| Washington: | 7.7% (47,568) |
Place of birth for U.S.-born residents:
- This state: 1,249
- Other state: 952
- Northeast: 68
- Midwest: 205
- South: 150
- West: 529
62% of Turnbull residents lived in the same house 5 years ago.
Out of people who lived in different houses, 56% lived in this county.
Out of people who lived in different counties, 66% lived in Washington.
Education attainment for males 25 years and older:
- No schooling: 7
- Nursery to 4th grade: 0
- 5th and 6th grade: 0
- 7th and 8th grade: 7
- 9th grade: 5
- 10th grade: 12
- 11th grade: 31
- 12th grade, no diploma: 0
- High school graduate (or equivalency): 211
- Less than 1 year of college: 75
- Some college more than 1 year, no degree: 147
- Associate degree: 74
- Bachelor's degree: 157
- Master's degree: 44
- Professional school degree: 18
- Doctorate degree: 36

Education attainment for females 25 years and older:
- No schooling: 0
- Nursery to 4th grade: 0
- 5th and 6th grade: 5
- 7th and 8th grade: 0
- 9th grade: 0
- 10th grade: 13
- 11th grade: 30
- 12th grade, no diploma: 18
- High school graduate (or equivalency): 189
- Less than 1 year of college: 104
- Some college more than 1 year, no degree: 151
- Associate degree: 61
- Bachelor's degree: 149
- Master's degree: 50
- Professional school degree: 6
- Doctorate degree: 7


Housing units in structures:
- One, detached: 547
- One, attached: 19
- Mobile homes: 436
Median worth of mobile homes: $183,325

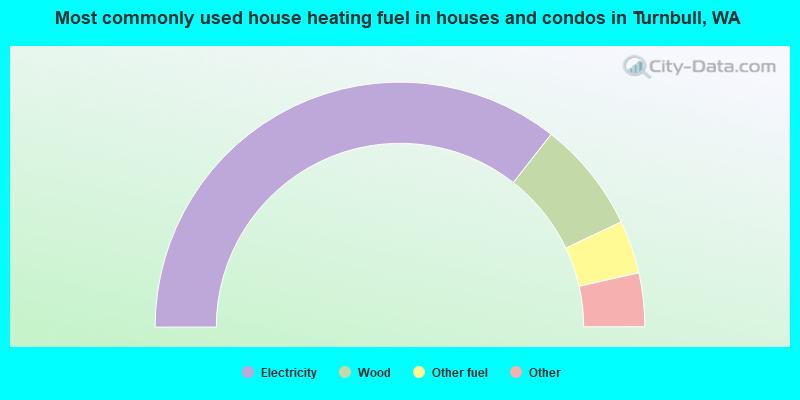
- 71.2%Electricity
- 14.7%Wood
- 7.0%Other fuel
- 3.5%Bottled, tank, or LP gas
- 2.9%Fuel oil, kerosene, etc.
- 0.8%Utility gas
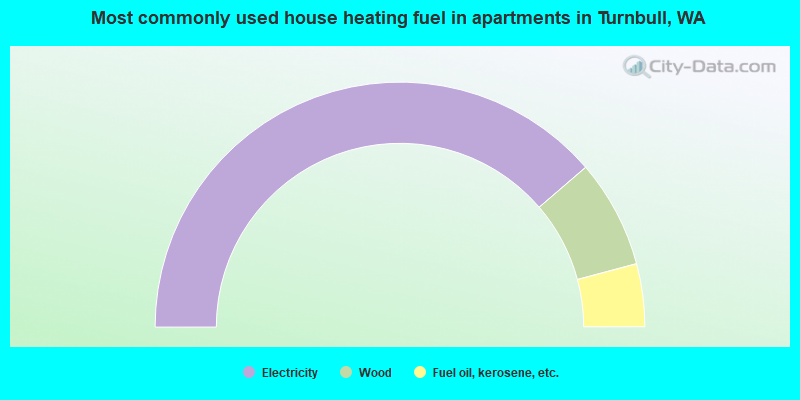
- 77.4%Electricity
- 14.3%Wood
- 8.3%Fuel oil, kerosene, etc.
Private vs. public school enrollment:
| Here: | 10.1% |
| Washington: | 9.2% |
| Here: | 10.4% |
| Washington: | 7.0% |
| Here: | 7.3% |
| Washington: | 15.7% |


