Tyler, TX (Texas) Houses and Residents
Estimated median house or condo value in 2022: $234,400 (it was $80,100 in 2000 )
Tyler:
$234,400Texas:
$275,400
Lower value quartile - upper value quartile: $154,700 - $344,700Mean price in 2022: Detached houses: $298,862 Here:
$298,862State:
$369,058
Townhouses or other attached units: $178,714 Here:
$178,714State:
$327,631
In 2-unit structures: $256,231 Here:
$256,231State:
$374,947
In 3-to-4-unit structures: $107,748 Here:
$107,748State:
$209,652
In 5-or-more-unit structures: $317,566 Here:
$317,566State:
$413,944
Mobile homes: $101,990 Here:
$101,990State:
$124,413
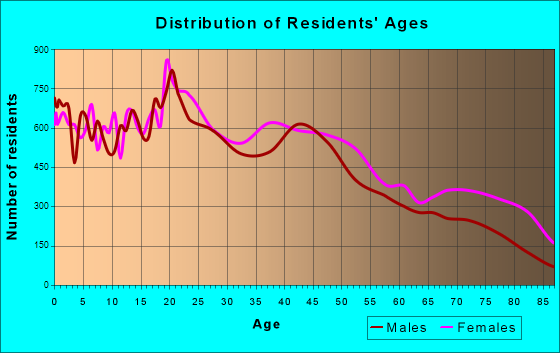
Total population: 101,421 (Urban population: 82,603, Rural population: 1,258 (8 farm, 1,250 nonfarm ))
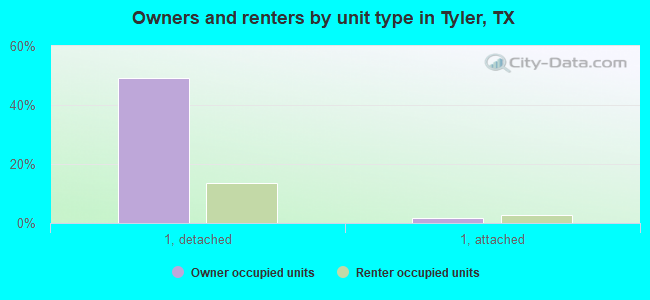
Houses: 45,352 (37,522 occupied: 22,335 owner occupied, 15,187 renter occupied )
% of renters here:
40%State:
38%
Housing density: 920 houses/condos per square mile
Median price asked for vacant for-sale houses and condos in 2022: $227,104.
Median contract rent in 2022: $964 (lower quartile is $754, upper quartile is $1,268)
Median rent asked for vacant for-rent units in 2022: $1,253
Median gross rent in Tyler, TX in 2022: $1,121
Housing units in Tyler with a mortgage: 11,860 (268 second mortgage, 17 home equity loan, 304 both second mortgage and home equity loan )Houses without a mortgage: 59
Median household income for houses/condos with a mortgage: $103,529
Median household income for apartments without a mortgage: $59,348
Median monthly housing costs: $1,102
Data:
Median house or condo value ($)
Median house or condo value ($ change since 2000)
Median house or condo value ($) - White
Median house or condo value ($) - Black or African American
Median house or condo value ($) - Asian
Median house or condo value ($) - Hispanic or Latino
Median house or condo value ($) - American Indian and Alaska Native
Median house or condo value ($) - Multirace
Median house or condo value ($) - Other Race
Median price asked for mobile homes ($)
Household density (households per square mile)
Mean house or condo value by units in structure - 1, detached ($)
Mean house or condo value by units in structure - 1, attached ($)
Mean house or condo value by units in structure - 2 ($)
Mean house or condo value by units in structure by units in structure - 3 or 4 ($)
Mean house or condo value by units in structure - 5 or more ($)
Mean house or condo value by units in structure - Boat, RV, van, etc. ($)
Mean house or condo value by units in structure - Mobile home ($)
Median contract rent ($)
Median contract rent - Lower quartile ($)
Median contract rent - Upper quartile ($)
Median gross rent ($)
Urban houses (%)
Rural houses (%)
Houses occupied (%)
Houses occupied (% change since 2000)
Houses owner occupied (%)
Houses owner occupied (% change since 2000)
Houses renter occupied (%)
Houses renter occupied (% change since 2000)
Vacant housing units - For rent (%)
Vacant housing units - For rent (% change since 2000)
Vacant housing units - For sale only (%)
Vacant housing units - For sale only (% change since 2000)
Vacant housing units - Rented or sold, not occupied (%)
Vacant housing units - Rented or sold, not occupied (% change since 2000)
Vacant housing units - For seasonal, recreational, or occasional use (%)
Vacant housing units - For seasonal, recreational, or occasional use (% change since 2000)
Vacant housing units - For migrant workers (%)
Vacant housing units - For migrant workers (% change since 2000)
Vacant housing units - Other vacant (%)
Vacant housing units - Other vacant (% change since 2000)
Median monthly housing costs ($)
Median household income for houses/condos with a mortgage ($)
Median household income for houses/condos without a mortgage ($)
Median household income ($)
Median household income ($) - White
Median household income ($) - Black or African American
Median household income ($) - Asian
Median household income ($) - Hispanic or Latino
Median household income ($) - American Indian and Alaska Native
Median household income ($) - Multirace
Median household income ($) - Other Race
Mortgage status - with mortgage (%)
Mortgage status - with second mortgage (%)
Mortgage status - with home equity loan (%)
Mortgage status - with both second mortgage and home equity loan (%)
Mortgage status - without a mortgage (%)
Median year house/condo built
Median year apartment built
Household type by relationship - Male householder living alone (%)
Household type by relationship - Male householder not living alone (%)
Household type by relationship - Female householder living alone (%)
Household type by relationship - Female householder not living alone (%)
Household type by relationship - Opposite-Sex spouse (%)
Household type by relationship - Same-Sex spouse (%)
Household type by relationship - Opposite-Sex unmarried partner (%)
Household type by relationship - Same-Sex unmarried partner (%)
Household type by relationship - In group quarters (%)
Size of family households - 2-person household (%)
Size of family households - 3-person household (%)
Size of family households - 4-person household (%)
Size of family households - 5-person household (%)
Size of family households - 6-person household (%)
Size of family households - 7-or-more-person household (%)
Size of nonfamily households - 1-person household (%)
Size of nonfamily households - 2-person household (%)
Size of nonfamily households - 3-person household (%)
Size of nonfamily households - 4-person household (%)
Size of nonfamily households - 5-person household (%)
Size of nonfamily households - 6-person household (%)
Size of nonfamily households - 7-or-moreperson household (%)
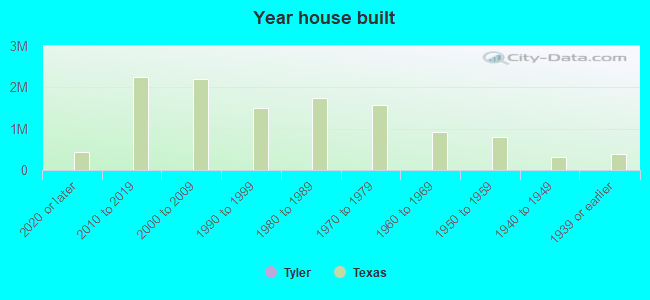
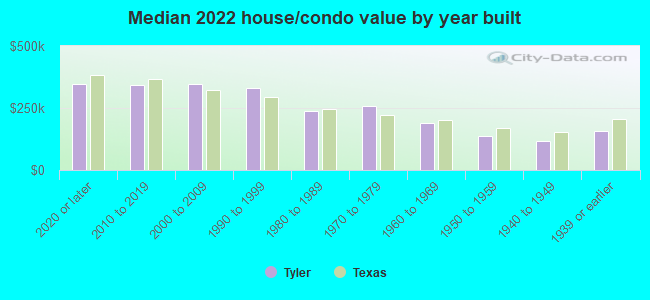
Year house built - Built 2010 or later (%)
Year house built - Built 2000 to 2009 (%)
Year house built - Built 1990 to 1999 (%)
Year house built - Built 1980 to 1989 (%)
Year house built - Built 1970 to 1979 (%)
Year house built - Built 1960 to 1969 (%)
Year house built - Built 1950 to 1959 (%)
Year house built - Built 1940 to 1949 (%)
Year house built - Built 1939 or earlier (%)
Median number of rooms in houses and condos
Median number of rooms in apartments
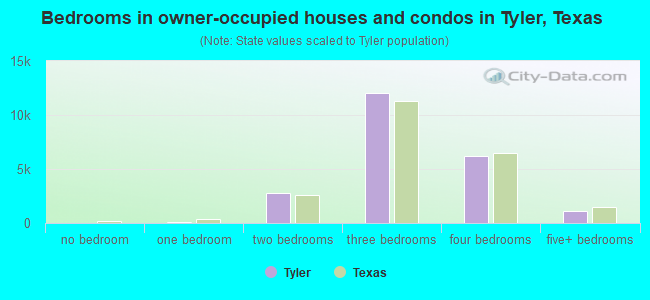
Median number of bedrooms in owner occupied houses
Mean number of bedrooms in owner occupied houses
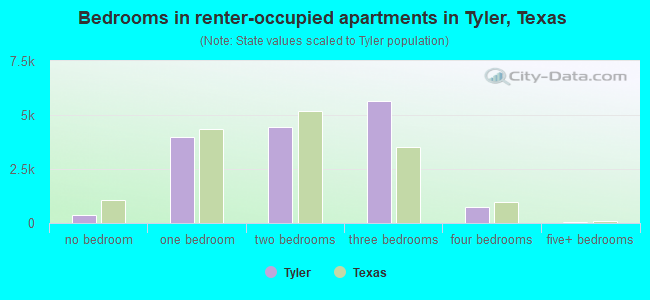
Median number of bedrooms in renter occupied houses
Mean number of bedrooms in renter occupied houses
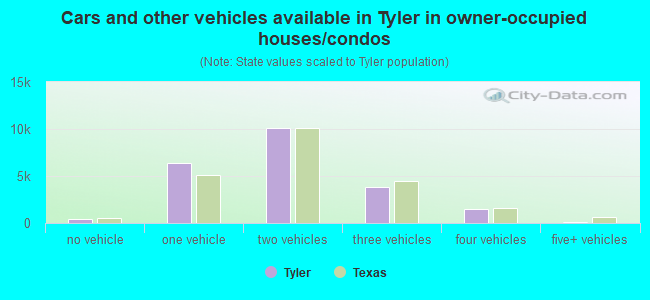
Median number of vehichles in owner occupied houses
Mean number of vehichles in owner occupied houses
Median number of vehichles in renter occupied houses
Mean number of vehichles in renter occupied houses
Rooms in owner-occupied houses - 1 room (%)
Rooms in owner-occupied houses - 2 rooms (%)
Rooms in owner-occupied houses - 3 rooms (%)
Rooms in owner-occupied houses - 4 rooms (%)
Rooms in owner-occupied houses - 5 rooms (%)
Rooms in owner-occupied houses - 6 rooms (%)
Rooms in owner-occupied houses - 7 rooms (%)
Rooms in owner-occupied houses - 8 rooms (%)
Rooms in owner-occupied houses - 9+ rooms (%)
Rooms in renter-occupied houses - 1 room (%)
Rooms in renter-occupied houses - 2 rooms (%)
Rooms in renter-occupied houses - 3 rooms (%)
Rooms in renter-occupied houses - 4 rooms (%)
Rooms in renter-occupied houses - 5 rooms (%)
Rooms in renter-occupied houses - 6 rooms (%)
Rooms in renter-occupied houses - 7 rooms (%)
Rooms in renter-occupied houses - 8 rooms (%)
Rooms in renter-occupied houses - 9+ rooms (%)
Bedrooms in owner-occupied houses - no bedrooms (%)
Bedrooms in owner-occupied houses - 1 bedroom (%)
Bedrooms in owner-occupied houses - 2 bedrooms (%)
Bedrooms in owner-occupied houses - 3 bedrooms (%)
Bedrooms in owner-occupied houses - 4 bedrooms (%)
Bedrooms in owner-occupied houses - 5+ bedrooms (%)
Bedrooms in renter-occupied houses - no bedrooms (%)
Bedrooms in renter-occupied houses - 1 bedroom (%)
Bedrooms in renter-occupied houses - 2 bedrooms (%)
Bedrooms in renter-occupied houses - 3 bedrooms (%)
Bedrooms in renter-occupied houses - 4 bedrooms (%)
Bedrooms in renter-occupied houses - 5+ bedrooms (%)
Vehicles available in owner-occupied houses - no vehicle available (%)
Vehicles available in owner-occupied houses - 1 vehicle available(%)
Vehicles available in owner-occupied houses - 2 Vehicles available (%)
Vehicles available in owner-occupied houses - 3 Vehicles available (%)
Vehicles available in owner-occupied houses - 4 Vehicles available (%)
Vehicles available in owner-occupied houses - 5+ Vehicles available (%)
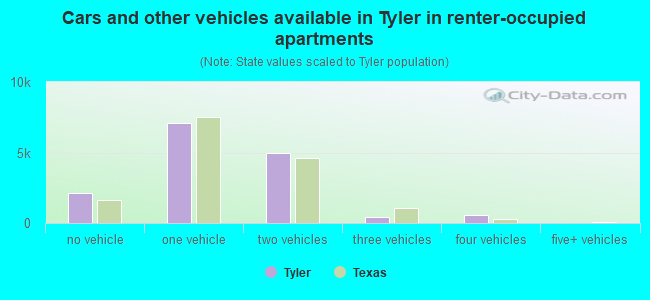
Vehicles available in renter-occupied houses - no vehicle available (%)
Vehicles available in renter-occupied houses - 1 vehicle available (%)
Vehicles available in renter-occupied houses - 2 Vehicles available (%)
Vehicles available in renter-occupied houses - 3 Vehicles available (%)
Vehicles available in renter-occupied houses - 4 Vehicles available (%)
Vehicles available in renter-occupied houses - 5+ Vehicles available (%)
Housing units in structures - 1, detached (%)
Housing units in structures - 1, attached (%)
Housing units in structures - 2 (%)
Housing units in structures - 3 or 4 (%)
Housing units in structures - 5 to 9 (%)
Housing units in structures - 10 to 19 (%)
Housing units in structures - 20 to 49 (%)
Housing units in structures - 50 or more (%)
Housing units in structures - Mobile home (%)
Housing units in structures - Boat, RV, van, etc. (%)
Housing units in structures - Owners - 1, detached (%)
Housing units in structures - Owners - 1, attached (%)
Housing units in structures - Owners - 2 (%)
Housing units in structures - Owners - 3 or 4 (%)
Housing units in structures - Owners - 5 to 9 (%)
Housing units in structures - Owners - 10 to 19 (%)
Housing units in structures - Owners - 20 to 49 (%)
Housing units in structures - Owners - 50 or more (%)
Housing units in structures - Owners - Mobile home (%)
Housing units in structures - Owners - Boat, RV, van, etc. (%)
Housing units in structures - Renters - 1, detached (%)
Housing units in structures - Renters - 1, attached (%)
Housing units in structures - Renters - 2 (%)
Housing units in structures - Renters - 3 or 4 (%)
Housing units in structures - Renters - 5 to 9 (%)
Housing units in structures - Renters - 10 to 19 (%)
Housing units in structures - Renters - 20 to 49 (%)
Housing units in structures - Renters - 50 or more (%)
Housing units in structures - Renters - Mobile home (%)
Housing units in structures - Renters - Boat, RV, van, etc. (%)
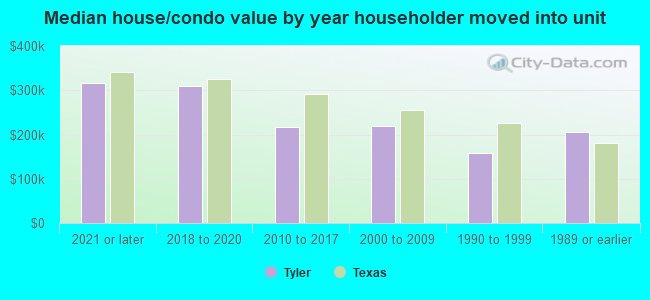
House/condo owner moved in on average (years ago)
Renter moved in on average (years ago)
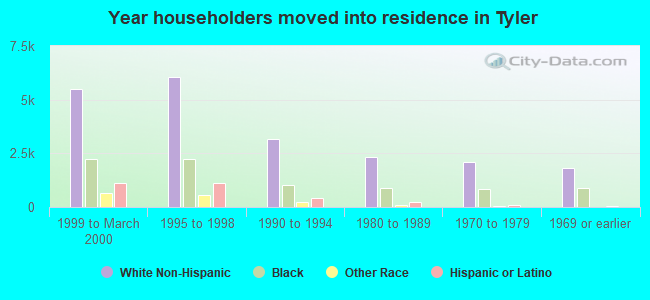
Year householder moved into unit - Moved in 1999 to March 2000 (%)
Year householder moved into unit - Moved in 1999 to March 2000 (%) - White
Year householder moved into unit - Moved in 1999 to March 2000 (%) - Black or African American
Year householder moved into unit - Moved in 1999 to March 2000 (%) - Asian
Year householder moved into unit - Moved in 1999 to March 2000 (%) - Hispanic or Latino
Year householder moved into unit - Moved in 1999 to March 2000 (%) - American Indian and Alaska Native
Year householder moved into unit - Moved in 1999 to March 2000 (%) - Multirace
Year householder moved into unit - Moved in 1999 to March 2000 (%) - Other Race
Year householder moved into unit - Moved in 1995 to 1998 (%)
Year householder moved into unit - Moved in 1995 to 1998 (%) - White
Year householder moved into unit - Moved in 1995 to 1998 (%) - Black or African American
Year householder moved into unit - Moved in 1995 to 1998 (%) - Asian
Year householder moved into unit - Moved in 1995 to 1998 (%) - Hispanic or Latino
Year householder moved into unit - Moved in 1995 to 1998 (%) - American Indian and Alaska Native
Year householder moved into unit - Moved in 1995 to 1998 (%) - Multirace
Year householder moved into unit - Moved in 1995 to 1998 (%) - Other Race
Year householder moved into unit - Moved in 1990 to 1994 (%)
Year householder moved into unit - Moved in 1990 to 1994 (%) - White
Year householder moved into unit - Moved in 1990 to 1994 (%) - Black or African American
Year householder moved into unit - Moved in 1990 to 1994 (%) - Asian
Year householder moved into unit - Moved in 1990 to 1994 (%) - Hispanic or Latino
Year householder moved into unit - Moved in 1990 to 1994 (%) - American Indian and Alaska Native
Year householder moved into unit - Moved in 1990 to 1994 (%) - Multirace
Year householder moved into unit - Moved in 1990 to 1994 (%) - Other Race
Year householder moved into unit - Moved in 1980 to 1989 (%)
Year householder moved into unit - Moved in 1980 to 1989 (%) - White
Year householder moved into unit - Moved in 1980 to 1989 (%) - Black or African American
Year householder moved into unit - Moved in 1980 to 1989 (%) - Asian
Year householder moved into unit - Moved in 1980 to 1989 (%) - Hispanic or Latino
Year householder moved into unit - Moved in 1980 to 1989 (%) - American Indian and Alaska Native
Year householder moved into unit - Moved in 1980 to 1989 (%) - Multirace
Year householder moved into unit - Moved in 1980 to 1989 (%) - Other Race
Year householder moved into unit - Moved in 1970 to 1979 (%)
Year householder moved into unit - Moved in 1970 to 1979 (%) - White
Year householder moved into unit - Moved in 1970 to 1979 (%) - Black or African American
Year householder moved into unit - Moved in 1970 to 1979 (%) - Asian
Year householder moved into unit - Moved in 1970 to 1979 (%) - Hispanic or Latino
Year householder moved into unit - Moved in 1970 to 1979 (%) - American Indian and Alaska Native
Year householder moved into unit - Moved in 1970 to 1979 (%) - Multirace
Year householder moved into unit - Moved in 1970 to 1979 (%) - Other Race
Year householder moved into unit - Moved in 1969 or earlier (%)
Year householder moved into unit - Moved in 1969 or earlier (%) - White
Year householder moved into unit - Moved in 1969 or earlier (%) - Black or African American
Year householder moved into unit - Moved in 1969 or earlier (%) - Asian
Year householder moved into unit - Moved in 1969 or earlier (%) - Hispanic or Latino
Year householder moved into unit - Moved in 1969 or earlier (%) - American Indian and Alaska Native
Year householder moved into unit - Moved in 1969 or earlier (%) - Multirace
Year householder moved into unit - Moved in 1969 or earlier (%) - Other Race
Housing units lacking complete plumbing facilities (%)
Housing units lacking complete kitchen facilities (%)
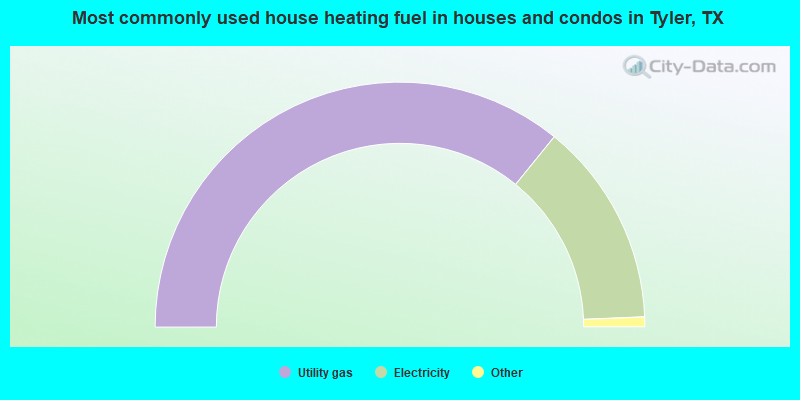
House heating fuel used in houses and condos - Utility gas (%)
House heating fuel used in houses and condos - Bottled, tank, or LP gas (%)
House heating fuel used in houses and condos - Electricity (%)
House heating fuel used in houses and condos - Fuel oil, kerosene, etc. (%)
House heating fuel used in houses and condos - Coal or coke (%)
House heating fuel used in houses and condos - Wood (%)
House heating fuel used in houses and condos - Solar energy (%)
House heating fuel used in houses and condos - Other fuel (%)
House heating fuel used in houses and condos - No fuel used (%)
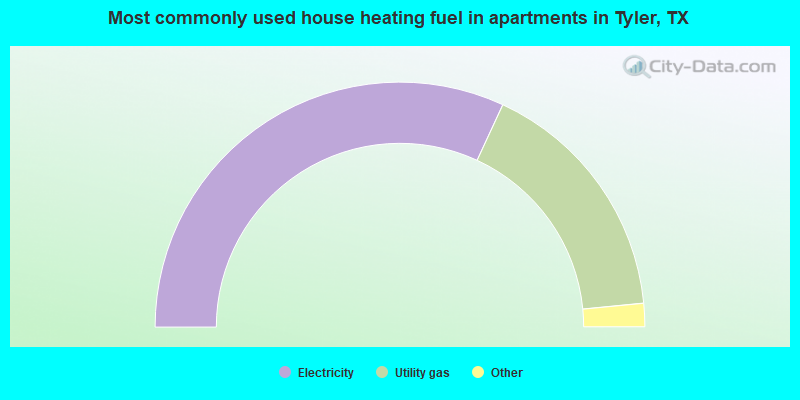
House heating fuel used in apartments - Utility gas (%)
House heating fuel used in apartments - Bottled, tank, or LP gas (%)
House heating fuel used in apartments - Electricity (%)
House heating fuel used in apartments - Fuel oil, kerosene, etc. (%)
House heating fuel used in apartments - Coal or coke (%)
House heating fuel used in apartments - Wood (%)
House heating fuel used in apartments - Solar energy (%)
House heating fuel used in apartments - Other fuel (%)
House heating fuel used in apartments - No fuel used (%)
Latest news about housing in Tyler, TX collected exclusively by city-data.com from local newspapers, TV, and radio stations
Median year house/condo built: 1980Median year apartment built: 1979Household type by relationship:
Households: 109,277
Male householders: 15,756 (4,235 living alone ), Female householders: 21,766 (7,847 living alone )16,041 spouses (15,699 opposite-sex spouses ), 1,428 unmarried partners , (1,428 opposite-sex unmarried partners ), 34,541 children (32,029 natural , 818 adopted , 1,694 stepchildren ), 4,347 grandchildren , 1,928 brothers or sisters , 1,730 parents , 0 foster children , 1,611 other relatives , 5,482 non-relatives In group quarters: 4,647
Size of family households: 10,056 2-persons , 4,104 3-persons , 4,941 4-persons , 1,782 5-persons , 1,240 6-persons , 832 7-or-more-persons .
Size of nonfamily households: 12,082 1-person , 1,912 2-persons , 404 3-persons , 137 4-persons , 32 5-persons .
15,762 married couples with children. single-parent households (701 men , 5,845 women ).
79.7% of residents of Tyler speak English at home. of residents speak Spanish at home (53% speak English very well , 19% speak English well , 20% speak English not well , 8% don't speak English at all ).of residents speak other Indo-European language at home (61% speak English very well , 34% speak English well , 4% speak English not well ).of residents speak Asian or Pacific Island language at home (62% speak English very well , 28% speak English well , 8% speak English not well , 2% don't speak English at all ).of residents speak other language at home (83% speak English very well , 17% speak English well ).
Foreign born population: 9,683 (8.9%)of them are naturalized citizens )
Median number of rooms in houses and condos:
Median number of rooms in apartments
Owner-occupied Renter-occupied
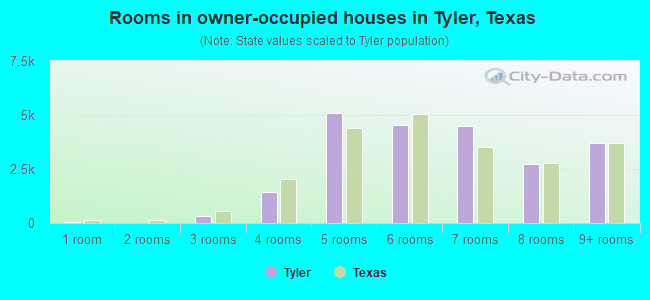
Rooms in owner-occupied houses in Tyler, Texas
25 1 room 0 2 rooms 343 3 rooms 1,415 4 rooms 5,075 5 rooms 4,539 6 rooms 4,512 7 rooms 2,731 8 rooms 3,695 9+ rooms
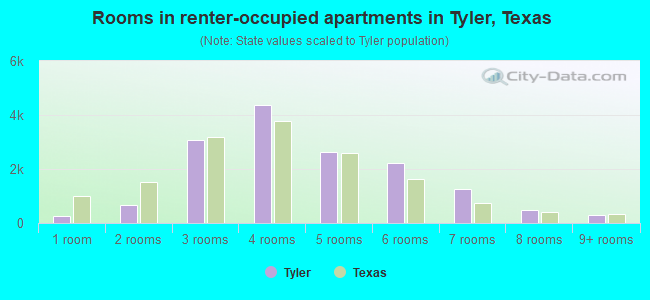
Rooms in renter-occupied apartments in Tyler, Texas
259 1 room 653 2 rooms 3,073 3 rooms 4,366 4 rooms 2,623 5 rooms 2,204 6 rooms 1,252 7 rooms 474 8 rooms 283 9+ rooms
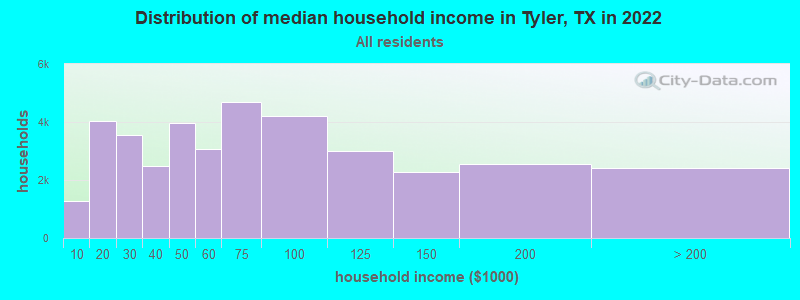
Tyler, TX household income distribution 1,282 Less than $10,0004,035 $10,000 to $19,9993,550 $20,000 to $29,9992,475 $30,000 to $39,9993,959 $40,000 to $49,9993,056 $50,000 to $59,9994,704 $60,000 to $74,9994,208 $75,000 to $99,9993,009 $100,000 to $124,9992,270 $125,000 to $149,9992,547 $150,000 to $199,9992,427 $200,000 or more
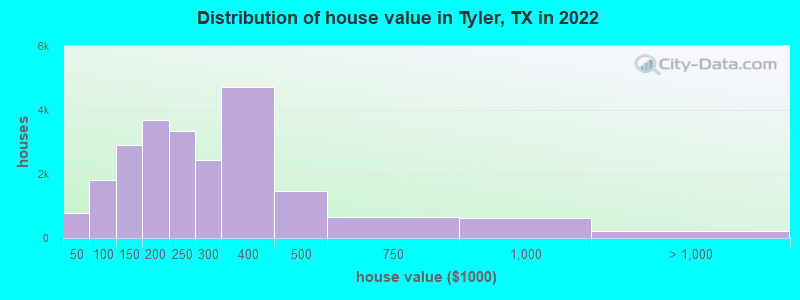
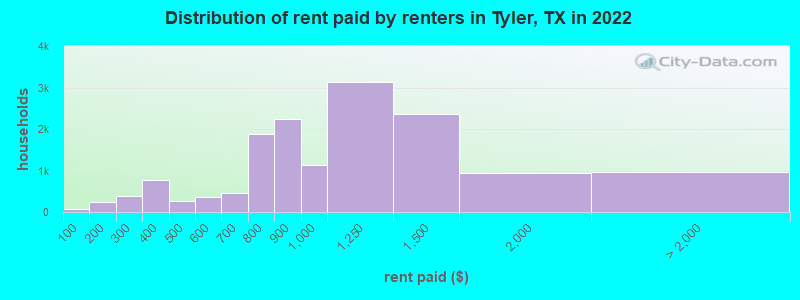
Home value of owner - occupied houses in 2022 in Tyler, TX 158 $10,000 to $14,999330 $20,000 to $24,999300 $40,000 to $49,999288 $50,000 to $59,999184 $60,000 to $69,999293 $70,000 to $79,999601 $80,000 to $89,999152 $90,000 to $99,9991,561 $100,000 to $124,9991,330 $125,000 to $149,9992,075 $150,000 to $174,9991,601 $175,000 to $199,9993,333 $200,000 to $249,9992,442 $250,000 to $299,9994,709 $300,000 to $399,9991,472 $400,000 to $499,999660 $500,000 to $749,999613 $750,000 to $999,999168 $1,000,000 to $1,499,99965 $2,000,000 or moreRent paid by renters in 2022 in Tyler, TX 61 Less than $100253 $150 to $199259 $200 to $249118 $250 to $299196 $300 to $349567 $350 to $399277 $400 to $449186 $500 to $549169 $550 to $599278 $600 to $649174 $650 to $6991,082 $700 to $749809 $750 to $7992,230 $800 to $8991,143 $900 to $9993,130 $1,000 to $1,2492,363 $1,250 to $1,499930 $1,500 to $1,999455 $2,000 to $2,49978 $2,500 to $2,99946 $3,000 to $3,499383 No cash rent
Percentage of workers working in this county: 91.7%Number of people working at home: 4,268 (8.1% of all workers )
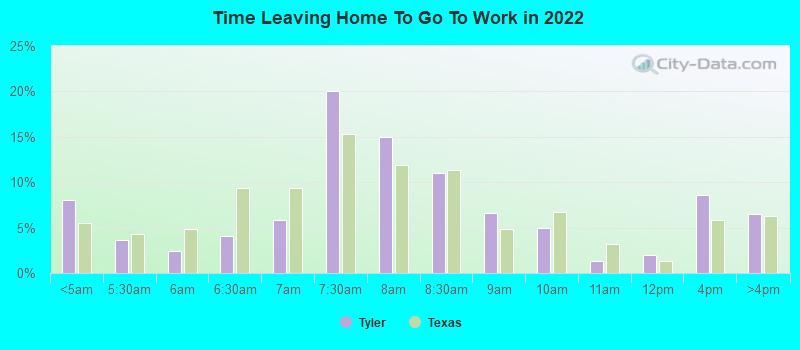
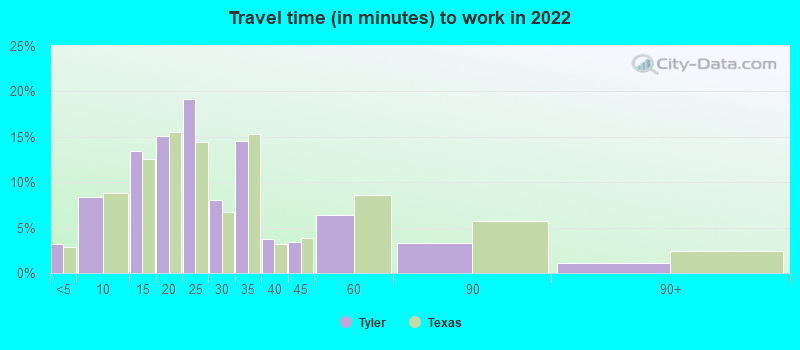
Travel time to work (commute)
Less than 5 minutes: 1,3925 to 9 minutes: 5,22510 to 14 minutes: 8,63615 to 19 minutes: 8,38720 to 24 minutes: 9,91225 to 29 minutes: 3,06130 to 34 minutes: 4,35735 to 39 minutes: 84540 to 44 minutes: 81645 to 59 minutes: 1,38560 to 89 minutes: 91490 or more minutes: 513
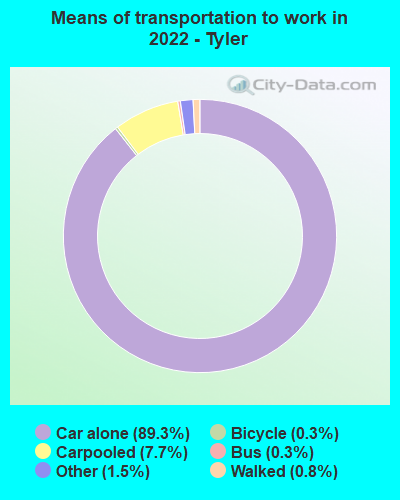
Means of transportation to work:
Drove a car alone: 70,943 (83.6%)Carpooled: 6,604 (7.8%)Bus : 237 (0.3%)Light rail, streetcar or trolley : 12 (0.0%)Ferryboat: 18 (0.0%)Taxi: 1,489 (1.8%)Bicycle: 213 (0.3%)Walked: 1,003 (1.2%)Worked at home: 3,950 (4.7%)
Unemployment by race in 2022
Unemployment rate for White non-Hispanic residents 3.6% Males2.9% FemalesUnemployment rate for Black residents 17.6% Males2.3% FemalesUnemployment rate for American Indian and Alaska Native residents 13.4% MalesUnemployment rate for Asian residents 7.5% FemalesUnemployment rate for other race residents 3.4% Males1.2% FemalesUnemployment rate for two or more race residents 3.1% Males0.1% FemalesUnemployment rate for Hispanic or Latino residents 4.3% Males1.3% Females
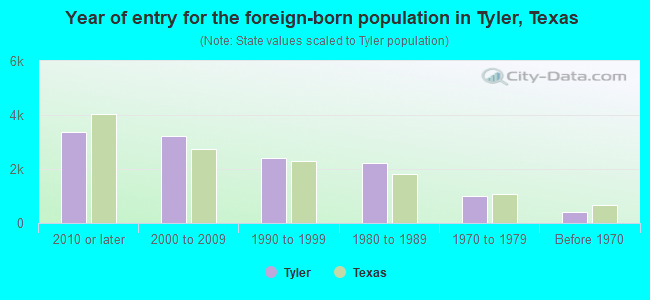
Year of entry for the foreign-born population in Tyler, Texas
3,385 2010 or later 3,215 2000 to 2009 2,414 1990 to 1999 2,208 1980 to 1989 1,001 1970 to 1979 389 Before 1970
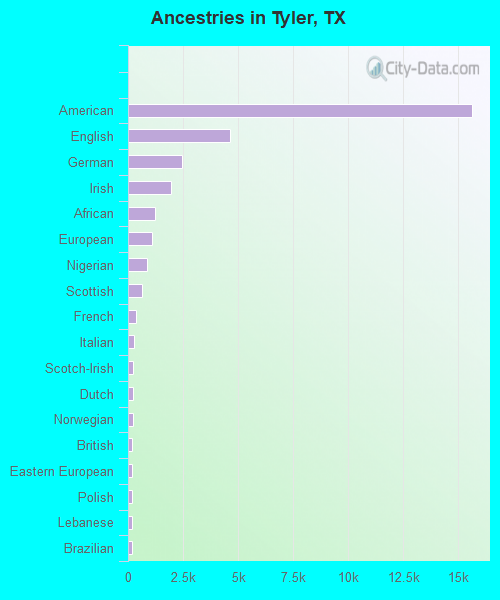
First ancestries reported:
American: 15,626 (22.1%)
English: 4,648 (6.6%)
German: 2,440 (3.5%)
Irish: 1,933 (2.7%)
African: 1,224 (1.7%)
European: 1,082 (1.5%)
Nigerian: 881 (1.2%)
Scottish: 647 (0.9%)
French: 383 (0.5%)
Italian: 291 (0.4%)
Scotch-Irish: 244 (0.3%)
Dutch: 234 (0.3%)
Norwegian: 219 (0.3%)
British: 200 (0.3%)
Eastern European: 184 (0.3%)
Polish: 182 (0.3%)
Lebanese: 165 (0.2%)
Brazilian: 162 (0.2%)
Russian: 86 (0.1%)
Turkish: 84 (0.1%)
Hungarian: 78 (0.1%)
Swedish: 72 (0.1%)
Scandinavian: 70 (0.10%)
Kenyan: 70 (0.10%)
Iranian: 69 (0.10%)
Northern European: 65 (0.09%)
Czech: 60 (0.08%)
Welsh: 58 (0.08%)
Ghanaian: 57 (0.08%)
Greek: 44 (0.06%)
Jordanian: 37 (0.05%)
Cajun: 33 (0.05%)
Romanian: 33 (0.05%)
Palestinian: 31 (0.04%)
French Canadian: 25 (0.04%)
Serbian: 25 (0.04%)
Portuguese: 25 (0.04%)
Cypriot: 24 (0.03%)
Danish: 20 (0.03%)
Finnish: 19 (0.03%)
Canadian: 15 (0.02%)
Australian: 12 (0.02%)
Slavic: 11 (0.02%)
Ethiopian: 11 (0.02%)
Trinidadian and Tobagonian: 10 (0.01%)
Celtic: 9 (0.01%)
Swiss: 7 (0.01%)
Syrian: 4 (0.01%)
Most common places of birth for foreign-born residents (%): Mexico Tyler:
55.7% (6,588)Texas:
48.4% (2,411,723)
Nigeria Tyler:
4.5% (531)Texas:
1.9% (96,110)
Philippines Tyler:
3.6% (426)Texas:
2.1% (103,148)
Honduras Tyler:
3.4% (402)Texas:
3.0% (147,182)
El Salvador Tyler:
2.6% (311)Texas:
4.5% (224,455)
Vietnam Tyler:
2.5% (299)Texas:
3.7% (184,770)
Venezuela Tyler:
2.3% (267)Texas:
1.5% (72,413)
China, excluding Hong Kong and Taiwan Tyler:
2.1% (249)Texas:
2.3% (115,558)
India Tyler:
1.9% (225)Texas:
6.1% (306,347)
Korea Tyler:
1.9% (223)Texas:
1.2% (60,172)
Place of birth for U.S.-born residents:
This state: 76,965Other state: 21,434Northeast: 2,229Midwest: 4,252South: 9,276West: 5,677 87.7% of Tyler residents lived in the same house 1 years ago.
Out of people who lived in different houses, 34.5% lived in this county.
Out of people who lived in different counties, 72.6% lived in Texas.
Tyler:
87.7%State average:
85.7%
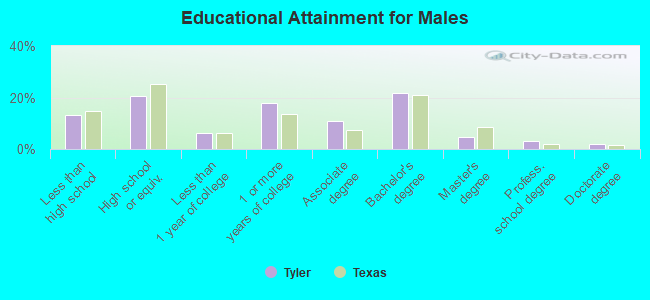
Education attainment for males 25 years and older:
No schooling: 574Nursery to 4th grade: 1835th and 6th grade: 1,0407th and 8th grade: 5019th grade: 22710th grade: 74511th grade: 65412th grade, no diploma: 148High school graduate (or equivalency): 6,259Less than 1 year of college: 1,898Some college more than 1 year, no degree: 5,432Associate degree: 3,346Bachelor's degree: 6,615Master's degree: 1,375Professional school degree: 1,005Doctorate degree: 579
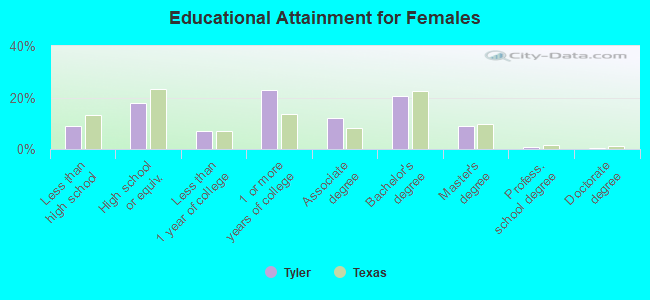
Education attainment for females 25 years and older:
No schooling: 513Nursery to 4th grade: 1195th and 6th grade: 7517th and 8th grade: 3949th grade: 28910th grade: 33011th grade: 34312th grade, no diploma: 436High school graduate (or equivalency): 6,498Less than 1 year of college: 2,494Some college more than 1 year, no degree: 8,325Associate degree: 4,399Bachelor's degree: 7,444Master's degree: 3,178Professional school degree: 341Doctorate degree: 188
Housing units in structures:
One, detached: 29,369One, attached: 1,617Two: 1,6293 or 4: 1,1575 to 9: 4,42410 to 19: 3,89120 to 49: 74250 or more: 1,501Mobile homes: 997Boats, RVs, vans, etc.: 25Median worth of mobile homes: $142,329
Housing units lacking complete plumbing facilities in 2022: 10.3%Housing units lacking complete kitchen facilities in 2022: 3.7%House/condo owner moved in on average 10 years ago
Renter moved in on average 2 years ago
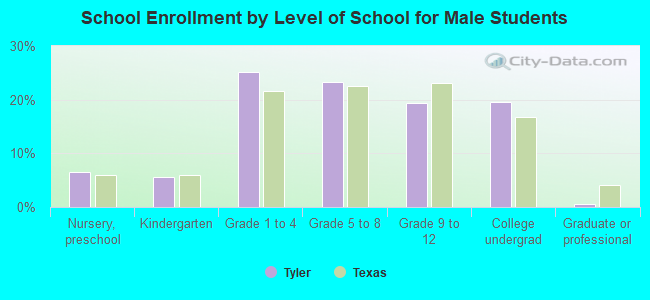
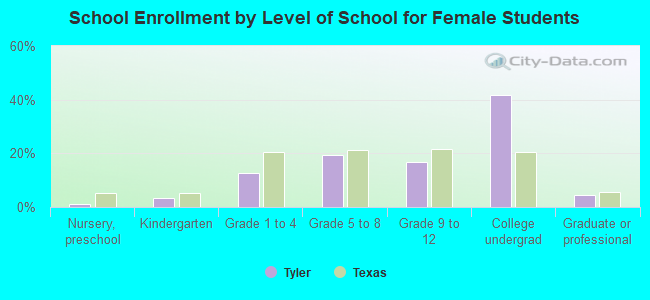
Private vs. public school enrollment:
Students in private schools in grades 1 to 8 (elementary and middle school): 1,159 Students in private schools in grades 9 to 12 (high school): 538 Students in private undergraduate colleges: 1,398