Upper Big Bigby, TN (Tennessee) Houses and Residents
| Upper Big Bigby: | $285,585 |
| Tennessee: | $284,800 |
Total population: 9,488 (Urban population: 4,109 (all inside urban clusters), Rural population: 4,114 (238 farm, 3,876 nonfarm))
Houses: 3,464 (3,185 occupied: 2,316 owner occupied, 869 renter occupied)
| % of renters here: | 27% |
| State: | 33% |
Housing density: 34 houses/condos per square mile
Median price asked for vacant for-sale houses and condos in 2022 in this county: $642,492.
Median contract rent in 2022: $803 (lower quartile is $631, upper quartile is $1,253)
Median rent asked for vacant for-rent units in 2022: $944
Median gross rent in Upper Big Bigby, TN in 2022: $968
Housing units in Upper Big Bigby with a mortgage: 1,113 (91 second mortgage, 69 home equity loan, 7 both second mortgage and home equity loan)
Houses without a mortgage: 620


Household type by relationship:
Households: 79,947- In family households: 68,892 (15,712 male householders, 6,737 female householders)
16,490 spouses, 23,112 children (21,164 natural, 628 adopted, 1,320 stepchildren), 2,173 grandchildren, 664 brothers or sisters, 635 parents, foster children, 1,015 other relatives, 1,878 non-relatives
- In nonfamily households: 11,055 (4,086 male householders (3,213 living alone)), 5,128 female householders (4,492 living alone)), 1,841 nonrelatives
- In group quarters: 1,009 (890 institutionalized population)
11,882 married couples with children.
4,148 single-parent households (821 men, 3,327 women).
99.0% of residents of Upper Big Bigby speak English at home.
0.5% of residents speak Spanish at home (100% speak English very well).
0.5% of residents speak other Indo-European language at home (85% speak English very well, 15% speak English well).
Foreign born population: 26 (0.2%)
(146.2% of them are naturalized citizens)
| Here: | 5.6 |
| State: | 6.5 |
| Here: | 4.6 |
| State: | 4.4 |

- Bedrooms in owner-occupied houses and condos in Upper Big Bigby, Tennessee
- 0no bedroom
- 421 bedroom
- 4652 bedrooms
- 1,4043 bedrooms
- 3324 bedrooms
- 735+ bedrooms

- Bedrooms in renter-occupied apartments in Upper Big Bigby, Tennessee
- 23no bedroom
- 1341 bedroom
- 3602 bedrooms
- 3083 bedrooms
- 304 bedrooms
- 145+ bedrooms

- Cars and other vehicles available in Upper Big Bigby in owner-occupied houses/condos
- 74no vehicle
- 5081 vehicle
- 1,1132 vehicles
- 4353 vehicles
- 1514 vehicles
- 355+ vehicles

- Cars and other vehicles available in Upper Big Bigby in renter-occupied apartments
- 107no vehicle
- 4741 vehicle
- 1902 vehicles
- 633 vehicles
- 94 vehicles
- 265+ vehicles

- Rooms in owner-occupied houses in Upper Big Bigby, Tennessee
- 01 room
- 92 rooms
- 493 rooms
- 1244 rooms
- 7655 rooms
- 6196 rooms
- 3907 rooms
- 1328 rooms
- 2289+ rooms

- Rooms in renter-occupied apartments in Upper Big Bigby, Tennessee
- 231 room
- 272 rooms
- 1213 rooms
- 1744 rooms
- 2595 rooms
- 1626 rooms
- 457 rooms
- 588 rooms
- 09+ rooms


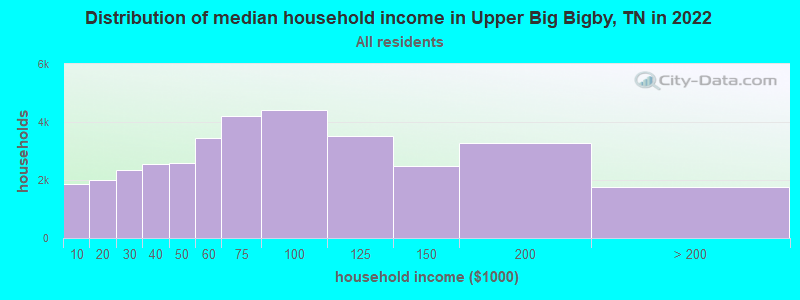
Upper Big Bigby, TN household income distribution

- 1,870Less than $10,000
- 2,002$10,000 to $19,999
- 2,357$20,000 to $29,999
- 2,546$30,000 to $39,999
- 2,592$40,000 to $49,999
- 3,437$50,000 to $59,999
- 4,198$60,000 to $74,999
- 4,430$75,000 to $99,999
- 3,511$100,000 to $124,999
- 2,469$125,000 to $149,999
- 3,282$150,000 to $199,999
- 1,755$200,000 or more
Percentage of workers working in this county: 78.0%
Number of people working at home: 606 (12.8% of all workers)
Travel time to work (commute)
- Less than 5 minutes: 90
- 5 to 9 minutes: 377
- 10 to 14 minutes: 456
- 15 to 19 minutes: 475
- 20 to 24 minutes: 696
- 25 to 29 minutes: 212
- 30 to 34 minutes: 490
- 35 to 39 minutes: 60
- 40 to 44 minutes: 80
- 45 to 59 minutes: 353
- 60 to 89 minutes: 208
- 90 or more minutes: 182
Means of transportation to work:
- Drove a car alone: 3,041 (81.2%)
- Carpooled: 570 (15.2%)
- Bus or trolley bus: 9 (0.2%)
- Bicycle: 8 (0.2%)
- Walked: 41 (1.1%)
- Other means: 10 (0.3%)
- Worked at home: 66 (1.8%)


- Year of entry for the foreign-born population in Upper Big Bigby, Tennessee
- 01995 to March 2000
- 01990 to 1994
- 01985 to 1989
- 01980 to 1984
- 01975 to 1979
- 01970 to 1974
- 01965 to 1969
- 12Before 1965
Most common places of birth for foreign-born residents (%):
| Upper Big Bigby: | 100.0% (12) |
| Tennessee: | 0.6% (974) |
Place of birth for U.S.-born residents:
- This state: 6,279
- Other state: 1,913
- Northeast: 183
- Midwest: 702
- South: 890
- West: 138
61% of Upper Big Bigby residents lived in the same house 5 years ago.
Out of people who lived in different houses, 69% lived in this county.
Out of people who lived in different counties, 53% lived in Tennessee.
Education attainment for males 25 years and older:
- No schooling: 38
- Nursery to 4th grade: 27
- 5th and 6th grade: 46
- 7th and 8th grade: 154
- 9th grade: 65
- 10th grade: 111
- 11th grade: 56
- 12th grade, no diploma: 91
- High school graduate (or equivalency): 1,082
- Less than 1 year of college: 165
- Some college more than 1 year, no degree: 295
- Associate degree: 112
- Bachelor's degree: 141
- Master's degree: 28
- Professional school degree: 19
- Doctorate degree: 15

Education attainment for females 25 years and older:
- No schooling: 6
- Nursery to 4th grade: 28
- 5th and 6th grade: 29
- 7th and 8th grade: 204
- 9th grade: 117
- 10th grade: 96
- 11th grade: 139
- 12th grade, no diploma: 134
- High school graduate (or equivalency): 1,201
- Less than 1 year of college: 332
- Some college more than 1 year, no degree: 333
- Associate degree: 129
- Bachelor's degree: 129
- Master's degree: 77
- Professional school degree: 0
- Doctorate degree: 0


Housing units in structures:
- One, detached: 2,465
- One, attached: 60
- Two: 123
- 3 or 4: 104
- 5 to 9: 69
- 10 to 19: 25
- 20 to 49: 80
- Mobile homes: 538
Median worth of mobile homes: $200,672
Housing units lacking complete kitchen facilities: 1.6%

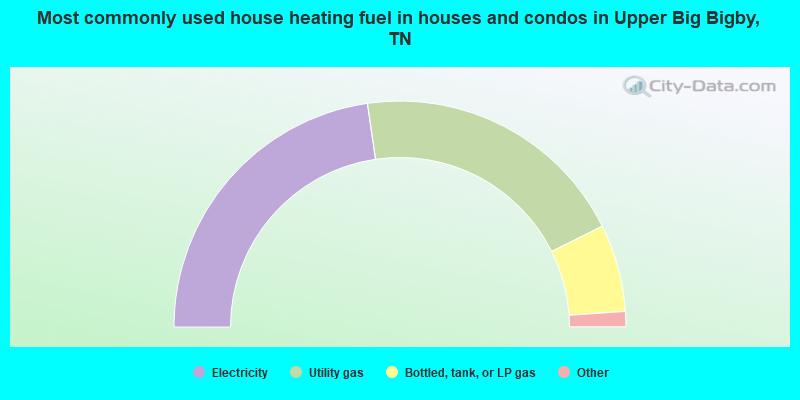
- 45.4%Electricity
- 39.9%Utility gas
- 12.5%Bottled, tank, or LP gas
- 1.7%Wood
- 0.5%Fuel oil, kerosene, etc.
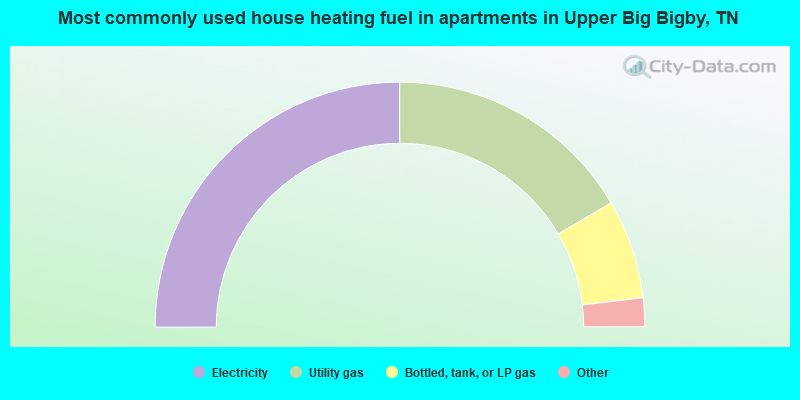
- 49.9%Electricity
- 33.1%Utility gas
- 13.1%Bottled, tank, or LP gas
- 2.1%Wood
- 1.7%Fuel oil, kerosene, etc.
Private vs. public school enrollment:
| Here: | 10.3% |
| Tennessee: | 9.5% |
| Here: | 23.3% |
| Tennessee: | 10.4% |
| Here: | 14.1% |
| Tennessee: | 22.8% |


